Managerial economics theory and practice phần 3 pps
Bạn đang xem bản rút gọn của tài liệu. Xem và tải ngay bản đầy đủ của tài liệu tại đây (755.17 KB, 75 trang )
To see this, consider the increase in the demand for restaurant meals in
the United States that developed during the 1970s. This increase in demand
for restaurant meals resulted in an increase in the price of eating out, which
increased the profits of restauranteurs. The increase in profits attracted
investment capital into the industry. As the output of restaurant meals
increased, the increased demand for restaurant workers resulted in higher
wages and benefits. This attracted workers into the restaurant industry and
away from other industries, where the diminished demand for labor
resulted in lower wages and benefits.
CHAPTER REVIEW
The interaction of supply and demand is the primary mechanism for
the allocations of goods, services, and productive resources in market
economies. A market system comprises markets for productive resources
and markets for final goods and services.
The law of demand states that a change in quantity demanded of a good
or service is inversely related to a change in the selling price, other factors
(demand determinants) remaining unchanged. Other demand determinants
include income, tastes and preferences, prices of related goods and services,
number of buyers, and price expectations.
The law of demand is illustrated graphically with a demand curve, which
slopes downward from left to right, with price on the vertical axis and quan-
tity on the horizontal axis. A change in the quantity demanded of a good,
service, or productive resource resulting from a change in the selling price
is depicted as a movement along the demand curve.A change in demand for
a good or service results from a change in a nonprice demand determinant,
other factors held constant, including the price of the good or service under
consideration. An increase in per-capita income, for example, results in an
increase in the demand for most goods and services and is illustrated as a
shift of the demand curve to the right.
The law of supply states that a change in quantity supplied of a good or
service is directly related to the selling price, other factors (supply deter-
minants) held constant. Other supply determinants include factor costs,
technology, prices of other goods the producers can supply, number of firms
producing the good or service, price expectations, and weather conditions.
The law of supply is illustrated graphically with a supply curve, which
slopes upward from left to right with price on the vertical axis and quan-
tity on the horizontal axis. A change in the quantity supplied of a good or
service resulting from a change in the selling price is depicted as a move-
ment along the supply curve.A change in supply of a good or service results
from a change in some other supply demand determinant, other factors held
constant, including the price of the good or service under consideration. An
chapter review 137
increase in the number of firms producing the good, for example, will result
in a shift of the supply curve to the right.
Market equilibrium exists when the quantity supplied is equal to quan-
tity demanded. The price that equates quantity supplied with quantity
demanded is called the equilibrium price. If the price rises above the equi-
librium price, the quantity supplied will exceed the quantity demanded,
resulting in a surplus (excess supply). If the price falls below the equilib-
rium price, quantity demanded will exceed the quantity supplied, resulting
in a shortage (excess demand).
An increase or a decrease in price to clear the market of a surplus or a
shortage is referred to as the rationing function of prices.The rationing func-
tion is considered to be a short-run phenomenon. In the short run, one or
more explanatory variables are assumed to be constant. A price ceiling is a
government-imposed maximum price for a good or service produced by
a given industry. Price ceilings create market shortages that require
a non–price rationing mechanism to allocate available supplies of goods and
services. There are a number of non-price rationing mechanisms, including
ration coupons, queuing, favored customers, and black markets.
The allocating function of price, on the other hand, is assumed to be
a long-run phenomenon. In the long run, all explanatory variables are
assumed to be variable. In the long run, price changes signal consumers and
producers to devote more or less of their resources to the consumption and
production of goods and services. In other words, the allocating function of
price allows for changes in all demand and supply determinants.
KEY TERMS AND CONCEPTS
Allocating function of price The process by which productive resources
are reallocated between and among production processes in response to
changes in the prices of goods and services.
Change in demand Results from a change in one or more demand deter-
minants (income, tastes, prices of complements, prices of substitutes,
price expectations, income expectations, number of consumers, etc.) that
causes an increase in purchases of a good or service at all prices. An
increase in demand is illustrated diagrammatically as a right-shift in the
entire demand curve. A decrease in demand is illustrated diagrammati-
cally as a left-shift in the entire demand curve.
Change in supply Results from a change in one or more supply determi-
nants (prices of productive inputs, technology, price expectations, taxes
and subsidies, number of firms in the industry, etc.) that causes an
increase in the supply of a good or service at all prices. An increase in
supply is illustrated diagrammatically as a right-shift in the entire supply
curve.A decrease in supply curve is illustrated diagrammatically as a left-
shift in the entire supply curve.
138 the essentials of demand and supply
Change in quantity demanded Results from a change in the price of a
good or service. As the price of a good or service rises (falls), the quan-
tity demanded decreases (increases). An increase in the quantity
demanded of a good or service is illustrated diagrammatically as a move-
ment from the left to the right along a downward-sloping demand curve.
A decrease in the quantity demanded of a good or service is illustrated
diagrammatically as a movement from the right to the left along a
downward-sloping demand curve.
Change in quantity supplied Results from a change in the price of a good
or service. As the price of a good or service rises (falls), the quantity sup-
plied increases (decreases). An increase in the quantity supplied of a
good or service is illustrated diagrammatically as a movement from the
left to the right to left along an upward-sloping demand curve. A
decrease in the quantity supplied of a good or service is illustrated dia-
grammatically as a movement from the right to the left along an upward-
sloping supply curve.
Demand curve A diagrammatic illustration of the quantities of a good or
service that consumers are willing and able to purchase at various prices,
assuming that the influence of other demand determinants remaining
unchanged.
Demand determinants Nonprice factors that influence consumers’ deci-
sions to purchase a good or service. Demand determinants include,
income, tastes, prices of complements, prices of substitutes, price expec-
tations, income expectations, and number of consumers.
Equilibrium price The price at which the quantity demanded equals the
quantity supplied of that good or service.
Favored customer Describing a non–price rationing mechanism in which
certain individuals receive special treatment. In the extreme, the favored
customer as a form of non–price rationing may take the form of racial,
religious, and other forms of group discrimination.
Law of demand The change in the quantity demanded of a good or a
service is inversely related to its selling price, all other influences affect-
ing demand remaining unchanged (ceteris paribus).
Law of supply The change in the quantity supplied of a good or a service
is positively related to its selling price, all other influences affecting
supply remaining unchanged (ceteris paribus).
Market equilibrium Conditions under which the quantity supplied of a
good or a service is equal to quantity demanded of that same good or
service. Market equilibrium occurs at the equilibrium price.
Market power Refers to the ability to influence the market price of a good
by shifting the demand curve or the supply curve of a good or a service.
In perfectly competitive markets, individual consumers and individual
suppliers do not have market power.
Movement along the demand curve The result of a change in the quan-
tity demanded of a good or a service.
key terms and concepts 139
Movement along the supply curve The result of a change in the quantity
supplied of a good or service.
Price ceiling The maximum price that firms in an industry can charge for
a good or service.Typically imposed by governments to achieve an objec-
tive perceived as socially desirable, price ceilings often result in ineffi-
cient economic, and social, outcomes.
Price floor A legally imposed minimum price that may be charged for a
good or service.
Queuing A non–price rationing mechanism that involves waiting in line.
Ration coupons Coupons or tickets that entitle the holder to purchase a
given amount of a particular good or service during a given time period.
Ration coupons are sometimes used when the price rationing mechanism
of the market is not permitted to operate, as when, say, the government
has imposed a price ceiling.
Rationing function of price The increase or a decrease in the market price
to eliminate a surplus or a shortage of a good or service. The rationing
function is considered to operate in the short run because other demand
determinants are assumed to be constant.
Shift of the demand curve The result of a change in the demand for a good
or a service.
Shift of the supply curve The result of a change in the supply of a good
or a service.
Shortage The result that occurs when the quantity demanded of a good
or a service exceeds the quantity supplied of that same good or service.
Shortages exist when the market price is below the equilibrium (market
clearing) price.
Supply curve A diagrammatic illustration of the quantities of a good or
service firms are willing and able to supply at various prices, assuming
that the influence of other supply determinants remains unchanged.
Surplus The result that occurs the quantity supplied of a good or a service
exceeds the quantity demanded of that same good or service. Surpluses
exist when the market price is above the equilibrium (market clearing)
price.
Waiting list A version of queuing.
CHAPTER QUESTIONS
3.1 Define and give an example of each of the following demand terms
and concepts. Illustrate diagrammatically a change in each.
a. Quantity demanded
b. Demand
c. Market demand curve
140 the essentials of demand and supply
d. Normal good
e. Inferior good
f. Substitute good
g. Complementary good
h. Price expectation
i. Income expectation
j. Advertising
k. Population
3.2 Define and give an example of each of the following supply terms
and concepts. Illustrate diagrammatically a change in each.
a. Quantity supplied
b. Supply
c. Market supply curve
d. Factor price
e. Technology
f. Price expectation
g. Advertising
h. Substitute good
i. Complementary good
j. Taxes
k. Subsidies
l. Number of firms
3.3 Does the following statement violate the law of demand? The quan-
tity demanded of diamonds declines as the price of diamonds declines
because the prestige associated with owning diamonds also declines.
3.4 In recent years there has been a sharp increase in commercial and
recreational fishing in the waters around Long Island. Illustrate the effect
of “overfishing” on inflation-adjusted seafood prices at restaurants in the
Long Island area.
3.5 New York City is a global financial center. In the late 1990s the finan-
cial and residential real estate markets reached record high price levels.Are
these markets related? Explain.
3.6 Large labor unions always support higher minimum wage legislation
even though no union member earns just the minimum wage. Explain.
3.7 Discuss the effect of a frost in Florida, which damaged a significant
portion of the orange crop, on each of the following
a. The price of Florida oranges
b. The price of California oranges
c. The price of tangerines
d. The price of orange juice
e. The price of apple juice
3.8 Discuss the effect of an imposition of a wine import tariff on the
price of California wine.
3.9 Explain and illustrate diagrammatically how the rent controls that
chapter questions 141
were imposed during World War II exacerbated the New York City housing
shortage during the 1960s and 1970s.
3.10 Explain what is meant by the rationing function of prices.
3.11 Discuss the possible effect of a price ceiling.
3.12 The use of ration coupons to eliminate a shortage can be effective
only if trading ration coupons is effectively prohibited. Explain.
3.13 Scalping tickets to concerts and sporting events is illegal in many
states. Yet, it may be argued that both the buyer and seller of “scalped”
tickets benefit from the transaction. Why, then, is scalping illegal? Who is
really being “scalped”? Explain.
3.14 The U.S. Department of Agriculture (USDA) is committed to a
system of agricultural price supports. To maintain the market price of
certain agricultural products at a specified level, the USDA has two policy
options. What are they? Illustrate diagrammatically the market effects of
both policies.
3.15 Minimum wage legislation represents what kind of market inter-
ference? What is the government’s justification for minimum wage legisla-
tion? Do you agree? Who gains from minimum wage legislation? Who
loses?
3.16 Explain the allocating function of prices. How does this differ from
the rationing function of prices?
CHAPTER EXERCISES
3.1 Yell-O Yew-Boats, Ltd. produces a popular brand of pointy birds
called Blue Meanies. Consider the demand and supply equations for Blue
Meanies:
where Q
x
= monthly per-family consumption of Blue Meanies
P
x
= price per unit of Blue Meanies
I = median annual per-family income = $25,000
P
y
= price per unit of Apple Bonkers = $5.00
W = hourly per-worker wage rate = $8.60
a. What type of good is an Apple Bonker?
b. What are the equilibrium price and quantity of Blue Meanies?
c. Suppose that median per-family income increases by $6,000.
What are the new equilibrium price and quantity of Blue Meanies?
d. Suppose that in addition to the increase in median per-family
ncome, collective bargaining by Blue Meanie Local #666 resulted in
QPW
xxS,
.=+ -60 4 2 5
QPIP
xx yD,
=-+ +150 2 0 001 1 5
142 the essentials of demand and supply
a $2.40 hourly increase in the wage rate. What are the new equilib
rium price and quantity?
e. In a single diagram, illustrate your answers to parts b, c, and d.
3.2 Consider the following demand and supply equations for sugar:
where P is the price of sugar per pound and Q is thousands of pounds of
sugar.
a. What are the equilibrium price and quantity for sugar?
b. Suppose that the government wishes to subsidize sugar production by
placing a floor on sugar prices of $0.20 per pound. What would be the
relationship between the quantity supplied and quantity demand for
sugar?
3.3 Occidental Pacific University is a large private university in
California that is known for its strong athletics program, especially in
football. At the request of the dean of the College of Arts & Sciences, a
professor from the economics department estimated a demand equation
for student enrollment at the university
where Q
x
is the number of full-time students, P
x
is the tuition charged
per full-time student per semester, I is real gross domestic product (GDP)
($ billions) and P
y
is the tuition charged per full-time student per semester
by Oriental Atlantic University in Maryland, Occidental Pacific’s closest
competitor on the grid iron.
a. Suppose that full-time enrollment at Occidental is 4,000 students. If
I = $7,500 and P
y
= $6,000, how much tuition is Occidental charging
its full-time students per semester?
b. The administration is considering a $750,000 promotional campaign
to bolster admissions and tuition revenues. The economics professor
believes that the promotional campaign will change the demand
equation to
If the professor is correct, what will Occidental’s full-time enrollment
be?
c. Assuming no change in real GDP and no change in full-time tuition
charged by Oriental, will the promotional campaign be effective?
(Hint: Compare Occidental’s tuition revenues before and after the
promotional campaign.)
QPIP
xxy
=- ++5 100 0 45 0 1 0 25,.
QPIP
xxy
=-++5000 05 01 025,
QP
S
=+800 1 000,
QP
D
=-1 000 1 000,,
chapter exercises 143
d. The director of Occidental’s athletic department claims that the
increase in enrollment resulted from the football team’s NCAA
Division I national championship. Is this claim reasonable? How
would it show up in the new demand equation?
3.4 The market demand and supply equations for a commodity are
a. What is the equilibrium price and equilibrium quantity?
b. Suppose the government imposes a price ceiling on the commodity
of $3.00 and demand increases to Q
D
= 75 - 10P. What is the impact
on the market of the government’s action?
c. In a single diagram, illustrate your answers to parts a and b.
3.5 The market demand for brand X has been estimated as
where P
x
is the price of brand X, I is per-capita income, P
y
is the price of
brand Y, and P
z
is the price of brand Z. Assume that P
x
= $2, I = $20,000,
P
y
= $4, and P
z
= $4.
a. With respect to changes in per-capita income, what kind of good is
brand X?
b. How are brands X and Y related?
c. How are brands X and Z related?
d. How are brands Z and Y related?
e. What is the market demand for brand X?
SELECTED READINGS
Baumol, W. J., and A. S. Blinder. Microeconomics: Principles and Policy, 8th ed. New York:
Dryden, 1999.
Boulding, K. E. Economic Analysis, Vol. 1, Microeconomics. New York: Harper & Row,
1966.
Case, K. E., and R. C. Fair. Principles of Macroeconomics, 5th ed. Upper Saddle River, NJ:
Prentice Hall, 1999.
Green, W. H. Econometric Analysis, 3rd ed. Upper Saddle River, NJ: Prentice-Hall, 1997.
Gujarati, D. Basic Econometrics, 3rd ed. New York: McGraw-Hill, 1995.
Marshall, A. Principles of Economics, 8th ed. London: Macmillan, 1920.
Ramanathan, R. Introductory Econometrics with Applications, 4th ed. New York: Dryden
Press, 1998.
Samuelson, P. A., and W. D. Nordhans. Economics, 12th ed. New York: McGraw-Hill,
1985.
Silberberg, E. The Structure of Economics: A Mathematical Analysis, 2nd ed. New York:
McGraw-Hill, 1990.
QPIPP
xx yz
= +1 500 3 0 05 2 5 7 5,
QP
S
=+20 2 5.
QP
D
=-50 10
144 the essentials of demand and supply
APPENDIX 3A
FORMAL DERIVATION OF THE DEMAND CURVE
The objective of the consumer is to maximize utility subject to a budget
constraint. The constrained utility maximization model may be formally
written as
(3A.1a)
(3A.1b)
where P
1
and P
2
are the prices of goods Q
1
and Q
2
, respectively, and M is
money income. The Lagrangian equation (see Chapter 2) for this problem
is
(3A.2)
The first-order conditions for utility maximization are
(3A.3a)
(3A.3b)
(3A.3c)
where ᏸ
i
=∂ᏸ/∂Q
i
and U
i
=∂U/∂Q
i
. Assuming that the second-order con-
ditions for constrained utility maximization are satisfied,
5
the solutions to
the system of Equations (3A.3) may be written as
(3A.4a)
(3A.4b)
(3A.4c)
Note that the parameters in Equations (3A.4) are prices and money
income. Equations (3A.4a) and (3A.4b) indicate the consumption levels for
any given set of prices and money income. Thus, these equations are com-
monly referred to as the money-held-constant demand curves.
Dividing Equation (3A.4a) by (3A.4b) yields
(3A.5)
or
(3A.6)
U
P
U
P
1
1
2
2
=
U
U
P
P
1
2
1
2
=
ll=
()
M
PPM
12
,,
QQ PPM
M2212
=
()
,
,,
QQ PPM
M1112
=
()
,
,,
ᏸ
l
=- - =MPQ PQ
11 22
0
ᏸ
22 2
0=- =UPl
ᏸ
11 1
0=- =UPl
ᏸ =
()
+
()
UQ Q M PQ PQ
12 11 22
, l
Subject to: MPQ PQ=+
11 22
Maximize:UUQQ=
()
12
,
appendix 3a 145
5
For an excellent discussion of the mathematics of utility maximization see Eugene
Silberberg (1990), Chapter 10.
Equation (3A.6) asserts that to maximize consumption, the consumer
must allocate budget expenditures such that the marginal utility obtained
from the last dollar spent on good Q
1
is the same as the marginal utility
obtained from the last dollar spent on Q
2
. For the n-good case, Equation
(3A.6) may be generalized as
(3A.7)
Problem 3A.1. Suppose that a consumer’s utility function is U = Q
1
2
Q
2
2
.
a. If P
1
= 5, P
2
= 10, and the consumer’s money income is M = 1,000, what
are the optimal values of Q
1
and Q
2
?
b. Derive the consumer’s demand equations for goods Q
1
and Q
2
. Verify
that the demand curves are downward sloping and convex with respect
to the origin.
Solution
a. The consumer’s budget constraint is
The Lagrangian equation for this problem is
The first-order conditions are
1. ᏸ
1
= 2Q
1
Q
2
2
- 5l=0
2. ᏸ
2
= 2Q
1
2
Q
2
- 10l=0
3. ᏸ
l
= 1,000 - 5Q
1
- 10Q
2
= 0
Dividing the first equation by the second yields
Substituting this result into the budget constraint yields
Substituting this result into the budget constraint yields
1 000 5 10 50 5 500
11
, =+
()
Q
2
50* =
1 000 5 2 10 20
222
, =
()
+=QQQ
12
2=
Q
Q
2
1
1
2
=
2
2
5
10
12
2
1
2
2
=
ᏸ =+
()
QQ Q Q
1
2
2
2
12
1 000 5 10l ,
1 000 5 10
12
U
P
U
P
U
P
n
n
1
1
2
2
===
146 the essentials of demand and supply
b. From the optimality condition [Equation (3A.5)]:
From the consumer’s utility function this becomes
Substituting this result into the budget constraint yields
For M = 1,000, the consumer’s demand equation for Q
1
is
Similarly, the consumer’s demand equation for Q
2
is
For a demand curve to be downward sloping, the first derivative with
respect to price must be negative. For a demand curve to be convex
with respect to the origin, the second derivative with respect to price
must be positive. The first and second derivatives of Q
1
with respect to
P
1
are
Similarly for Q
2
dQ
dP P P
2
1
1
2
1
3
1
3
2 500 1 000
0=
()
=>
,
dQ
dP
P
1
1
1
2
500
0=- <
Q
P
2
2
500
=
Q
P
1
1
500
=
Q
M
P
1
1
2
=
=+=PQ PQ PQ
11 11 11
2
MPQ P
P
P
Q=+
Ê
Ë
ˆ
¯
11 2
1
2
1
Q
P
P
Q
2
1
2
1
=
Ê
Ë
ˆ
¯
Q
Q
P
P
2
1
1
2
=
U
U
P
P
1
2
1
2
=
Q
1
100
*
=
5 500
1
Q =
chapter exercises 147
dQ
dP P P
2
2
2
2
2
3
2
3
2 500 1 000
0=
()
=>
,
dQ
dP
P
2
2
2
2
500
0=- <
148 the essentials of demand and supply
4
Additional Topics in
Demand Theory
149
Although the law of demand tells us that consumers will respond to a
price decline (increase) by purchasing more (less) of a given good or
service, it is important for a manager to know how sensitive is the demand
for the firm’s product, given changes in the price of the product and other
demand determinants. The decision maker must be aware of the degree to
which consumers respond to, say, a change in the product’s price, or to a
change in some other explanatory variable. Is it possible to derive a numeri-
cal measurement that will summarize this kind of sensitivity, and if so, how
can the manager make use of such information to improve the performance
of the firm? It is to this question that we now turn our attention.
PRICE ELASTICITY OF DEMAND
In this section we consider the sensitivity of a change in the quantity
demanded of a good or service given a change in the price of the product.
Recall from Chapter 3 the simple linear, market demand function
(4.1)
where, by the law of demand, it is assumed that b
1
< 0. One possible candi-
date for a measure of sensitivity of quantity demanded to changes in the
price of the product is, of course, the slope of the demand function, which
in this case is b
1
, where
b
Q
P
1
=
D
D
D
QbbP
D
=+
01
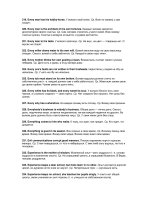
Consider, for example, the linear demand equation
(4.2)
Equation (4.2) is illustrated in Figure 4.1. The slope of this demand curve
is calculated quite easily as we move along the curve from point A to point
B. The slope of Equation (4.2) between these two points is calculated as
(4.3)
That is, for every $1 decrease (increase) in the price, the quantity
demanded increases (decreases) by 50 units.
Although the slope might appear to be an appropriate measure of the
degree of consumer responsiveness given a change in the price of the com-
modity, it suffers from at least two significant weaknesses. First, the slope
of a linear demand curve is invariant with respect to price; that is, its value
is the same regardless of whether the firm charges a high price or a low
price for its product. Since its value never changes, the slope is incapable of
providing insights into the possible repercussions of changes in the firm’s
pricing policy. Suppose, for example, that an automobile dealership is offer-
ing a $1,000 rebate on the purchase of a particular model. The dealership
has estimated a linear demand function, which suggests that the rebate will
result in a monthly increase in sales of 10 automobiles. But, a $1,000 rebate
on the purchase of a $10,000 automobile, or 10%, is a rather significant price
decline, while a $1,000 rebate on the same model priced at $100,000, or 1%,
is relatively insignificant. In the first instance, potential buyers are likely to
view the lower price as a genuine bargain. In the second instance, buyers
may view the rebate as a mere marketing ploy.
b
Q
P
PP
1
21
21
22 12
210 230
10
020
50
==
-
-
=
-
-
=
-
=-
D
D
D
.
QP
D
=-127 50
150 Additional Topics in Demand Theory
2.30
2.10
12 22
P
Q
0
B
A
C
Q
D
=127 –50P
⌬P
⌬Q
D
FIGURE 4.1 The linear demand
curve.
Suppose, on the other hand, that instead of offering a $1,000 rebate on
new automobile purchases, management offers a 10% rebate regardless of
sticker price. How will this rebate affect unit sales? What impact will this
rebate have on the dealership’s total sales revenue? By itself, the constant
value of the slope, which in this case is DQ
D
/DP = 10/-1,000 =-0.01 provides
no clue to whether it will be in management’s best interest to offer the
rebate.
The second weakness of the slope as a measure of responsiveness is that
its value is dependent on the units of measurement. Consider, again, the sit-
uation depicted in Figure 4.1, where the value of the slope is b
1
=DQ
D
/DP
= (22 - 12)/(2.10 - 2.30) = 10/-0.2 =-50. Suppose, on the other hand, that
prices had been measured in hundredths (cents) rather than in dollars. In
that case the value of the slope would have been calculated as b
1
=DQ
D
/DP
= (22 - 12)/(210 - 230) = 10/-20 =-0.50. Although we are dealing with iden-
tically the same problem, by changing the units of measurement we derive
two different numerical measures of consumer sensitivity to a price change.
To overcome the problem associated with the arbitrary selection of units
of measurement, economists use the concept of the price elasticity of
demand.
Definition:The price elasticity of demand is the percentage change in the
quantity demanded of a good or a service given a percentage change in its
price.
As we will soon see, the price elasticity of demand overcomes both
weaknesses associated with the slope as a measure of consumer respon-
siveness to a price change. Symbolically, the price elasticity of demand is
given as
(4.4)
Before discussing the advantages of using the price elasticity of demand
in preference to slope as a measure of sales responsiveness to a change in
price, we will consider how the percentage in Equation (4.4) should be cal-
culated. It is conventional to divide the change in the value of a variable by
its starting value.We might, for example, define a percentage change in price
as
There is nothing particularly sacrosanct about this approach. We could
easily have defined the percentage change in price as
%DP
PP
P
=
-
21
2
%DP
PP
P
=
-
21
1
E
Q
P
p
D
=
%
%
D
D
Price Elasticity of Demand 151
Clearly, the selection of the denominator to be used for calculating the
percentage change depends on whether we are talking about a price
increase or a price decrease. In terms of Figure 4.1, do we calculate per-
centage changes by starting at point A and moving to point B, or vice
versa? The law of demand asserts only that changes in price and quantity
demanded are inversely related; it does not specify direction. But, how we
define a percentage change will affect the calculated value of the price elas-
ticity of demand. For example, if we choose to move from point A to point
B, the value of the price elasticity of demand is
On the other hand, if we calculate the price elasticity of demand in
moving from point B to point A then
Problem 4.1. Suppose that the price elasticity of demand for a product is
-2. If the price of this product fell by 5%, by what percentage would the
quantity demanded for a product change?
Solution. The price elasticity of demand is given as
Substituting, we write
PRICE ELASTICITY OF DEMAND: THE
MIDPOINT FORMULA
It should be clear from Problem 4.1 that the choice of A or B as the start-
ing point can have a significant impact on the calculated value of E
p
.One
way of overcoming this dilemma is to use the average value of Q
D
and P
as the point of reference in calculating the averages. The resulting expres-
-=
-
=
2
5
10
%
%
D
D
Q
Q
D
D
E
Q
P
p
D
=
%
%
D
D
E
p
=
-
()
-
()
=
-
=
-
=-
12 22 22
230 210 210
10 12
020 210
0 455
0 095
479
.
.
.
E
p
=
-
()
-
()
=
-
=
-
=-
22 12 12
210 230 230
10 12
020 230
0 833
0 087
957
.
.
.
152 Additional Topics in Demand Theory
sion for the price elasticity of demand is referred to as the midpoint
formula. The derivation of the midpoint formula is
Using the data from the foregoing illustration, we find that the price
elasticity of demand as we move from point A to point B is
On the other hand, moving from point B to point A yields identically the
same result.
The price elasticity of demand is always negative by the law of demand.
When referring to the price elasticity of demand, however, it is conventional
to refer to its absolute value. The reason is largely semantic. When an econ-
omist identifies one good as relatively more or less elastic than another
good, reference is made to the absolute percentage change in the quantity
demanded of the good or service, given some absolute percentage change
in its price without reference to the nature of the relationship. Suppose, for
example, that E
p
of good X is calculated as -4, and that the value of E
p
for
good Y is calculated as -2, good X is “more elastic” than good Y because
E
PP
PP
p
=
-
-
Ê
Ë
ˆ
¯
+
+
Ê
Ë
ˆ
¯
=
-
-
Ê
Ë
ˆ
¯
+
+
Ê
Ë
ˆ
¯
=
-
Ê
Ë
ˆ
¯
Ê
Ë
ˆ
¯
=-
21
21
12
12
12 22
230 210
210 230
22 12
10
020
440
34
645
.
.
.
E
PP
PP
p
=
-
-
Ê
Ë
ˆ
¯
+
+
Ê
Ë
ˆ
¯
=
-
-
Ê
Ë
ˆ
¯
+
+
Ê
Ë
ˆ
¯
=
-
Ê
Ë
ˆ
¯
Ê
Ë
ˆ
¯
=- ¥ =-
21
21
12
12
22 12
210 230
230 210
12 22
10
020
440
34
50 0 129 6 45
.
.
E
QQ QQ
PP PP
PP
PP
PP
PP
Q
P
PP
p
=
-
()
+
()
[]
-
()
+
()
[]
=
-
+
Ê
Ë
ˆ
¯
-
+
Ê
Ë
ˆ
¯
=
-
-
Ê
Ë
ˆ
¯
+
+
Ê
Ë
ˆ
¯
=
Ê
Ë
ˆ
¯
+
+
Ê
Ë
ˆ
21 12
21 12
21
12
21
12
21
21
12
12
12
12
2
2
D
D
¯¯
=
+
+
Ê
Ë
ˆ
¯
b
PP
1
12
12
Price Elasticity of Demand: The Midpoint Formula 153
(4.5)
the consumer’s response to a change in price is greater. Numerically,
however, -4 is less than -2. To avoid this confusion arising from this in-
consistency, the price elasticity of demand is typically indicted in terms of
absolute values.
As a measure of consumer sensitivity, the price elasticity of demand over-
comes the measurement problem that is inherent in the use of the slope.
Elasticity measures are dimensionless in the sense that they are indepen-
dent of the units of measurement. When prices are measured in dollars, the
price elasticity of demand is calculated as
When measured in hundredths of dollars (cents), the price elasticity of
demand is
Except for rounding, the answers are identical.
Problem 4.2. Suppose that the price and quantity demanded for a good
are $5 and 20 units, respectively. Suppose further that the price of the
product increases to $20 and the quantity demanded falls to 5 units. Cal-
culate the price elasticity of demand.
Solution. Since we are given two price–quantity combinations, the price
elasticity of demand may be calculated using the midpoint formula.
Problem 4.3. At a price of $25, the quantity demanded of good X is 500
units. Suppose that the price elasticity of demand is -1.85. If the price of the
good increases to $26, what will be the new quantity demanded of this good?
E
PP
PP
p
=
-
-
Ê
Ë
ˆ
¯
+
+
Ê
Ë
ˆ
¯
=
-
-
Ê
Ë
ˆ
¯
+
+
Ê
Ë
ˆ
¯
=
-
Ê
Ë
ˆ
¯
Ê
Ë
ˆ
¯
=-
21
21
12
12
520
20 5
520
20 5
15
15
25
25
100.
E
PP
PP
p
=
-
-
Ê
Ë
ˆ
¯
+
+
Ê
Ë
ˆ
¯
=
-
-
Ê
Ë
ˆ
¯
+
+
Ê
Ë
ˆ
¯
=
-
Ê
Ë
ˆ
¯
Ê
Ë
ˆ
¯
=- ¥ =-
21
21
12
12
22 12
210 230
230 210
12 22
10
20
440
34
050 1294 647
E
PP
PP
p
=
-
-
Ê
Ë
ˆ
¯
+
+
Ê
Ë
ˆ
¯
=
-
-
Ê
Ë
ˆ
¯
+
+
Ê
Ë
ˆ
¯
=-
21
21
12
12
22 12
210 230
230 210
12 22
645
.
154 Additional Topics in Demand Theory
Solution. The midpoint formula for the price elasticity of demand is
Substituting and solving for Q
2
yields
PRICE ELASTICITY OF DEMAND: WEAKNESS
OF THE MIDPOINT FORMULA
In spite of its advantages over the slope as a measure of sensitivity, the
midpoint formula also suffers from a significant weakness. By taking
averages, we obscure the underlying nature of the demand function. Using
the midpoint formula to calculate the price elasticity of demand requires
knowledge of only two price–quantity combinations along an unknown
demand curve. To see this, consider Figure 4.2.
In Figure 4.2, both demand curves DD and D¢D¢ pass through points A
and B. In both cases, the price elasticity of demand calculated by means of
the midpoint formula is the same. In fact, the price elasticity of demand is
an average elasticity along the cord AB. For this reason, the value of E
p
cal-
culated by means of the midpoint formula is sometimes referred to as the
-=
-
-
Ê
Ë
ˆ
¯
+
+
Ê
Ë
ˆ
¯
=
-
Ê
Ë
ˆ
¯
+
Ê
Ë
ˆ
¯
=
-
+
= -
=
=
185
500
26 25
25 26
500
500
1
51
500
51 25 500
500
925 1 85 51 25 500
52 85 24 575
465
2
2
2
2
2
2
22
2
2
.
,
.,
.,
Q
Q
Q
Q
Q
Q
Q
Q
E
PP
PP
p
=
-
-
Ê
Ë
ˆ
¯
+
+
Ê
Ë
ˆ
¯
21
21
12
12
Price Elasticity of Demand: Weakness of the Midpoint Formula 155
0 D
DЈ
DЈ
A
B
D
Q
P
FIGURE 4.2 The midpoint formula
obscures the shape of the underlying demand
curve.
arc-price elasticity of demand. Note, however, that as point A is arbitrarily
moved closer to point B along the true demand curve D¢D¢, the approxi-
mated value of the price elasticity of demand found by using the midpoint
formula will approach its true value, which occurs when the two points con-
verge at point B. This is illustrated in Figure 4.3.
The ability to calculate the price elasticity of demand on the basis of only
two price–quantity combinations clearly is a source of strength of the mid-
point formula. On the other hand, the arbitrary selection of these two points
obscures the shape of the underlying demand function and will affect the
calculated value of the price elasticity of demand. One solution to this
problem is to calculate the price elasticity of demand at a single point. This
measure is called the point-price elasticity of demand.
Another problem with the midpoint formula is that it often obscures the
nature of the relationship between price and quantity demanded. Consider
Figure 4.4. Suppose that the price elasticity of demand is calculated between
any two points below the midpoint, such as between points C and D, on a
156 Additional Topics in Demand Theory
0 D
DЈ
DЈ
A
B
D
Q
P
A
1
A
2
A
3
FIGURE 4.3 Estimates of the arc-price
elasticity of demand are improved as the
points along the demand curve are moved
closer togther.
P
Q
Midpoint
A
0
B
C
D
FIGURE 4.4 Demand is price elastic
when it is calculated by using the midpoint
formula for points above the midpoint, and
price inelastic when it is calculated below the
midpoint.
linear demand curve. As we will see later, for all points below the midpoint,
the price elasticity of demand is less than unity in absolute value. In such
cases, demand is said to be inelastic. For all points above the midpoint, the
price elasticity of demand is greater than unity in absolute value, such as
between points A and B. In these cases, demand is said to be elastic. Finally,
at the midpoint the value of the price elasticity of demand is equal to unity.
In this unique case, demand is said to be unit elastic.
Since the use of the midpoint formula assumes that only two price–
quantity vectors are known, it is important that the two points chosen be
“close” in the sense that they do not span the midpoint. If we were to
choose, say, points B and C to calculate the price elasticity of demand, it
would be difficult to determine the nature of the relationship between
changes in the price of the commodity and the quantity demanded of that
commodity. For this and other reasons, an alternative measure of the price
elasticity of demand is preferred. It is to this issue that we now turn our
attention.
REFINEMENT OF THE PRICE ELASTICITY OF
DEMAND FORMULA: POINT-PRICE
ELASTICITY OF DEMAND
The point-price elasticity of demand overcomes the second major weak-
ness of using the slope of a linear demand equation as a measure of con-
sumer responsiveness to a price change. Unlike the slope, which is the same
for every price–quantity combination, there is a unique value for the price
elasticity of demand at each and every point along the linear demand curve.
The point-price elasticity of demand is defined as
(4.6)
where dQ
D
/dP is the slope of the demand function at a single point. It is, in
fact, the first derivative of the demand function. Diagrammatically, Equa-
tion (4.6) is illustrated in Figure 4.3 as the price elasticity of demand eval-
uated at point B, where dQ
D
/dP is the slope of the tangent along D¢D¢.
Consider again the hypothetical demand curve from Equation (4.2) and
illustrated in Figure 4.5. We can use the midpoint formula, to calculate the
values of the price elasticity of demand as we move from point A to point
B as follows:
EAB
EAB
EAB
p
p
p
()
=-
()
=-
¢
()
=-
()
=-
≤
()
=-
()
=-
50 0 129 6 45
50 0 116 5 80
50 0 099 5 12
e
p
D
D
=
Ê
Ë
ˆ
¯
Ê
Ë
ˆ
¯
dQ
dP
P
Q
Point-price Elasticity of Demond 157
Note that the value of the slope of the linear demand curve, b
1
=DQ
D
/DP,
is constant at -50. But, as we move along the demand curve from point
A to point B, the value of E
p
not only changes but will converge to some
limiting value. At a price of $2.125, for example, E
p
=-5.12. Additional cal-
culations are left to the student as an exercise.
What, then, is this limiting value? We can calculate this convergent value
by setting the difference between P
1
and P
2
, and Q
1
and Q
2
at zero:
Now, calculating the point-price elasticity of demand at point B we find
When we calculate e
p
at point A we find that
Unlike the value of the slope, the point-price elasticity of demand has
a different value at each of the infinite number of points along a linear
demand curve. In fact, for a downward-sloping, linear demand curve,
the absolute value of the point-price elasticity of demand at the “P
intercept” is • and steadily declines to zero as we move downward
along the demand curve to the “Q intercept.” This variation in the calcu-
lated price elasticity of demand is significant because it can be used to
predict changes in the firm’s total revenues resulting from changes in
the selling price of the product. In fact, assuming that the firm has the
ability to influence the market price of its product, the price elasticity of
e
p
D
D
A
dQ
dP
P
Q
()
=
Ê
Ë
ˆ
¯
Ê
Ë
ˆ
¯
=-
Ê
Ë
ˆ
¯
=-50
230
12
958
.
.
e
p
D
D
B
dQ
dP
P
Q
()
=
Ê
Ë
ˆ
¯
Ê
Ë
ˆ
¯
=-
Ê
Ë
ˆ
¯
=-50
210
22
477
.
.
E
PP
p
=-
+
+
Ê
Ë
ˆ
¯
=-
+
+
Ê
Ë
ˆ
¯
=-
Ê
Ë
ˆ
¯
=-
50
50
210 210
22 22
50
420
44
477
12
12
.
.
158 Additional Topics in Demand Theory
2.30
2.20
2.15
2.10
12 17 19.5 22
P
Q
0
A (E
p
= – 6.45)
AЈ (E
p
= – 5.80)
AЈЈ (E
p
= – 5.12)
B
FIGURE 4.5 Alternative calculations
of the arc–price elasticity from the demand
equation Q
D
= 127 - 50P.
demand may be used as a management tool to determine an “optimal” price
for its product.
Point-price elasticities may also be computed directly from the estim-
ated demand equation. Consider, again, Equation (4.2). The point-price
elasticity of demand may be calculated as
Suppose, as in the foregoing example, that P = 2.10. The point-price
elasticity of demand is
Problem 4.4. The demand equation for a product is Q
D
= 50 - 2.25P.
Calculate the point-price elasticity of demand if P = 2.
Solution
Problem 4.5. Suppose that the demand equation for a product is Q
D
= 100
- 5P. If the price elasticity of demand is -1, what are the corresponding
price and quantity demanded?
Solution
e
p
D
D
D
=
Ê
Ë
ˆ
¯
Ê
Ë
ˆ
¯
=-
-
Ê
Ë
ˆ
¯
-=
-
-
-=-
=
=
=-
()
=
dQ
dP
P
Q
P
P
P
P
PP
P
P
Q
5
100 5
1
5
100 5
5 100 5
10 100
10
100 5 10 50
e
p
D
D
=
Ê
Ë
ˆ
¯
Ê
Ë
ˆ
¯
=-
-
Ê
Ë
ˆ
¯
=
-
-
=
-
()
-
()
=
-
=-
dQ
dP
P
Q
P
P
P
P
225
50 2 25
225
50 2 25
2252
50 2 25 2
45
45 5
0 099
.
.
.
.
.
.
.
.
.
e
p
=
-
()
-
()
=-
50 2 10
127 50 2 10
477
.
.
.
e
p
D
D
=
Ê
Ë
ˆ
¯
Ê
Ë
ˆ
¯
=-
-
Ê
Ë
ˆ
¯
=
-
-
dQ
dP
P
Q
P
P
P
P
50
127 50
50
127 50
Point-price Elasticity of Demond 159
RELATIONSHIP BETWEEN ARC-PRICE AND
POINT-PRICE ELASTICITIES OF DEMAND
Consider, again, Figure 4.5. What is the relationship between the arc-
price elasticity of demand as calculated between points A and B, and the
point-price elasticity of demand? We saw that when the midpoint formula
was used, E
p
=-6.45. Intuitively, it might be thought that the arc-price elas-
ticity of demand is the simple average of the corresponding point-price elas-
ticities. If we calculate the point-price elasticity of demand at points A and
B from Equation (4.2) we find that
Taking a simple average of these two values we find
which is clearly not equal to the arc-price elasticity of demand. It can be
easily proven, however, that the calculated arc-price elasticity of demand
over any interval along a linear demand curve will be equal to the point-
price elasticity of demand calculated at the midpoint along that interval.
For example, calculating the point-price elasticity of demand at point A¢
yields
which is the same as the arc-price elasticity of demand adjusted for round-
ing errors. It is important to remember that this relationship only holds for
linear demand functions.
PRICE ELASTICITY OF DEMAND: SOME
DEFINITIONS
Now that we are able to calculate the price elasticity of demand at
any point along a demand curve, it is useful to introduce some defini-
tions. As indicated earlier, in general we will consider only absolute
values of e
p
, denoted symbolically as |e
p
|. Since e
p
may assume any
value between zero and negative infinity, then |e
p
| will lie between zero and
infinity.
e
p
D
D
A
dQ
dP
P
Q
¢
()
=
Ê
Ë
ˆ
¯
Ê
Ë
ˆ
¯
=
-
()
=
-
=-
50 2 20
17
110
17
647
.
.
ee
pp
AB
()
+
()
=
-+-
=
-
=-
2
958 477
2
14 35
2
718
.
.
e
e
p
D
D
p
D
D
A
dQ
dP
P
Q
B
dQ
dP
P
Q
()
=
Ê
Ë
ˆ
¯
Ê
Ë
ˆ
¯
=-
Ê
Ë
ˆ
¯
=
-
=-
()
=
Ê
Ë
ˆ
¯
Ê
Ë
ˆ
¯
=-
Ê
Ë
ˆ
¯
=
-
=-
50
230
12
115
12
958
50
210
22
105
22
477
.
.
.
.
160 Additional Topics in Demand Theory
ELASTIC DEMAND
Demand is said to be price elastic if |e
p
|>1 (-• < e
p
< 1), that is, |%dQ
d
|
>|%dP|. Suppose, for example, that a 2% increase in price leads to a 4%
decline in quantity demanded. By definition, |e
p
|=4/2 = 2 > 1. In this case,
the demand for the commodity is said to be price elastic.
INELASTIC DEMAND
Demand is said to be price inelastic if |e
p
|<1 (-1 <e
p
< 0), that is, |%dQ
D
|
<|%dP|. Suppose, for example, that a 2% increase in price leads to a 1%
decline in quantity demanded. By definition, |e
p
|=1/2 = 0.5 < 1. In this case,
the demand for the commodity is said to be price inelastic.
UNIT ELASTIC DEMAND
Demand is said to be unit elastic if |e
p
|=1 (e
p
=-1), that is, |%dQ
D
|=
|%dP|. Suppose, for example, that a 2% increase in price leads to a 2%
decline in quantity demanded. By definition, |e
p
|=2/2 = 1. In this case, the
demand for the commodity is said to be unit elastic.
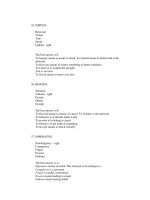
EXTREME CASES
Demand is said to be perfectly elastic when |e
p
|=•(e
p
=-•). There are
two circumstances in which this situation might, occur, assuming a linear
demand function. Consider, again, Equation (4.6).The absolute value of the
price elasticity of demand will equal infinity when dQ
D
/dP =-•, when P/Q
D
equals infinity, or both. Note that P/Q
D
will equal infinity when Q
D
= 0. Con-
sider Figure 4.6, which illustrates two hypothetical demand curves, DD and
D¢D¢. In Figure 4.6 the demand curve DD will be perfectly elastic at point
Price Elasticity of Demand: Some Definitions 161
0 Q
D
D
D
’ DЈ
A
P/Q
D
=∞
dQ
D
/dP=–∞
P
FIGURE 4.6 Perfectly elastic
demand.