Market neutral strategies phần 6 potx
Bạn đang xem bản rút gọn của tài liệu. Xem và tải ngay bản đầy đủ của tài liệu tại đây (550.96 KB, 30 trang )
Transporting Alpha 133
the ability to generate active performance that is independent of the
underlying asset class.
1
MECHANICS: TRANSPORTING ALPHA FROM A
MARKET NEUTRAL EQUITY STRATEGY
Market neutral construction eliminates exposure to the underlying mar-
ket index’s risk—and its return. This return, and its associated risk, can
be added back by purchasing derivatives, such as futures or swaps, in an
amount equal to the invested capital. In the case of a market neutral
equity portfolio, for example, the investor can purchase stock index
futures to recover exposure to an equity index. The return to the result-
ing “equitized” market neutral portfolio will basically reflect the market
return (the change in the price of the futures contracts) plus the active
return (the long-short spread) from the market neutral portfolio. The
equitized portfolio will retain the flexibility benefits of market neutral
construction, as reflected by the long-short spread, while also participat-
ing in overall market movements.
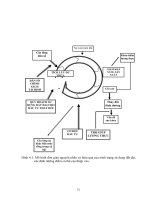
Exhibit 8.1 illustrates the deployment of capital for equitized con-
struction. This may be compared with Exhibit 3.1 in Chapter 3, which
EXHIBIT 8.1 Equitized Market Neutral Deployment of Capital (millions of dollars)
Source: Bruce I. Jacobs and Kenneth N. Levy, “The Long and Short on Long-
Short,” Journal of Investing (Spring 1997).
c08.frm Page 133 Thursday, January 13, 2005 1:23 PM
134 MARKET NEUTRAL STRATEGIES
illustrates the same for the basic market neutral equity strategy. Here,
again, we assume the investor deposits $10 million with the custodial
prime broker. Again, $9 million of the initial $10 million is used to pur-
chase desired long positions, which are held at the prime broker. This
broker also arranges to borrow $9 million in securities to be sold short.
Upon their sale, the broker provides the $9 million in proceeds to the
securities’ lenders as collateral for the shares borrowed.
2
As with the market neutral equity strategy, the investor is subject to
Federal Reserve Board Regulation T. Under “Reg T,” which covers com-
mon stock, convertible bonds, and equity mutual funds, the combined
value of long and short positions cannot exceed twice the value of the
equity in an account.
3
The investor must also retain a liquidity buffer. With
the equitized strategy, however, the investor must also purchase futures—
on the S&P 500, say—with a face value of $10 million. As the futures can
be purchased on margin, the investor’s outlay will be about 5% of the face
value purchased (or about $0.5 million in Treasury bills). This expenditure
comes out of the liquidity buffer, leaving it at a level of $0.5 million.
As with the basic market neutral strategy, the shares borrowed to
sell short must be fully collateralized. If they increase in value, the inves-
tor will have to arrange payment to the securities’ lenders so collateral
continues to match the value of the shares shorted. If the borrowed
shares fall in value, the money will flow in the opposite direction, with
the lenders releasing funds to the investor’s prime broker account. These
payments flow to and from the investor’s liquidity buffer daily.
With an equitized strategy, however, the investor also experiences
marks to market on the futures position. These will tend to offset the
marks to market on the shares borrowed. An increase in the price of the
short positions induced by a rise in the overall market, for example,
should be accompanied by an increase in the price of the futures con-
tracts held long. The marks to market on the futures can thus be used to
offset the marks to market on the shorts.
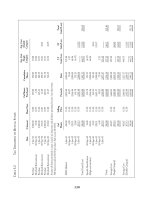
This is illustrated in Exhibit 8.2. Here, we assume that the long and
short positions, as well as the futures position, double in value. The inves-
tor will now owe the securities’ lenders $9 million on the marks to market
on the borrowed shares. But the investor’s account will also receive a $10
million positive mark to market on the futures position. The securities’
lenders can be paid out of this $10 million, with $1 million left over.
Of course, the futures position, having doubled its initial value, is
now undermargined by $0.5 million (assuming futures percentage mar-
gins remain the same). Purchasing an additional $0.5 million in Treasury
bills to meet the futures margin leaves the investor with $0.5 million.
This is added to the liquidity buffer, which is now increased in line with
the value of the invested positions.
c08.frm Page 134 Thursday, January 13, 2005 1:23 PM
135
EXHIBIT 8.2
Trading Required When Securities, Long and Short, and Futures Rise 100% (millions of dollars)
Source:
Bruce I. Jacobs and Kenneth N. Levy, “The Long and Short on Long-Short,”
Journal of Investing
(Spring 1997).
Initial Values Return Gain/Loss Owe/Owed
New Values Action After-Action Values
Long $9 +100% +$9
$18
$18
Short $9 +100% –$9 Owe lenders $9
$18
$18
Cash $0.5
$1.5
$1.0
Equity $9.5
$19.5
$19.0
Margin 52.8%
54.2%
52.8%
Futures $10 + $0.5 in
Treasury bills
+100% +$10 Owed $10 on
mark to market
$20 + $0.5 in
Treasury bills
Buy $0.5 in
Treasury bills
$20 + $1.0 in
Treasury bills
c08.frm Page 135 Thursday, January 13, 2005 1:23 PM
136 MARKET NEUTRAL STRATEGIES
The mechanics of equitized market neutral portfolio construction
thus differ from basic market neutral construction in the addition of the
futures position and the interaction between the marks to market on the
futures and on the short positions. Because of the tendency of the marks
to offset, the equitized market neutral strategy does not require as large
a liquidity buffer as the basic market neutral equity portfolio. In addi-
tion, the equitized portfolio is less likely to have to engage in trading in
order to meet marks to market on the borrowed shares.
Of course, the fundamental differences between the equitized and
the market neutral portfolios emerge in the differing responses of their
return and risk levels to movements in the underlying market. These are
discussed below.
Bull and Bear Markets
Exhibit 8.3 illustrates the performance of the equitized strategy in both
bull and bear markets. This may be compared with Exhibit 3.2 in Chap-
ter 3, which illustrates the same for the basic market neutral equity
strategy. Again, we assume that the market either rises by 30% or falls
by 15%.
First, it is evident that, unlike the market neutral portfolio, the equi-
tized market neutral portfolio does reflect market movements. It has a
return of 35.4% in the bull market (versus 10.4% for the market neu-
tral portfolio) and a return of –9.6% in the bear market (versus 10.4%
for the market neutral portfolio). The return, and risk, associated with
exposure to the broad equity market have been added back. The portfo-
lio can be expected to enjoy gains in bull markets and suffer losses in
bear markets.
Perhaps less evident, but extremely important, is that the portfolio
retains the value-added provided by market neutral construction. The
long-short spread of 5.4%, the same as in the market neutral case, adds
to the equitized portfolio’s return in the bull market and reduces the
portfolio’s loss in the bear market. This incremental return reflects the
active return to security selection, which benefits from the added flexi-
bility market neutral construction offers in the pursuit of return and
control of risk. (Of course, if the long positions in the market neutral
portfolio had, contrary to expectations, underperformed the short posi-
tions, the long-short spread would be negative, and the active return
from the market neutral portfolio would detract from the equitized
portfolio’s performance.)
This result underlines one of the major benefits of market neutral port-
folio construction and the gist of alpha transport—the transportability of
the active return from the basic market neutral portfolio. The active return
c08.frm Page 136 Thursday, January 13, 2005 1:23 PM
137
EXHIBIT 8.3
Hypothetical Performance in Bull and Bear Markets (millions of dollars)
Source:
Bruce I. Jacobs and Kenneth N. Levy, “The Long and Short on Long-Short,”
Journal of Investing
(Spring 1997).
c08.frm Page 137 Thursday, January 13, 2005 1:23 PM
138 MARKET NEUTRAL STRATEGIES
on the market neutral portfolio represents a return to security selection
alone, independent of the overall return to the equity market from which
the securities are selected. This return reflects all the benefits of market
neutral construction. The equitized market neutral portfolio transports
this return to the equity asset class, adding the security selection return
(and its associated risk) to the equity market return (and its risk).
Uses of Alpha Transport
In the above example, the equity market exposure achieved via deriva-
tives can be likened to a passive position in an equity index. Institu-
tional investors often seek passive exposures. The popularity of passive
investing reflects in part the emergence in the 1980s of theories such as
the Efficient Market Hypothesis and random asset pricing, which
implied that active investing, including attempts to identify and exploit
security undervaluation (and overvaluation), were futile. Perhaps even
more important to the growth of passive investing was the accumulating
data showing that active management generally failed to add value vis-
à-vis underlying asset benchmarks, especially after management fees and
trading costs were taken into account.
4
Passive portfolios, by contrast, demonstrated an ability to deliver on
a consistent basis performance comparable to representative asset
classes or subsets of asset classes. But passive investing is insightless; it
does not pursue alpha. Furthermore, trading costs and management
fees, although modest, subtract from passive performance. Combining a
market neutral portfolio, with an expected positive active return, and a
passive exposure that reflects the risk and return of a desired benchmark
has the potential to boost overall portfolio return without a substantial
increase in risk. Given the size of most institutional portfolios, even a 1
or 2 percentage point return from security selection in the market neu-
tral portfolio can translate into large dollar gains, especially over time.
Furthermore, the investor can choose to take a more aggressive
stance toward benchmark positions. For example, the investor can
choose to reduce (increase) derivatives positions if the underlying mar-
ket is expected to decline (rise). This would incorporate an element of
market timing (and additional risk) into the market-neutral-plus-deriva-
tives construct.
In Jacobs, Levy, and Starer, we explain how to optimize the utility
of a portfolio that combines a position in a desired benchmark with
long and short positions in benchmark securities.
5
As with the market
neutral equity portfolio, the answer lies in integration: portfolio con-
struction considers explicitly the risks and returns of the individual
securities and the benchmark holding, as well as their correlations.
c08.frm Page 138 Thursday, January 13, 2005 1:23 PM
Transporting Alpha 139
TRANSFERRING ALPHA: MAXIMIZING SECURITY SELECTION
AND ASSET ALLOCATION
Over 90% of an average pension fund’s total return variance can be
traced to its investment policy—the long-term allocation of its invest-
ments across asset classes.
6
Even within asset classes, the allocation of a
portfolio across subsets of the asset class can explain a large portion of
the portfolio’s return. For 1985–1989, for example, over 97% of the
returns to a fund known for stock selection—Fidelity Magellan Fund—
were mirrored by a passive fund invested in large-cap growth stocks
(46%), median-sized stocks (31%), small-cap stocks (19%), and Euro-
pean stocks (4%).
7
Ideally, investors should be able to maximize both security selection
and asset allocation. That is, they should be able to find skilled manag-
ers for each of the asset classes they choose to hold. In practice, how-
ever, the task of combining asset allocation with security selection often
involves a tradeoff. That is, the investor may be able to find active man-
agers who have demonstrated an ability to add value, but the universes
exploited by these managers may not encompass the asset class desired
by the investor. Given the presumed priority of the asset allocation
choice, it is often the return from security selection that is sacrificed.
Consider the case of an investor who has both large-cap and small-
cap equity managers. On the one hand, to the extent that small-cap
stocks are less efficiently priced than their large-cap counterparts, the
potential of the small-cap manager to add value relative to an underly-
ing small-cap universe may be greater than the potential of the large-cap
manager to add value relative to an underlying large-cap universe. The
investor may thus want to allocate more to the small-cap than the large-
cap manager.
On the other hand, small-cap stocks may be considered too risky in
general, or may be expected to underperform larger-cap stocks. In the
interest of optimizing overall fund return and risk, the investor may
wish to limit the allocation to the small-cap manager and allocate signif-
icantly more to the large-cap manager. In that case, however, the inves-
tor sacrifices the potential alpha from small-cap security selection in
exchange for overall asset class return and risk. The investor’s asset allo-
cation decision comes down to a choice between sacrificing security
selection return in favor of asset class performance and sacrificing asset
class performance in favor of security selection return.
With alpha transport, investors need no longer face such Solomonic
decisions. Market neutral portfolio construction techniques and deriva-
tives can be used to liberate managers, and manager performance, from
their underlying asset classes. Investors, or managers, can deploy deriva-
c08.frm Page 139 Thursday, January 13, 2005 1:23 PM
140 MARKET NEUTRAL STRATEGIES
tives to transport the skill of any manager to any asset class. Alpha
transport enables the overall fund to add value from both asset and
manager allocation.
An Equity-Based Example
The equity example in Exhibit 8.3 can be slightly modified to illustrate
more clearly the very real flexibility advantages afforded by market neu-
tral construction in conjunction with the use of derivatives to achieve
exposure to a desired asset class. Suppose this exhibit represents a mar-
ket neutral investment in small-cap stocks. The 6% long-short spread
thus represents the manager’s skill in selecting small-cap stocks. It
reflects neither the return nor the risk of small-cap stocks in general.
The manager can equitize this performance by purchasing futures
on the S&P 500, as described above.
8
The manager can thus offer the
performance of the large-cap equity index, enhanced by the value-added
provided by her ability to select small-cap stocks. As long as this ability
leads to a positive long-short spread (as it does in Exhibit 8.3), it will
increase the return available from large-cap stocks when the index rises
and reduce the loss when large-cap stocks fall.
Now consider the advantages for an investor such as the one described
at the outset of this section. This investor may be faced with having to
choose between the incremental returns expected from small-cap stocks
and the lower risk afforded by a portfolio allocation to large-cap stocks.
By choosing a market neutral small-cap portfolio equitized with large-cap
futures, this investor can have his cake and eat it too. He can retain the
allocation to large-cap stocks while reaping the returns available from
small-cap selection. The investor incurs no exposure to small-cap stocks
per se, only to the selection skills of the small-cap manager.
Alternatively, the investor can select a market neutral small-cap
manager and establish a large-cap exposure by buying S&P 500 futures
himself, or by engaging another manager to implement derivatives over-
lays. Nor is the investor limited to small- or large-cap stocks, or even to
equity, for that matter. The investor can benefit from the skills of any
market neutral manager, whatever the manager’s area of expertise, and
establish a desired exposure to virtually any asset class by using the
appropriate derivatives. The active return from a market neutral strat-
egy that exploits convertible bonds, mortgage-backed securities, merger
situations, or sovereign fixed-income instruments can be transported via
derivatives to allow the investor to maximize the benefits from both
security selection and asset allocation.
c08.frm Page 140 Thursday, January 13, 2005 1:23 PM
Transporting Alpha 141
ALPHA TRANSPORT ABSENT MARKET NEUTRAL PORTFOLIOS
It should be acknowledged that investors can take advantage of the asset
allocation freedom provided by derivatives without necessarily having to
engage in market neutral investing. To extend the example given above,
suppose an active, long-only small-cap manager has been able to add
value relative to the Russell 2000 small-cap universe, but that small-cap
stocks are expected to underperform large-cap stocks. If an investor
maintains an allocation to this small-cap manager, he will be giving up
the incremental return large-cap stocks are expected to offer relative to
small-cap stocks. But if the investor shifts funds from the small-cap to a
large-cap manager in order to capture the expected incremental asset
class return, he will be giving up the superior alpha from the small-cap
manager’s ability to select securities within the small-cap universe.
The investor, or the small-cap manager, can use derivatives to neu-
tralize the portfolio’s exposure to small-cap stocks in general and then
transport any excess return (and residual risk) from the small-cap port-
folio to the large-cap universe. The incremental returns from both secu-
rity selection and asset allocation are retained.
In order to neutralize the portfolio’s exposure to the small-cap uni-
verse, the investor or the manager can sell short futures contracts on the
Russell 2000 small-cap index, in an amount approximately equal to the
portfolio’s value. Changes in the value of the futures contracts will off-
set the changes in the value of the portfolio in response to movements in
the small-cap universe underlying the futures. The short derivatives
position thus removes the fund’s exposure to the small-cap universe.
What remains is the differential between the portfolio’s return (and risk)
and the small-cap universe return (and risk) represented by the index.
This excess return, or alpha, and its associated residual risk, reflect the
manager’s stock selection efforts.
Simultaneously, the investor or manager takes a long position in
futures contracts on the S&P 500. This long derivatives position pro-
vides exposure to the desired asset class, the large-cap equity universe.
The investor can thus benefit from any positive performance of the
large-cap asset class while retaining the small-cap manager’s perfor-
mance in excess of the small-cap universe. The combined derivatives
positions, one short and one long, effectively allow the investor to trans-
port alpha from the underlying small-cap portfolio to the large-cap asset
class, just as the alpha from the market neutral portfolio was trans-
ported via derivatives.
As an alternative to the two futures trades, the investor can look to
the over-the-counter derivatives market, contracting with a swaps dealer
to exchange small-cap equity returns for large-cap equity returns. The
c08.frm Page 141 Thursday, January 13, 2005 1:23 PM
142 MARKET NEUTRAL STRATEGIES
swap contract might specify, for example, that the investor pay quar-
terly over the term of the contract an amount equal to the return on the
Russell 2000 index times an underlying notional amount—say the value
of the underlying small-cap portfolio. The swaps dealer pays in
exchange an amount equal to the return on the S&P 500 times the value
of the portfolio.
Consider, for example, a $10 million fund fully invested in an active
small-cap portfolio. Assume the Russell 2000 returns 10% over the period,
the S&P 500 returns 13%, and the small-cap portfolio returns 12%. The
small-cap portfolio grows from $10 million to $11.2 million. The fund pays
out 10% of $10 million, or $1 million, to the swaps dealer. The fund receives
13% of $10 million, or $1.3 million, from the dealer. The fund winds up
with $11.5 million for the period. It benefits both from the superior return
on the large-cap asset class in excess of the small-cap asset class return and
from the superior return of the active small-cap manager in excess of the
small-cap asset class benchmark.
An active equity portfolio’s value-added can even be transported to
a bond universe with the use of futures or swaps. Futures contracts on
an appropriate equity index can be sold short to neutralize the portfo-
lio’s equity exposure, while bond futures are simultaneously purchased
to establish the desired bond exposure. Alternatively, the investor could
enter into a swap to pay an equity index return times a notional value
approximating the value of the underlying equity portfolio and receive
an amount equal to a bond return times the portfolio value.
Alpha transport can thus enable investors to capture incremental
returns from active security selection, whether in the form of long-only
or market neutral portfolios, while maintaining the performance avail-
able from a desired asset allocation. But alpha transport with long-only
construction cannot benefit from the potentially considerable return-
enhancing and risk-reducing advantages of market neutral portfolio
construction. While alpha transport affords flexibility in pursuit of return
and control of risk at the overall fund level, market neutral portfolio con-
struction affords flexibility in pursuit of return and control of risk at the
individual portfolio level. By improving the manager’s ability to imple-
ment insights, market neutral construction can lead to better performance
vis-à-vis long-only construction based on the same set of insights.
COSTS AND BENEFITS
An investor considering alpha transport should recognize some of the
problems that can arise. An alpha transport strategy that involves a
c08.frm Page 142 Thursday, January 13, 2005 1:23 PM
Transporting Alpha 143
market neutral portfolio, for example, may be subject to the shorting-
related and leverage-related incremental risks and costs described in
Chapter 3. In addition, alpha transport strategies involving either mar-
ket neutral or long-only portfolios may incur incremental risks or costs
related to unexpected mismatches between the derivatives used for
transport and the asset class exposure desired.
For example, alpha transport may be limited by the unavailability
or illiquidity of derivatives instruments. In particular, futures contracts
are not traded on all asset class benchmarks that may be of interest to
investors, and even when available the contracts may not have enough
liquidity to support institutional-size needs. While futures contracts on
the S&P 500 and U.S. Treasury bond futures enjoy excellent liquidity,
liquidity may drop off considerably for contracts on other indexes.
When investors face insurmountable interference in transporting via
futures, however, they can turn to the OTC swaps market. Swaps can be
customized to meet most investor needs.
Furthermore, although the price of a futures contract will converge
to the price of the underlying instrument at expiration, futures-based
strategies may not always provide the exact performance of the underly-
ing index, for several reasons. First, although futures are theoretically
priced to reflect the current value of the underlying spot index adjusted
for the forward interest rate over the time to contract expiration and the
value of dividends or interest on the underlying index, actual futures
prices can diverge from theoretical fair prices. The most liquid futures
contracts usually track their underlying indexes closely, but less liquid
contracts tend to experience greater tracking error. This type of basis
risk can add to or subtract from derivatives performance relative to the
underlying index.
Futures performance may also differ from underlying index perfor-
mance because of frictions introduced by margin costs and by the need
to roll over more liquid short-term futures contracts. Because the pur-
chase or short sale of futures contracts involves a deposit of initial mar-
gin (generally about 5% of the value of the underlying stocks) plus daily
marks to market, a small portion of investment funds will have to be
retained in cash. This will earn interest at the short-term rate, but will
represent a drag on performance when the rate earned is below the
interest rate implicit in the futures contract. In addition, the short rebate
received on the proceeds of the short sales will generally be less than the
rate implicit in futures contracts. Overall, the interest rate shortfall may
amount to as much as 1% annually.
9
Swaps reduce some of the risks of missing the target index. Swaps
generally require no initial margin or deposit (although one may be
required by the terms of a specific swap contract) and the term of the
c08.frm Page 143 Thursday, January 13, 2005 1:23 PM
144 MARKET NEUTRAL STRATEGIES
swap contract can be specified to match the investor’s horizon. Further-
more, swap counterparties are obligated to exchange payments based on
the terms in the contract; payments are not subject to fluctuations about
the value of the underlying benchmark, as is the case with futures.
Swaps do entail price risk. A swaps dealer will generally extract a
charge in the form of a spread. For example, an investor who wants to
exchange the Russell 2000 return for the S&P 500 return may be
required to pay the Russell 2000 plus some basis points. In general, the
price of a swap will depend upon the ease with which the swap dealer
can hedge it. If a swap dealer knows it can lay off a swap immediately
with a counterparty demanding the other side, it will charge less than if
it knows it will have to incur the risks associated with hedging its expo-
sure. Swap prices may vary depending upon a specific dealer’s knowl-
edge of potential counterparties, as well as its ability to exploit tax
advantages and access to particular markets.
Swaps also entail credit risk. Swaps are not backed, as are futures
contracts, by exchange clearinghouses. The absence of initial margin
deposit and daily marking to market further increases credit risk.
Although credit risk will generally be minimal for the investor or man-
ager swapping with a large investment bank (or the well-capitalized
subsidiary of such a bank), the credit quality of counterparties must be
closely monitored to minimize exposure to potential default.
10
Default
may prove costly, and as swaps are essentially illiquid, it may be difficult
or impossible to find a replacement for a defaulting counterparty.
The potential benefits of alpha transport, in terms of flexibility and
value-added, are nevertheless substantial for both investors and manag-
ers. The decision to maximize alpha need no longer be subservient to
the investor’s asset allocation decision. The investor can pursue the best
opportunities in both asset allocation and security selection.
Alpha transport may also liberate portfolio managers. This will cer-
tainly be the case if managers have neglected their own areas of exper-
tise in order to pursue returns from those types of securities favored by
clients. Alpha transport frees managers to focus on the universes within
which they feel they have the greatest skill, hence the greatest potential
to add value. This freedom should ultimately translate into enhanced
performance for their clients.
Finally, managers and investors unfamiliar with market neutral
investing and unaccustomed to derivatives may view the whole idea as
just too complicated. In fact, however, alpha transport affords investors
increased ease and flexibility in structuring an overall fund. By decou-
pling the security selection decision from the asset allocation decision, it
allows these key elements of portfolio performance to be recombined to
suit any investor needs.
c08.frm Page 144 Thursday, January 13, 2005 1:23 PM
Transporting Alpha 145
NOTES
1
Alpha transport is becoming increasingly popular among investors and managers.
See Bruce I. Jacobs and Kenneth N. Levy, “Alpha Transport with Derivatives,” Jour-
nal of Portfolio Management, May 1999; and James Rutter, “How to Make Volatil-
ity Pay—The Next Step Forward Could Be Portable Alpha,” Global Investor, June
2003.
2
In practice, lenders of stock will usually demand that initial collateral equal some-
thing over 100% of the value of the securities lent (even up to 105%).
3
Reg T does not cover U.S. Treasury or municipal bonds or bond funds. Further-
more, Reg T can be circumvented by various means. Hedge funds, for example, often
set up offshore accounts, which are not subject to Reg T. Broker-dealers are subject
to much less stringent requirements than Reg T, and hedge funds and other investors
may organize as their own broker-dealer or arrange to trade as the proprietary ac-
count of a broker-dealer in order to attain much more leverage than Reg T would al-
low. See Bruce I. Jacobs, Kenneth N. Levy, and Harry M. Markowitz, “Portfolio
Optimization with Factors, Scenarios and Realistic Short Positions,” forthcoming,
Operations Research.
4
See Bruce I. Jacobs and Kenneth N. Levy, Equity Management: Quantitative Anal-
ysis for Stock Selection (New York: McGraw-Hill, 2000).
5
Bruce I. Jacobs, Kenneth N. Levy, and David Starer, “Long-Short Portfolio Man-
agement: An Integrated Approach,” Journal of Portfolio Management, Summer
1999.
6
Gary P. Brinson, Brian D. Singer, and Gilbert L. Beebower, “Determinants of Port-
folio Performance II: An Update,” Financial Analysts Journal, May/June 1991.
7
William F. Sharpe, “Asset Allocation: Management Style and Performance Mea-
surement,” Journal of Portfolio Management, Winter 1992.
8
One might think Exchange Traded Funds (ETFs) would provide an alternative to
futures, as they also offer exposure to various market index benchmarks. However,
they are subject to Reg T margin requirements, hence establishing a given position in
ETFs requires substantially more funds (some 10 times more) than establishing a
comparable position in futures.
9
The investor may have some room for negotiation in the investment of the short sale
proceeds. Typically, overnight rates are pegged to Fed funds, LIBOR, or broker call,
but the funds may be committed for longer terms at higher rates. Investment for long-
er terms will subject the proceeds to interest rate risk if the performance benchmark
is linked to a floating rate, but it may reduce risk for an equitized market neutral port-
folio (for instance, if the maturity of the investment matches that of the stock index
futures contracts used as an overlay on the portfolio).
10
And, as recent examples such as Enron and WorldCom show, relying on credit rat-
ing agencies is not necessarily sufficient.
c08.frm Page 145 Thursday, January 13, 2005 1:23 PM
c08.frm Page 146 Thursday, January 13, 2005 1:23 PM
CHAPTER
9
147
A Tale of Two Hedge Funds
Bruce I. Jacobs, Ph.D.
Principal
Jacobs Levy Equity Management
Kenneth N. Levy, CFA
Principal
Jacobs Levy Equity Management
wo spectacular blowups in the 1990s marred the reputation of market
neutral investing. The failure of Askin Capital Management in 1994
and the collapse of Long-Term Capital Management in 1998 cost their
investors hundreds of millions of dollars, roiled the financial markets,
and led many to question the legitimacy of market neutral strategies. We
discuss each case below—what happened, the extent to which blame can
be laid at the feet of market neutral investing as a strategy, and the les-
sons to be learned.
ASKIN CAPITAL MANAGEMENT
In April 1994, Askin Capital Management (ACM) filed for bankruptcy.
David Askin had assumed control of two hedge funds, Granite Partners
(a limited partnership) and Granite Corporation (a Cayman Islands cor-
poration), in January 1993. He had managed the funds for their previ-
ous owner since September 1991. Prior to that, Askin had worked in
fixed income at Drexel Burnham Lambert and Daiwa Securities, where
T
c09.frm Page 147 Thursday, January 13, 2005 12:14 PM
148 MARKET NEUTRAL STRATEGIES
he had established a reputation for quantitative management and for
evaluating mortgage prepayments.
According to the report of the trustee assigned to oversee the ACM
bankruptcy, ACM was perhaps the only firm that used a leveraged mar-
ket neutral strategy based on investments in collateralized mortgage obli-
gations (CMOs). The objective of the Granite funds, as stated in the
marketing materials, was to achieve interest and capital appreciation
equal to 15% per year, “regardless of whether the bond market moves
up, down or stays the same.”
1
Also, according to marketing materials,
the Granite portfolios were hedged against broad bond market move-
ments by “taking long positions in both undervalued bullish securities
and long positions in undervalued bearish securities.” In other words,
the funds were meant to be market neutral, with market neutrality
achieved via long-long, rather than long-short, portfolio construction.
A market neutral strategy based solely or primarily on long positions
is conceivable in the context of mortgage-backed securities because of
the variety of instruments available and the range of their responses to
interest rate movements. When interest rates decline, for example,
returns to principal-only securities (POs) may be expected to rise. This is
because POs entitle their holders to the principal portion of mortgages,
and when interest rates decline, homeowners tend to refinance, allowing
PO holders to receive principal payments sooner than expected. In the
same environment, however, the value of interest-only securities (IOs)
may decline, as prepayments truncate the cash flows to IOs. Whether a
long-long strategy is feasible in practice, however, is another question.
ACM’s market neutral portfolios relied almost exclusively on CMO
securities, many of which were purchased via repo (repurchase) agree-
ments. That is, ACM purchased the securities and then “sold” them
back to the broker-dealers it had bought them from on the understand-
ing that it would repurchase the securities at a later date. In effect, the
proceeds from the resale to the broker-dealers served as a loan to ACM,
for which ACM paid with interest of 3% to 4% and a 5% to 25% hair-
cut (depending on the riskiness of the security being repoed). The securi-
ties “bought” by the broker-dealers served as collateral for the loans.
ACM targeted and maintained modest leverage levels, with total debt
equaling between 1.0 and 3.5 times equity.
The instruments purchased by ACM were largely esoteric ones, with
names like “super PO,” “Z bond,” “inverse floating rate IO,” and “two-
tier PAC IO.” Many of the media reports following the ACM bankruptcy
described the firm’s holdings as “toxic waste”—a term the Street applies
to what’s left over after the dealers finish slicing and dicing. That is, deal-
ers purchase pools of mortgages from the federal mortgage agencies and
create from them securities with yield and risk attributes attractive to
c09.frm Page 148 Thursday, January 13, 2005 12:14 PM
A Tale of Two Hedge Funds 149
potential institutional and retail investors. The sale of these securities,
however, is often dependent upon the ability of the dealers to get rid of
the less attractive attributes of the mortgages; dealers accomplish this by
packaging the less attractive attributes, such as complexity and high risk,
into instruments they can sell to investors such as ACM.
In fact, so important are customers such as ACM to the profitability
of dealers’ mortgage bond businesses that the dealers often make special
accommodations for them. Kidder Peabody, for example, had set up a
Special Account Facility Pool to accommodate the financing needs of
corporate customers that did not have high enough credit ratings to
obtain financing from the firm’s regular credit department. ACM was
the pool’s biggest client.
Dealers also make “toxic waste” products palatable by structuring
them to offer a high expected yield. Whether purchasers will benefit
from these high expected yields, however, is heavily dependent on their
ability to assess the securities’ real risk-adjusted value. Because the
instruments are so complex and are generally very thinly traded, they
are very difficult to value. They may have option-like payoffs, for exam-
ple, offering big profits in some interest rate/prepayment rate environ-
ments, but large losses in slightly different environments.
ACM claimed to have proprietary analytical models, including a
model that assessed the probability and effects of prepayments, to eval-
uate the attractiveness and relative riskiness of the instruments. It also
claimed that it used advanced hedging techniques to construct portfo-
lios. In reality, ACM’s pricing of portfolio assets was heavily dependent
on value estimates (or “marks”) solicited from broker-dealers. Further-
more, when Askin did not agree with a particular dealer’s mark, he had
the options of (1) discussing it with the dealer in hopes of getting a bet-
ter mark; (2) soliciting a mark from another dealer, then averaging the
two marks; or (3) using his own assessment of value (a “manager
mark”). Resort to the last option was rare—before March 1994.
Marking Time
In fiscal 1992, the first full year under Askin management, the Granite
funds had generated a gross return of 17% to 18% on equity of about
$200 million. For 1993, the first year under Askin’s ownership, the funds
achieved a combined return of about 20%. Following these successes,
Askin established a new fund, Quartz Hedge Fund, which was designed
to provide a target return of 25% from a strategy of exploiting interest
rate changes; that is, this fund, rather than being market neutral like the
Granite funds, was designed to be market directional. By February 1994,
ACM managed funds with a value of about $450 million (about $60 mil-
c09.frm Page 149 Thursday, January 13, 2005 12:14 PM
150 MARKET NEUTRAL STRATEGIES
lion of which represented investments in Quartz) and managed as well
five segregated accounts with assets of $10 million to $25 million each.
The interest rate environment had so far remained benign, with rates
stable or declining. But in February 1994, the Fed instituted the first in a
series of six rate hikes for the year. For ACM, the results were cata-
strophic. In February alone, ACM’s portfolios’ net asset value declined by
about 20%, according to broker–dealer marks. Askin, however, decided
to use his own manager marks to value the portfolios. As a result, the
firm’s report to investors, released in early March, showed a decline of
1% to 2% for the month. The portfolios’ values continued to deteriorate,
however, especially after another quarter-point hike by the Fed hit bond
markets on March 22. On March 25, Askin faxed to investors revised
February figures showing a 20% drop for the month. The fax invited
investors to meet at ACM offices the following Monday, March 28.
ACM’s investors were shocked. So, surprisingly, were the firm’s bro-
ker–dealer counterparties. They had apparently experienced their own
problems assessing the value of the collateral placed with them by
ACM, and had badly underestimated their exposures to the firm. The
trustee’s report finds that many of the broker–dealers had failed to eval-
uate their positions with ACM on a timely enough basis to ensure ade-
quate collateral in the rapidly changing environment of early 1994.
Some had tightened margin requirements at regularly scheduled repo
rollovers in February and early March, but only a few, including Bear
Stearns and Donaldson, Lufkin & Jenrette (DLJ), had issued any signifi-
cant interim margin calls. Most had failed to keep track of exposures
due to forward sales of CMOs to ACM. As a result, when ACM’s trou-
bles became public in late March 1994, brokers engulfed the firm with a
tidal wave of collateral demands.
Margin calls of over $30 million and $50 million from Bear Stearns
and Kidder Peabody, respectively, hit ACM on Monday, March 28.
ACM had difficulty meeting these calls. Its cash reserve (which had been
maintained at about 5% of assets) was inadequate. Nor could it readily
liquidate assets. Most of its assets were already held by broker–dealers
as collateral on repo agreements. In any event, ACM would have found
it extremely difficult to locate buyers for these illiquid, complex securi-
ties, given the generally poor condition of the bond market.
Askin, meeting with investors on Monday, March 28, urged them to
kick in capital to keep the funds going. He met with little success. The
investors, in fact, were already looking for a third party able to evaluate
the Askin portfolios and willing to buy them out. By the end of the day,
ACM had scrounged up about $10 million in cash and $18 million in
collateral for Bear Stearns. No funds were sent to Kidder Peabody.
ACM questioned the propriety of Kidder’s margin call, as it was based
c09.frm Page 150 Thursday, January 13, 2005 12:14 PM
A Tale of Two Hedge Funds 151
totally on forward contracts that were not scheduled to settle until the
end of the month.
On Tuesday, March 29, Kidder descended on ACM’s offices to go
over the books. Kidder officials apparently broached with Askin the
possibility of a Kidder buy-out, but backed out when they realized Kid-
der would not be able to obtain the bonds held on repo with other bro-
kers. Bear Stearns was demanding an additional $10 million, and
threatening to liquidate its collateral the next morning, even as Askin
was trying to convince Bear Stearns to buy the portfolios, or at least its
interests in them.
Early on Wednesday, March 30, ACM was hit by margin calls from
Merrill Lynch, DLJ, Kidder, Greenwich Capital, and Morgan Stanley.
Trust Company of the West (TCW), which had been brought in by
ACM investors to discuss the possibility of assuming the funds’ manage-
ment, was having difficulty evaluating either the full amount it would
take to bail out the funds or the potential remaining asset value. Mean-
while, Bear Stearns proposed buying out its portions of the Granite
portfolios, making clear that it would start liquidating if refused. The
offer, extended at some time between 3:30 and 3:45 that afternoon, was
rejected by 4:30; Bear Stearns started liquidating ACM assets at 5:00.
2
This opened the floodgates. ACM filed for bankruptcy on April 4, and
its investors lost an estimated $600 million.
A Question of Neutrality
Did the failure of ACM represent the failure of a market neutral strat-
egy? Strictly speaking, no. The trustee’s report finds that “the Granite
Fund portfolios were not managed in a manner consistent with the
stated investment policy of ‘market neutrality’” and that “the quantita-
tive tools utilized by ACM to test market neutrality were inadequate for
that task.”
3
While ACM’s marketing material had claimed that “proprietary”
tools were used to evaluate securities and manage the portfolios, ACM
had actually relied on commercial programs, information from broker-
dealers, and a hefty dose of human judgment.
4
To value securities, for
example, ACM used online data services such as Bloomberg Financial
Services. In late January 1994, it added software that could have pro-
duced effective duration and option-adjusted spread (OAS) analyses, but
ACM apparently did not exploit these features. ACM did use a propri-
etary model developed by an outside consultant to project and aggregate
individual security cash flows; this model could not compute effective
duration or perform OAS analyses, yet was the firm’s primary tool for
computing portfolio neutrality.
c09.frm Page 151 Thursday, January 13, 2005 12:14 PM
152 MARKET NEUTRAL STRATEGIES
The trustee’s investigation could find no evidence of a proprietary
prepayment model, nor could any of Askin’s employees verify the exist-
ence of such a model.
5
Also lacking was any form of quantitative stress
testing. Rather, stress testing seems to have consisted of Askin’s subjec-
tive evaluation of how securities would perform, given prepayment or
interest rates within the range of the assumptions underlying broker–
dealer price quotes.
It is thus hardly surprising that the funds’ managers had but a tenu-
ous grip (if that) on portfolio neutrality. In the fall of 1993, for example,
ACM purchased inverse IOs. According to Richard John, a portfolio
manager at ACM, Askin considered these securities to be fundamentally
bearish because they were interest-only instruments. John himself believed
that the bonds were at least partly bullish, because of the potential effect
of an increase in short-term rates on the bonds’ coupons.
6
However, with
the purchase of these bonds and the sale of bullish POs out of the portfo-
lios, Askin (again, according to John) thought that the portfolios were
becoming too bearish and increased purchases of POs and inverse float-
ers.
7
As of the end of 1993, over 80% of the Granite funds was invested
in these obviously bullish securities or equally bullish inverse IOs.
8
Going into 1994, according to minutes of the investment committee
and Askin’s discussions with employees and broker-dealers, Askin was
looking to purchase more bearish securities. By this time, however, the
market was already reflecting the expectation of rising interest rates.
ACM found it difficult either to sell off its bullish securities or to buy
more bearish securities at reasonable prices. Nevertheless, the funds
continued to purchase more inverse IOs. Askin apparently continued to
believe these securities were bearish (and some were represented as such
by the selling brokers). The funds also, however, purchased new inverse
floaters and Super POs, which were clearly bullish.
Both Askin and John apparently believed that the Granite funds had
a duration of about one (with zero duration being truly market neutral)
in mid-February.
9
This is hardly likely, however, because over 90% of
the portfolios was invested in bullish securities by the end of February.
The expert hired by the bankruptcy trustee found that the portfolios’
effective durations were in excess of 10 (in fact, close to 15 for the
Granite Corporation and close to 11 for Granite Partners) at that time,
and were at about the same levels when ACM declared bankruptcy.
10
At
these levels, ACM’s supposedly market neutral portfolios had effective
durations of about three times the magnitude of the U.S. Treasury mar-
ket. The trustee’s report concludes:
Whether knowingly, recklessly or negligently on ACM’s
part, the Granite Fund portfolios were badly out of “tilt,”
c09.frm Page 152 Thursday, January 13, 2005 12:14 PM
A Tale of Two Hedge Funds 153
and were, in fact, market directional, not market neutral,
at the time of their collapse. The lack of neutrality, more-
over, was a direct and proximate cause of that collapse.
11
What Didn’t Go Wrong?
ACM appears to have been adequately diversified in terms of its rela-
tionships with broker-dealers. Beyond this, it appears that everything
ACM management could have done wrong, it did wrong, and every-
thing that could have gone wrong, went wrong.
Transparency. Prices for most of the securities in which ACM
invested were not readily available from an objective source, such as a
public auction. Instead, ACM and its counterparties were forced to rely
on their own valuation models, which, in the case of ACM at least,
proved inadequate, for reasons discussed below. This opened the door
to a host of problems, Askin’s misleading February financial statement
being only the most blatant.
Complexity. The instruments ACM invested in were difficult to
value, with the potential to exhibit nonlinear reactions to changes in
interest rates and prepayment levels. This made it difficult for ACM to
determine securities’ possible reactions to interest rate changes, hence to
construct market neutral portfolios. In addition, ACM’s repo and for-
ward counterparties experienced their own problems evaluating these
securities on a timely basis. As a result, losses at ACM in early 1994
accumulated to a degree that jeopardized the firm’s ability to meet the
flood of margin calls that came in late March.
An argument might also be made that complexity and lack of trans-
parency contributed to Bear Stearns’ March 29 margin call, later found
by the bankruptcy trustee to have been improper, which precipitated the
liquidation process. With greater transparency (or less complexity), it is
also possible that Kidder Peabody, TCW, or another “white knight”
might have succeeded in putting together a deal that would have
avoided liquidation.
Investment models and processes. ACM obviously lacked the tools
needed to value its complex instruments properly. At several points, in
fact, Askin and his coportfolio manager, John, appear to have been in
fundamental disagreement over such basic issues as whether a given secu-
rity’s value would rise or fall with a rate increase. ACM illustrates the
shortcomings of an investment approach that relies primarily on judg-
ment calls when the instruments employed demand quantitative tools.
Given the inadequacies of ACM’s valuation process, it is hardly sur-
prising that its portfolios ended up poorly diversified and far from mar-
ket neutral. But the failure to achieve market neutrality may reflect,
c09.frm Page 153 Thursday, January 13, 2005 12:14 PM
154 MARKET NEUTRAL STRATEGIES
beyond valuation problems, a fundamental flaw in ACM’s strategy itself.
ACM stated that the Granite funds were designed to attain neutrality
through a long-long portfolio structure—an objective that, as we have
noted, is theoretically attainable because of the nature of CMOs. The
expert hired by the trustee to evaluate the firm’s portfolios, however,
calls into question the validity of long-long as a market neutral
approach: “Although Askin’s ‘long-long’ strategy could be effective over
a very narrow band of interest rate movements, … such a strategy could
not hold up over larger movements in interest rates.”
12
Thus ACM’s mar-
ket neutral funds may have been doomed to failure, even if its valuation
process had been able to pass muster.
Liquidity. ACM faced liquidity problems on several levels. In early
1994, ACM ran up against market illiquidity. With expectations of
higher interest rates pressuring the prices of the narrowly traded instru-
ments ACM specialized in, the firm found it difficult to maintain even
its idea of market neutrality; it had difficulty both selling off the bullish
securities in its portfolios and purchasing desired bearish securities. At
the end of March, the illiquidity of the firm’s positions, combined with
its leverage, proved fatal. The firm could not liquidate portfolio assets
that were already being held by the dealers demanding additional collat-
eral. Furthermore, given the small market for the firm’s securities, and
the lack of transparent pricing, ACM found itself at the mercy of these
dealers, not only as lenders, but also as the ultimate arbiters of the value
of the firm’s assets.
Leverage. The ACM story demonstrates that even relatively modest
levels of leverage can spell disaster when the borrower cannot come up
with payments demanded by lenders. ACM’s failure to rise to the occa-
sion can be blamed on several factors—the firm’s inadequate cash reserve,
the innate illiquidity of its assets, and the structure of its financing deals
(which placed its assets in the hands of lenders). Ultimately, however, it
reflects the failure of the firm to value and manage its assets properly.
LONG-TERM CAPITAL MANAGEMENT
The same year that saw the death of ACM saw the birth of a new star in
the market neutral hedge fund firmament. Long-Term Capital Manage-
ment (LTCM) was headed by John W. Meriwether, who had gained fame
and fortune by creating Salomon Brothers’ bond arbitrage operation in
the 1980s. Several of his former employees at Salomon had jumped ship
to join LTCM. Meriwether also brought on board a former vice chair-
man of the Federal Reserve Board, as well as Robert C. Merton and
c09.frm Page 154 Thursday, January 13, 2005 12:14 PM
A Tale of Two Hedge Funds 155
Myron S. Scholes, who were soon to win the Nobel Prize for their work
on valuing options. Their option pricing theories, based on arbitrage
relationships between options and their underlying stocks or bonds, had
spawned the whole new world in which ACM and LTCM operated.
By mid-1994, Meriwether had raised over a billion dollars in equity,
on top of the $100 to $150 million anted up by the firm’s general part-
ners. LTCM’s investors—institutions and a small number of wealthy
individuals—were required to keep funds invested for a three-year lock-
up period and to pay an annual management fee of 2% in return for
75% of the firm’s investment profits.
LTCM ran a host of market neutral strategies from its headquarters
in Greenwich, Connecticut and offices in London and Tokyo. Its core
strategies were designed to exploit various perceived inefficiencies in
interest rate and equity markets. The firm specialized in “convergence
trades,” holding offsetting positions that were scheduled to converge in
price at a given future date, and “relative value arbitrage,” where con-
vergence was expected but not certain.
13
LTCM looked for opportunities created by regulatory or structural
frictions that caused prices to diverge from historical norms or per-
ceived values. Japanese banks, for example, were required to receive
fixed and pay floating in yen-denominated swaps. LTCM held long posi-
tions in Japanese government bonds and bond futures and hedged with
yen-denominated swaps in which it paid fixed and received floating.
In Italy, high levels of government debt made for high fixed rates on
government bonds in the mid-1990s. Yet floating rates on Italian swaps
were declining in anticipation of the convergence of European curren-
cies at the initiation of the Euro. LTCM purchased Italian bonds on
repo, receiving the fixed coupons from their repo counterparties and
paying floating; simultaneously, it entered into lira interest rate swaps,
paying the fixed swap rates and receiving floating.
In the United Kingdom, lack of demand for government bonds
caused short-term rates to rise, which in turn led U.K. mortgage lenders
to pay fixed on interest rate swaps. LTCM borrowed 10-year U.K. gov-
ernment bonds using reverse repos, and entered into 10-year interest
rate swaps to pay floating and receive fixed; at the same time, it pur-
chased 10-year German government bonds on repo and entered into 10-
year interest rate swaps to pay fixed and receive floating.
In the equity arena, European retail investors had been snapping up
products that offered a guaranteed minimum return plus the opportu-
nity to participate in equity market appreciation. Issuers of these prod-
ucts often used options on equity indexes in order to supply the upside.
Their demand for such options helped to raise option-implied volatility
to historically high levels through the mid-1990s.
c09.frm Page 155 Thursday, January 13, 2005 12:14 PM
156 MARKET NEUTRAL STRATEGIES
In addition, in mid-1997, troubles in Asian economies prompted a
worldwide increase in equity market volatility. This was reflected in the
United States by the stock market minicrash of October 27, 1997.
Implied volatilities shot up in the United States and Europe. LTCM
attempted to exploit what it perceived as a temporary mispricing
through a number of complex trades. For instance, it bought short-
dated, at-the-money forward straddles on the French CAC and shorted
long-dated, at-the-money forward straddles, hedging the interest rate
risk with futures and the market risk with index futures.
LTCM also became a substantial player in merger arbitrage. By
1997, it had about $5 billion in long (and corresponding short) positions
in securities involved in merger situations. Other strategies pursued by
LTCM included convertible arbitrage, including long positions in what
LTCM deemed to be underpriced Japanese convertibles, hedged with
interest rate swaps, shorted equities, and options; equity long-short pairs
trades; and yield curve relative value trades in the United Kingdom,
France, Germany, and Japan.
As befits a firm that employed two Nobel laureates in economics,
LTCM relied heavily on analytical models. Its complicated “risk aggrega-
tor,” for example, analyzed all the firm’s positions on a global basis, taking
into account position variances, covariances between positions, and esti-
mated potential losses from extreme events. Nevertheless, the firm’s over-
all investment approach, its partners maintained, was not reliant on any
“black box,” but based on sound market and economic fundamentals.
14
LTCM’s portfolio was structured to be market neutral with respect
to interest rates, stock market risk, and currency risk; the overall fund
was said to have “triple net zero” exposure.
15
With these major sources
of risk supposedly neutralized, the risk level of LTCM’s portfolio was
deemed to be very low. LTCM had informed its investors early on (in
October 1994) that the probability of a loss of 20% or more of portfo-
lio value was only one in 100.
Of course, expected return was also low, on a per trade basis.
LTCM aimed to provide high returns, while maintaining a very low risk
profile, by leveraging its low-risk positions to the point that overall
return volatility approximated the level of an unleveraged position in
the U.S. equity market. Banks and dealers were eager to comply.
Impressed with the reputations of the firm’s partners, and later by the
firm’s stunning profits, lenders were willing to provide financing at
extremely favorable terms, including below-market interest rates and no
haircuts on repo arrangements.
Through much of the firm’s history, leverage averaged about 25-to-1
(not including derivatives positions). With this amount of borrowing on
top of its capital base, the firm was able to take massive positions. In
c09.frm Page 156 Thursday, January 13, 2005 12:14 PM
A Tale of Two Hedge Funds 157
fact, in terms of both the amount of leverage employed and its position
sizes, LTCM operated more along the lines of a Wall Street trading desk
than a mere hedge fund.
LTCM apparently believed that leverage would not become a problem.
Its leveraged positions were fully collateralized and subject to two-way
marking to market. In addition, the firm undertook value-at-risk (VAR)
analyses, stress tests, and scenario analyses to ensure capital adequacy.
LTCM undoubtedly believed that safety was ultimately provided by
the wide diversification of its investments. Not only did LTCM invest
around the globe, in bond markets and equity markets, it had also
diversified across investment horizons, from short to long term, and
across investment strategies. In September 1997, for example, LTCM
was employing about 100 strategies and had 7,600 positions and 6,700
separate contractual arrangements with 55 counterparties.
The Force is With Them
When LTCM launched in 1994, it was entering a bond market in tur-
moil. The Fed had raised rates a quarter point in early February and
another quarter point in late March. Between January 28 and April 14,
30-year U.S. government bonds fell 14%. Elsewhere, political instability
was roiling Mexico, the yen was surging against the dollar, and bond
prices were falling across Europe.
These developments not only doomed ACM, but were plaguing bond
investors in general, including Goldman Sachs, Fidelity Investments,
Bankers Trust, the Soros Fund, and the hedge funds of Julian Robertson
and Michael Steinhardt. Many of these investors were unloading their
more liquid positions in order to raise the capital to meet margin calls.
For LTCM, of course, liquidity was not a problem. Flush with their $1
billion plus in new investments, they were like kids in a candy shop,
eager and able to pick up the bargains, including off-the-run Treasuries
and interest-rate-only CMOs. LTCM ended up the year with a return of
28%, even as the average bond investor lost money.
LTCM’s return in 1995 was a stunning 59% (before fees). The firm
had by now more than doubled its initial investment. On the strength of
this stellar performance, LTCM raised an additional $1 billion in capital.
But despite the increased capital, the firm’s leverage was also rising. By
the spring of 1996, the firm was leveraged at about 30-to-1, with assets of
$140 billion. It ended the year with a return of 57%.
In 1997, however, returns began to level off. The firm’s leverage also
dropped, at one point to below 20-to-1. The return for the year, at only
25%, was above the rate achieved by the broad equity market, but less
than half of what LTCM had garnered in each of its previous two years.
c09.frm Page 157 Thursday, January 13, 2005 12:14 PM