tóm tắt luận án tiến sĩ tiếng anh nghiên cứu ảnh hưởng của tưới nông lộ phơi đến việc giảm mức tưới, giảm lượng nước tiêu cho lúa khu vực hà nam
Bạn đang xem bản rút gọn của tài liệu. Xem và tải ngay bản đầy đủ của tài liệu tại đây (471.49 KB, 26 trang )
Introduction
1. URGENCY OF THEMES
Water is reducing on the volume as well as the quality in most area
in the world. For agricultural water, the volume of water is reduced due
to critical competition of the other economic which using water.
Irrigational water-saving to raise the index of agricultural products
per unit of irrigational water which became extremely important.
Therefore, “research reveal the influence of irrigated-agriculture to
reduce volume of water, reduce consumption volume of water for rice
in Ha Nam area” is very urgent now.
2. OBJECTIVES OF THEMES
- Research on impact of irrigated agriculture to Shallow –open-
dried irrigation to reduce consumption water in order to establish the
scientific basis and practic to establish irrigational procedure .
3. RESEARCH METHOD
- Inheritance: based on some research results, appling to achieve
objective of the project.
- Primary analysis: deperiodining the impact of Shallow –open-
dried irrigation to rainfall as scientific basis for formulating the process
of water-saving.
- Field experimenl: to test theoretical research results.
- Statistical analysis: to handle the experimental results
4. SCOPE OF RESEARCH
The research was conducted within the general theory about the
impact of Shallow–open-dried irrigation, the level of reserves and
irrigation, the volume of irrigation for the region of Ha Nam Province.
Theoretical research is conducted on a database of 24 years (1985-
2008), experimental research was conducted in 4 harvest season (2
1
winter season and 2 summer season) to demonstrate for results of
theoretical research.
5. MEANING OF SCIENCE AND PRACTICE OF THEMES
• Meaning of science
- Establishing a scientific basis of influence between the
irrigational formula and water reserve levels to the levels of irrigational
water and the level of season’s irrigation.
- Establishing the scientific basis of the relationship between
effective rainfall and actual rainfall in Ha Nam.
• Practical Meaning
- Specified the potential to reduce the level of irrigation,
irrigational water is very large when apply Shallow–open-dried
irrigation regimes combined Reserve 100mm.
- Developing software to calculate water-saving regime for rice
with two basic importation on calculating volume of rain-water in
efficiency and ETO when dry field.
6. NEW CONTRIBUTIONS OF THESIS
- Theme showed potential of reducing volume of irrigational
water, it is reduced greatly if applied Shallow –open-dried irrigation
regime and reserve rain-water to 100mm without reducing output of
rice.
- Theme showed that there is no close correlation between
actual rainfall and effective rainfall in the south of Ha Nam.
7. STRUCTURE OF THE THESIS
The thesis is presented in four main chapters, comprised 149
pages, 32 tables, 59 figures, 62 references.
2
Chapter I
Overview OF the impact of Shallow open-–
dried to volume of water, volume of
Consumption
1.1 Overview of water regime on surface of field and main
processes in rice-soil
Under the influence of water regime on the surface of field,
occured process in rice-soil very diverse. Those processs includes:
changes of dynamics of reduction-oxidation reaction (Eh) changes of
acid of soil (pH) change of mechanical properties, status of exist of
nutrition in the soil and the relationship between reducing output and
irrigation regime.
In the soil, reducing reduction-oxidation reaction (Eh) depends
on the time and nature of submerged land and fertilizer regime. Besides
the dependence on these factors, Eh also depends on rice.
In the soil For pH, when the soil with value of pH > 7, the
process of full water, pH is decreased gradually and approach to value =
7. When the soil with value pH <7, due to the weak phase so pH
increases and gradually and approach to value = 7. time of Flood is long
so, pH is increasing on the value.
The metabolism of nutrients in the soil plays a very important
for the tree. When soil change the phase from anaerobic (flooded) to
Aerobic (dried), Chemical reactions in soil occured according to
direction of oxidation. The nutrients in soluble regime, good for rice
develops.
1.2 Overview of relationship between the lack of water to rice’s output
Theoretical and experimental researchs, practical of agricultural
production shown, the regime of surface water directly affects to the
3
productivity of rice. In general, when dehydrated, evaporation of
reduction affects to rice’s output.
1.3 Overview of effective rainfall in the world
1.3.1 Overview of effective rainfall in the world
In the World had many research on volume of effective rainfall
that was announced. Which notably:
• Research of the United State’s land protect organization:
Po = P(125 - 0,2P)/125; when P < 250 mm;
Po = 125 - 0,1P; when P > 250 mm.
in there: Po is the efficiency rainfall, P is the actual rainfall.
• Russian’s researchs:
with P ≤ E + (W
dr
- W
o
) take α = 1,
with P > E + (W
dr
- W
o
) take α = [E + (Wdr - W
o
)] / P.
Among them: P is the actual rainfall, E is actual evaporation; Wdr is
surface water layer at the end of period; W
o
is a surface water layer at
the the first of period; α is rainfall using Coefficient.
• Research of China:
for P < 5 mm, take α = 0;
for 5 mm < P < 50 mm, take α = 0,8 ÷ 1;
for P > 50 mm, take α = 0,7 ÷ 0,8.
• Programmer of CROPWAT: offer 4 open Plan.
Plan 1: P
hq
= % P
Plan 2: P
hq
= 0,6*P - 10 (for P < 70 mm)
P
hq
= 0,8*P - 24 (for P > 70 mm).
4
Plan 3: P
hq
= a*P - b (for P < z mm),
P
hq
= c*P - d (for P > z mm).
Coefficient a, b, c, d and z are confirmed by user.
Plan 4: P
hq
= P/125 (125 - 0,2*P) for P < 250 mm,
P
hq
= 125 + 0,1*P for P > 250 mm.
1.3.2 Effective rain research in Vietnam
Nguyen Duc Chau (2001) [7] on the basis of experimental
material in Tuy Phuoc district - Binh Dinh in 1998 ÷ 2000 shown using
coefficient of rainfall reached from C = 0.57 - 0.7.
1.3.3 Comments
- The research results in-home and out-home shown that
efficiency closely depended on research area.
- Most of research results in home only stop at results of
experiment that were not provide the way to period line effective
rainfall from the actual rainfall.
1.4. Overview of research for water saving irrigation of rice in the world
The reduction of water through contributing surface water
layers proved very effective. Notably, research in many countries as
Japan, China, Philippines, India, Spain, America etc. shown that if
reasonable regulation can reduce in maximum on the water from 20% to
45% compared with continuously flooded irrigation, output is not
reduced.
1.5 Overview of water saving research for rice in Vietnam
Within the system, researchs [8] [15] [18] shown that it
is possible to save the water from 5 to 10%.
On the surface of field, Some researchs [11] showed that
volume of water for irrigation fluctuates quite large. In formulars of
5
Shallow –open-dried irrigation, dried time of field is many, the rainfall
using coefficient is increased
1.6 Shapter’s conclution
• In the surface of neutrality-soils, applicating field dried mode,
process occured in the soil is good for rice. Includes:
- Eh up, harmful substances such as Fe2 +, CO2, organic acids, H2S is
reduced.
- Increasing oxygen in the soil, beneficial to the development of roots.
- Strengthening activities of beneficial bacteria in the root zone of rice.
• Although rice are very sensitive with the lack of water. but if apply
appropriate irrigation regime will not reduce output of rice.
• Rice is hygroscopic plant but if in full-water field is also limited
growth, so reducing output.
• On the surface of field, both basic research and applications, results
showed is fairly good. But in Vietnam, so far, no research of any research
announces on the impact of Shallow –open-dried regime to reducing water in
seasons in rainy condition and detail of operational management regimes.
• Affects of the Shallow –open-dried irrigation regime to lose
volume of water is also not mentioned in the published research. This is also
a problem need to detail in this thesis.
6
Chapter II
RESEARCH on rule of rainwater distribution
and affecting to effective rainfall,
volume of water, Consumed WATER
2.1 Research on rule of distribution volume of rain-water by the
time of the research area
2.1.1 Some characteristics on research area
Ha Nan is located the south of Hanoi, extend from 20
0
34'18'' to
21
0
18'26'' in the north latitude, 105
0
17'18'' to 106
0
0’28'' in the east
longitude, including 1 city and 5 districts with a total area of 85,958
hectares, population of 785,057 people. Irrigation system is almost by
dynamic.
2.1.2 Distributional rule of rainfall in the research area
Analyzing rain documents of Phu Ly station within 24 years
(1985-2008), results showed that: the distributional rule of rain on
(Table 2-1) with precipitation> 50mm got large proportion (60% for
spring and 82% for harvest season), it is disadvantage for increasing
using coefficient of rainfall.
Table 2-1: Rules on the average rainfall distribution at Phu Ly
station
Unit: %
TT Season X ≤
20mm
20<X≤50
mm
50<X≤
100mm
X> 100
mm
1 spring 16,6 23,9 44,5 15
2 harvest 5,8 12,2 55,6 26,4
7
2.2 Effect of rain distribution rules to efficiency of rainfall under
the current irrigation regime
2.2.1 Scientific basis
From equation:
Xhq
j
= (a
j
- a
j-1
) + ET
j
+ S
j
- m
j
(2-1)
with: Xhq
j
= X
j
- DR
j
in there: Xhq
j
is a effective rainfall in period from j-1 to j, X
j
is
a actual rainfall in period from j-1 to j, DR
j
is a consumption rainfall in
period from j-1 to j, a
j
, a
j-1
is a surface water layer at period j and j-1,
ET
j
is lose evaporation at period from j-1 to j, S
j
: is a lose by
impregnated in long time in period from j-1 to j,
On base of equation (2-1), with formulas NTX (a
j
=30-50mm),
NLLT (a
j
=0-50mm), or NLP (a
j
= 0-50mm), effective rainfall is period
by SWI software.
2.2.2 Research the relationship between rainfall and effective rainfall
according to the actual irrigation
2.2.2.1 The relationship between effective rainfall and actual rainfall by
rainstorm
Based on actual rainfall distribution into 3 groups: with X
tr
≤
20mm; 20 mm< X
tr
≤ 50mm; and X
tr
> 50 mm. Results of analysis has
over 3000 rainstorms within 24 years of 2 spring and autumn in Ha Nam
showed that , excluded group with X
tr
≤ 20mm (R
2
> 0,9), remaining
groups related to effective and actual rainfall (R
2
< 0,5).
2.2.2.2 The relationship between effective rainfall and actual rainfall by month
Except some months in the spring season with rainfall is a
correlation from average to closely (R
2
= 0,5 -:- 0,98), remaining
months are not tightly correlated (Table 2-2a,b).
8
Table 2-2a. The statistical parameter relations X
tt
and X
hq
statistic of spring reason in Ha Nam
Month Regression equation
Number
of
example
Correlation coefficient
R
2
I X
hq
= 0,23 X
tt
+ 8,4 24 0,49
II X
hq
= 0,73 X
tt
+ 3,7 24 0,97
III X
hq
= 0,46 X
tt
+ 12,2 24 0,76
IV X
hq
= 0,24 X
tt
+ 15,6 24 0,5
Table 2-2b. Statistical parameters with correlation X
tt
và X
hq
parameters of rain reason in Ha Nam.
Month Regression equation
Number
of
example
Correlation coefficient
R
2
VI X
hq
= 0,125 X
tt
+ 41,2 24 0,24
VII X
hq
= 0,164 X
tt
+ 79,8 24 0,48
VIII X
hq
= 0,2 X
tt
+ 74,6 24 0,36
IX X
hq
= 0,25 X
tt
+ 53 24 0,48
X X
hq
= 0,042X
tt
+ 10,1 24 0,1
2.2.3 The relationship between effective rainfall and actual rainfall
according to reason
Analysis Results on the relationship between effective and
actual rainfall showed that this relationship is less close in both Spring
harvest reasons (R
2
= 0,32 -:- 0,41) ( Table 2-2c).
Table 2-2c. Statistical parameters with correlation X
tt
và X
hq
reasons system in Ha Nam
reason Regression equation
Number
of
example
Correlation coefficient
R
2
Spring X
hq
= 0,173 X
tt
+ 152 24 0,32
harvest X
hq
= 0,141 X
tt
+ 207 24 0,41
9
2.3 Effects of rainfall distribution rule to the volume of irrigation
water under the current regime
results of correlation analysis between rainfall and irrigational
water levels in the Ha Nam's system showed there is no correlation
between these two quantities (R
2
= 0,04 -:- 0,05).
2.4 Influence of actual rainfall to irrigational water
Analysis Results of correlation between rainfall and irrigational
water showed a closed correlation (R
2
> 0,9) (Table 2-2d).
Table 2-2d: statistical parameters related to the actual rainfall
X
tt
and irrigational water DR and reason system in Ha Nam
Reason Regression equation
Number
of
example
Correlation coefficient
R
2
Spring DR = 0,823 X
tt
- 150 24 0,91
Harvest DR = 0,856 X
tt
- 203 24 0,96
2.5 Conclusions of chapter
-Rainfall in Ha Nan with rainstorms > 20mm predominant
absolute on total volume (83% for spring reason and 94% for harvest
season). So if the formula is applied irrigation NTX (30-50mm), will
not take advantage of rainfall which satisfies with the water regime of
the rice. So the rainfall and necessary volume of water is high.
- Although in some cases with correlation coefficient is very
closed (rain under time with X
tt
≤ 20mm; rain under month with X
th
<
30mm) but in general,
-Correlation between the actual rainfall and effective rainfall of
the remain cases are not closed. Therefore, there is no scientific basis to
establish the relationship between the actual rainfall and effective
rainfall on the system of Ha Nam.
10
- Analysis of the distribution of rain by time under total of
volume, results showed that rate of rain by time with 20mm<X≤100mm
reached high rate. This rate reached about 78% rainfall by reason in
spring reason and 92,6% rainfall by reason in harvest reason. Rain with
rainfall > 100mm only reached about 26,4% rainfall in harvest reason
and reached 15% rainfall in Spring reason. This is meaning in
determine the volume of water containing in reasons.
11
Chapter III
research on the effects OF Shallow open-–
dried irrigation AND volume of reserve to
irrigational volume of field
3.1 The theory of effects of Shallow–open-dried irrigation to the
rainfall, irrigational volume of rice fields
3.1.1 Basis to determine the volume of water and the rainfall to rice
in Ha Nam
To determine the rainfall m
j
and volume of Consumption DR
j
needing to solute the equation (3-1a) with conditions required (3-1b,c,d)
includes:
a
j
= m
j
+ a
j-1
- ET
J
- S
j
+ (X
j
- DR
j
) (3-1a)
a
min
≤ a
j
≤ a
max
(3-1b)
In there : t is one time of irrigation, ∆t is time of stop between 2
time of irrigation, X
j
is a actual average rainfall which pour out on total
area of irrigation, DR
j
is a average Consumption rainfall on total area of
irrigation. DR
j
is period base on basis of surface water layer at caculated
time. Detail as follows:
DR
j
= X
j
khi W
j-1
>= a
max
+ a
reserve
;
DR
j
= X
j
– (a
max
+ a
reserve
– W
j-1
) khi W
j-1
< a
max
+ a
reserve
;
DR
j
= 0 khi X
j
– (a
max
+ a
reserve
– W
j-1
) got a nagetive value.
In case of sowing by order, average values et
j
, S
j
, X
j
và DR
j
are
ajusted by multiply with coefficient K as follows:
K = j/tg khi j < tg,
K = 1 khi tg < j < tst,
K = 1 – j/(tst+tg) khi tst < j < (tst+tg)
In there : tg is time to sow, tst is growth time,
12
On base of soluting equation (3-1), the rainfall and rainfall in zone
under Ha Nam province within 24 years according to different equation of
irrigation are period by WSI software.
3.1.2 Research on effects of irrigational formula to potential of
reducing the volume of Consumption water and the rainfall for rice
field in Ha Nam province
On the basis of meteorological data for weather stations in Phu
Ly. Level of irrigation throught years at the face of field corresponds to
the irrigational formula NTX, NLLT, NLP and the level of reserves
(50mm, 100mm, 150mm), is identified by WSI software. Results as
follows.
3.1.2.1 Influence of irrigational formula and volume of reserve to to
potential of reducong the level of irrigation
Spring's season start on 15
th
to February 28
th
, harvests from May
20
th
onwards. Autumn's season sows start on 15
th
to June 30
th
, harvests
from October 20
th
onwards. Based on meteorological data, volume of
water of 3 irrigational formulas: NTX, NLLT and NLP with 3 reserve
mode (50mm, 100mm, 150mm), of the season of spring and harvest in
Ha Nam within 24 years (1985-2008) , is period
The analytical results show a closely related between the levels
of irrigation and irrigation formula of productional increasing. Highest
level at the formula NTX in two the season of spring and harvest (and
average 5612 m3/hectare and 4206 m3/hectare). In NLLT formula, the
average of irrigational level in 24 years in Spring reason with 4514
m3/hectare (down 19.6% compared with NTX) to 2875 m3/hectare of
harvest season (down 31.6% compared with NTX). In Shallow –open-
dried formula, the average irrigational level about 3926 m3/hectare (for
Spring, down 30% compared with NTX) and 2583 m3/hectare (harvest
reason downs 38.6% compared with NTX).
Regarding the relationship between depth of water reserve and
level of irrigation: if the depth of water storega is high so irrigational
13
level is low. Reduction of water level(compared to reserve 50mm)
received in the depth of 100 mm and 150 mm respectively with 21% to
24% (for Spring) and 43% to 53% (for harvest).
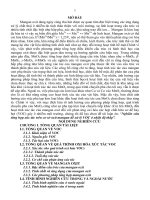
Spring reason Harvest reason
Figure 3-3c: Influence of depth of reserve water layer to the irrigational
level
3.1.2.2 Influence of irrigational formula and the depth of water reserve
to potential of reducing the volume of Consumption water.
There is a closely related between the rainfall water and
formula of production increase, between the rainfall water and the depth
of rain water reserve, the volume of Consumption water is reduced from
formula of agricultural irrigation in regular, Shallow–open-Continues to
Shallow–open-dried. The level of Reducing irrigational water reached
about 23% of the harvest reason and about 29% to 30% of spring reason
respective with Shallow–open-Continues and Shallow –open-dried
formulas.
For the relationship between the depth of rain water reserve and
volume of Consumption water, results showed that reduction of
Consumption water between different depths are very different. The
difference between the reserve with 50mm and 100mm are very large,
this difference reached 35% to 70%. In contrast, the difference between
reserve with 100mm and 150 mm is not much. Between these two
levels of reserve, The level of Consumption water reduction from 10%
to 15%.
14
Spring Reason Harvest Reason
Figure 3-6: Influence of irrigational formula and sthe depth of reserve
water layer to Consumption water
3.2 Research on experimental field
3.2.1 Research Method of field experiments
3.2.1.1 Purpose of Research Method of field experiments
Purpose of experiment in order to: determine the impact of the
formula to irrigate rice yield and test results of theoretical research.
3.2.1.2 Items needs to experiments measure and measurement method
The measured value should include: water level on experiment
cells in every day, rainfall in every day in reason, the rainfall water in
every day in experiment cells, the level of irrigational in each
experiment cell, targets students growth and development and yield of
rice.
3.2.1.3 Methods of data process and statistical analysis
To process the data, criteria is used includes:
- Average quantity and variance.
- Ttest Standard. if
+ t
STAT
> t
(α/2)(n-1)
: allowed to concludes that 2 statistical samples
is different and statistical meaning p=
α.
15
+ t
STAT
≤ t
(α/2)(n-1)
: allowed to concludes that 2 statistical samples
is not different with statistical meaning p=
α.
3.2.2 Content of experimental arrangement
Placement of experiment in Liem Tiet, Thanh Liem, Ha Nam.
Experiment time from the Harvest reason in 2005 to Spring Season in
2007.
Experiments with 10 cells, size 1.5 x 1.5 m with 9 watering
formula. Layout cells following experiments:
- Cell No 1: irrigating NTX, reserves 50mm;
- Cell No 2: irrigating NTX, reserves 00mm compared to
surface of filed.
- Cell No 3: irrigating NTX, reserves 150mm compared to
surface of filed;
- Cell No 4: irrigating NLLT, reserves 50mm;
- Cell No 5: irrigating NLLT, reserves 100mm;
- Cell No 6: irrigating NLLT, reserves 150mm;
- Cell No 7: NLP, reserves with 50mm: field dried process as
follows:
+ 10 first days: remain the surface layer about 30-50mm,
16
Figure 3-7: Diagram of cells in experiment at Liem Tuyet
+ To eleventh day to the end of lay branch: irrigating to 50mm,
to dry in nature, when filed dried 5 days (for Spring reason) and 3 days
(for Harvest reason) irrigate to 50mm. 7 to 10 days before the end of to
branch without irrigation.
+ The end Period of to branch (10 days): let’s dry in nature.
+ Period of seat- flowering: irrigate to 50mm, when filed dried
so continuing with irrigation.
+ The end period: irrigate as the period of to branch, 10 days
before harvest without irrigation.
- Cell No. 8: NLP, reserves 100mm. as Cell No. 7;
- Cell No. 9: NLP, reserves 150mm. as Cell No 7;
- Cell No. 10 (with bottom): irrigate NTX (30-50mm).
3.2.3 Results of research and Discussion
3.2.3.1 Influence of irrigational formula to output of rice
With a sample size n = 10, the statistical quantities showed that
average deviation with probability p = 0.01: from 0.019 to 0.08. Can be
concluded that output of rice between formulas is not different with meaning
17
statistically. it means, the difference in water regime of formulas within the
research scope did not reducing output of experimental rice.
3.2.3.2 Influence of irrigational formulas and the volume of reserve to
the level of irrigation
By analysis method of variance with two-factor effects. Anova
statistical test showed that, except with 100mm and 150mm of reserves,
the remaining formula has FSTART> FCRIT. This suggests that
between two irrigational formulas, the difference is statistically
significant.
3.2.3.3 Influence of irrigational formulas and the volume of reserve to
the level of Consumption
By analysis method of variance two-factor effects, conducting
statistical test on the difference in Consumption water between formulas
and level of reserves. Statistical test results of Anova showed:
+ for the irrigational formula: Having the difference with
statistically significant on the volume of consumption water. it means,
the effect of irrigational formulas made the difference on the volume of
Consumption water according to trend of reduction from NTX, NLLT
and NLP in all seasons.
+ On the level of rain reserve: between two levels of reserve
are 50mm and 100mm, there is a fairly large variations in consumption
water . The difference according to the trend reduction from 100mm to
50mm.
3.2.3.4 Comparing to results with experimental measurement and
theoretical calculation
a) On level of irrigation
18
Comparing to the irrigation level of the harvest reason in 2005,
harvest reason and spring reason in 2006 and spring reason in 2007
showed the difference in irrigation levels between theoretical and actual
in 4 cases about 6.58%. This is the error is acceptable.
b) On the volume of consumption water
Deviation between the theoretical and experimental results between
irrigation formulas and average level of reserve about 6.77%. This is the
deviation is acceptable.
3.3 Conclusions of the chapter
1) There is a closely related formula irrigation and rain water
reserve depth to water level and water quality standards. The decrease
in water level and water quality criteria to achieve the maximum
applicable rate formula combines NLP reserves 100mm. This is the
basis for selection regimes in irrigated fields to reduce water, reducing
consumption water for irrigation in Ha Nam province.
2) The potential for irrigation to reduce the average area of Ha
Nam for the service (if applicable rate reserve formula and NLP 100
mm) can be reduced by 40% for the irrigation service and over 55% for
Spring reason.
3) The potential to reduce consumption water of the average for
the service (if you apply the same formula applied irrigation and
reserves NLP 100mm) can achieve over 65% of cases and nearly 44%
of spring reason. Analysis of materials measured in four cases between
NTX watering recipes, and NLP NLLT shows:
4) There are big differences between the two levels of irrigation
on rain water reserves levels are 50mm and 100mm field. The
difference according to trend gradually reduces watering from the
reserve level rise 100mm 50mm. However, no significant difference in
19
statistics between the two levels of water reserves levels 100 mm and
150 mm.
5) Influence of watering recipes and store rainwater to the water
Quality criteria. This trend affected by decreasing consumption water
from irrigation to NLLT, NTX and NLP. reduction of consumption
water as well as trend decreases with increasing dimension of the rain
water reserves. But when the reserves increased to 150mm, the
reduction of consumption water is negligible.
6) Results of measurement and calculation results of water level
and water quality objectives in the four cases shows that the difference
between the two results is acceptable
Chapter IV
RESEARCH AND BUILDING
SOFTWARE FOR CACULATING SHALLOW–OPEN-
DRIED REGIME
4.1 Scientific basis and algorithm
Scientific basis of the multiply of water-saving regime for rice is
period based on water balance equation, written for a unit area in a
certain time period, of the form:
a
j
= a
j-1
+ m
j
+ P
hqj
– (S
i
+ ET
i
) (4-1)
in there : a
j
last field is the surface water layer on (mm), a
j-1
surface water layer is the first field day (mm), m
j
irrigation water is
needed (mm), K
i
is a volume of water was absorbed (mm), DR
i
is water
is removed (mm), P
hqj
is the effective rainfall (mm) in the calculation
period. P
hqj
= X
j
– DR
j
. X
j
the rainfall in the calculation period; DR
j
is
water is removed, ET
j
is the total water was vapored (mm), j is
caculation period.
20
The deperiodination of irrigational level m
j
based on base of
deperiodining compoments of water equation (4-1) to water layer on the
surface of field alway be value a
min
÷
a
max
, when water layer on the
surface of field in value a
min
or under value a
min
so lets irrigate to value
a
max
then stop.
In full water condition (in period not dry field), compoments E
i
is period by formula:
ET
i
= ETc = Kc x ETo. (4-2a).
In there: ETc: volume of actual vapor water (mm),Kc:
coefficent of plant, ETo: volume of vapor water of standard.
In the field drying period, ET
i
is caculated under formula:
ET
i
= ETc = Ks x Kc x ETo. (4-2b).
In there: Ks is the coefficient of lack of soil moisture depends
on soil moisture. Ks = 1 when soil moisture larger than a certain value
(about 80% moisture saturation), Ks <1 when soil moisture less than
80% moisture saturation. The deperiodination of the Ks are conducted
in experimental.
In the field exposure time, water contained in a section of land
should evaporate soil moisture during this period under saturated
humidity. So to make the initial moisture O
i
to moisture saturation β
bh
,
need for additional water level w. with:
w
j
= (β
bh
– β
j
) x h
in there : - h: is the soil depth in the deep roots of rice effective.
if β
bh
, β
j
is caculated by % volume of soil, h is caculated by mm,
w
j
là mm. therefore, value a
min
in this period is a nagative value: a
min
= -
w
j
in there : w
j
: is necessary water volume to to bring soil
moisture from the initial value of the saturation value of moisture.
21
The second consideration when calculating the irrigation regimes
(4-1) is to determine effective rainfall. Precipitation efficiency must be period
based on class field at the surface is wet. Includes:
P
hqj
= P
j
if a
reserves
- a
j-1
>= P
j
,
P
hqj
= a
reserves
- a
j-1
if a
reserves
- W
j-1
< P
j
,
P
hqj
= 0 nếu a
j-1
>= a
reserves
.
In there: a
reserves
: is a depth of water reserves.
Based on a scientific basis showed above, constructing a
calculation software of water-saving regime for rice is done on the basis
of improving calculation software of CROPWAT irrigation regimes
currently is used. Specifically, this software is designed to connect to
values of CROPWAT ETO. Algorithms and calculation order are done
under block diagram in Figure 4-1.
4.2 Select programming languages and software design
Software calculates water-saving regimes for rice (WSI) is
designed based on the system base. Net. Including the main parts as
follows:
22
Mo-dun of read and record files
23
Figure 4-1 Flowcharts to determine level of irrigation m
j
- Read X rainfall file
- Read files of ETo vapor volume.
24
- Read and record files in irrigational regime.
• Module of set up calculation parameters
• Module of set up saving irrigation regime
On the basis of connectivity CROPWAT software to receive
ETO result file, other parameters such as rainfall, reason, relations Ks
and soil’s moisture, water-saving formula, etc. are taken from data file
or entered directly from the keyboard, water-saving regime for rice is
period.
4.3 Comments
WSI software has improved as follows:
+ Effective rainfall is period on the basis of surface water layer
at the time of calculation and actual rainfall.
+ During the Shallow period, moisture is smaller than field’s
moisture, etc. are multiply by multiply the coefficient of lack of soil’s
moisture to the formula ETc
Conclusion and recommendation
A. Conclusion
1. Effective rainfall in calculating of irrigational regime for a
quantity of rice is not only dependent on rainfall distribution rules but
also on the surface water layer at the time of rain. Research results of
relationship between actual and effective rainfall in 2892 rainstorm
during 24 years (1985-2008) of the Ha Nan region showed that between
those two quantities are not tightly correlated statistics. Therefore can
not build Line of actual relation and effect rain of the zone.
2. There is a closely between irrigational formulas and depth of
rain water reserve and volume of consumption water. Level of
irrigational water and consumption water, if Appling minimize Shallow
25