Blood on FTA™ Paper: Does Punch Location Affect the Quality of a Forensic DNA Profile?
Bạn đang xem bản rút gọn của tài liệu. Xem và tải ngay bản đầy đủ của tài liệu tại đây (1.31 MB, 169 trang )
Graduate School ETD Form 9
(Revised 12/07)
PURDUE UNIVERSITY
GRADUATE SCHOOL
Thesis/Dissertation Acceptance
This is to certify that the thesis/dissertation prepared
By
Entitled
For the degree of
Is approved by the final examining committee:
Chair
To the best of my knowledge and as understood by the student in the Research Integrity and
Copyright Disclaimer (Graduate School Form 20), this thesis/dissertation adheres to the provisions of
Purdue University’s “Policy on Integrity in Research” and the use of copyrighted material.
Approved by Major Professor(s): ____________________________________
____________________________________
Approved by:
Head of the Graduate Program Date
Megan Elizabeth Carter
Blood on FTA™ Paper: Does Punch Location Affect the Quality of a Forensic DNA Profile?
Master of Science
Christine Picard
Stephen Randall
Jay Siegel
Christine Picard
Christine Picard
05/09/2012
Graduate School Form 20
(Revised 9/10)
PURDUE UNIVERSITY
GRADUATE SCHOOL
Research Integrity and Copyright Disclaimer
Title of Thesis/Dissertation:
For the degree of
Choose your degree
I certify that in the preparation of this thesis, I have observed the provisions of Purdue University
Executive Memorandum No. C-22, September 6, 1991, Policy on Integrity in Research.*
Further, I certify that this work is free of plagiarism and all materials appearing in this
thesis/dissertation have been properly quoted and attributed.
I certify that all copyrighted material incorporated into this thesis/dissertation is in compliance with the
United States’ copyright law and that I have received written permission from the copyright owners for
my use of their work, which is beyond the scope of the law. I agree to indemnify and save harmless
Purdue University from any and all claims that may be asserted or that may arise from any copyright
violation.
______________________________________
Printed Name and Signature of Candidate
______________________________________
Date (month/day/year)
*Located at />Blood on FTA™ Paper: Does Punch Location Affect the Quality of a Forensic DNA Profile?
Master of Science
Megan Elizabeth Carter
05/09/2012
BLOOD ON FTA™ PAPER: DOES PUNCH LOCATION AFFECT
THE QUALITY OF A FORENSIC DNA PROFILE?
A Thesis
Submitted to the Faculty
of
Purdue University
by
Megan Elizabeth Carter
In Partial Fulfillment of the
Requirements for the Degree
of
Master of Science
August 2012
Purdue University
Indianapolis, Indiana
ii
ACKNOWLEDGMENTS
I would like to thank Dr. Christine Picard for being a wonderful thesis advisor,
mentor and friend throughout my entire thesis process. I would also like to thank Dr. Jay
Siegel for accepting me into the forensic science graduate program which allowed me to
pursue my dreams of becoming a DNA analyst, and also for his guidance and support
throughout my career at IUPUI. Thank you to Dr. Stephen Randall, as well as Drs.
Picard and Siegel, for taking the time to act as members of my committee. Thank you to
the IUPUI School of Science for providing the funding to support my research.
Also, I appreciate the opportunity I had to work as an intern in the forensic
biology unit at the Indiana State Police Laboratory Division under the supervision of Carl
Sobieralski. Being able to experience the day-to-day workings of a real crime laboratory
and observation of casework and courtroom testimony will be of great benefit to me as I
continue on in my future career. I owe a huge debt of gratitude to my friend Joanna Will,
a Ph.D. clinical psychology student at the University of Virginia, for her help in the
statistical analysis of my data. And finally, thank you to my husband Justin for his
computer wizardry skills, without which I could not have completed this paper, and also
for his love and support in all aspects of my life.
iii
TABLE OF CONTENTS
Page
LIST OF TABLES v
LIST OF FIGURES viii
LIST OF ABBREVIATIONS x
ABSTRACT xii
CHAPTER 1. INTRODUCTION 1
1.1 Introduction to Forensic DNA Analysis 1
1.2 History of Forensic Biology 2
1.3 Introduction to FTA™ Paper 7
1.4 Evaluating Profile Quality 9
1.4.1 Peak Characteristics 10
1.4.2 Concordance 10
1.5 Purpose of the Study 13
CHAPTER 2. MATERIALS AND METHODS 15
2.1 Sample Collection Protocol 15
2.2 FTA™ Card Protocol 15
2.3 STR Amplification Protocol 16
2.4 Fragment Analysis Protocol 16
2.5 Data Analysis 17
CHAPTER 3. RESULTS 21
3.1 Failed Reactions 21
3.2 Partial Profiles 22
3.3 Concordance 23
3.4 Peak Characteristics 26
iv
Page
3.4.1 Minus A 26
3.4.2 Stutter 27
3.4.3 Peak Heights 28
3.4.4 Heterozygote Peak Height Ratios 30
3.4.5 Allelic Dropout 34
3.5 Edge Punch Comparison 35
3.5.1 Minus A 36
3.5.2 Peak Heights 36
3.5.3 Heterozygote Peak Height Ratios 39
CHAPTER 4. DISCUSSION 43
CHAPTER 5. CONCLUSIONS 45
REFERENCES 47
APPENDIX 51
v
LIST OF TABLES
Table Page
Table 1 Stutter filter percentages (GeneMarker® HID). Only peaks above
the listed percentages (below) were called or flagged by the software. 18
Table 2 Results from the comparison of failed reactions at each punch
location. The halfway punch location had the most failed reactions. 22
Table 3 Results from the comparison of partial profiles at each punch
location. The center punch location had the highest number of partial
profiles. 22
Table 4 Description of criteria used to distinguish true peaks from extra
peaks caused by other technological or biological artifacts. Decisions
were made based on the position of the peak, size of peak, and presence
of peaks of the same size in multiple different colors. All examples were
observed within samples collected in this experiment. 24
Table 5 The ANOVA results for the –A examination shows that there is
not a significant difference in the number of loci with –A between the three
punch locations (significance >0.05). 27
Table 6 Results from analysis of stutter. The halfway and edge punch
locations had one stutter peak each as compared to zero stutter peaks
observed at the center punch location. 28
Table 7 The ANOVA results for average peak height shows that there is
not a significant difference in the average peak height between the three
punch locations (significance >0.05). 30
vi
Table Page
Table 8 The ANOVA results for the average peak height ratios shows that
there is a significant difference in the average peak height ratios between
the three punch locations (significance <0.05). 31
Table 9 The results of post hoc Dunnett’s T3 pair-wise comparisons of
average peak height ratios showed that there is a significant difference in
the peak height ratios between the center and halfway and edge and
halfway punch locations but not between the center and edge punch
locations (significance <0.05). Significant relationships are highlighted in
bold. 32
Table 10 The ANOVA results for the average peak height imbalance shows
that there is not a significant difference in the average peak height
imbalance between the three punch locations (significance >0.05). 34
Table 11 Results from the analysis of allelic dropout. The center punch
location had the highest number of profiles with allelic dropout present. 35
Table 12 A comparison of the number of loci with -A present in each of the
edge punches at five different locations in three randomly selected FTA™
cards. The number of loci with -A within each individual is similar: the
variance in sample 3701 is less than nine percent, variance in sample 6233
is less than seven percent, and sample 7572 is less than 18%. 36
Table 13 Results from the peak height comparison for the fifteen edge
punches. Average peak height and standard error for each sample is given. 37
Table 14 Results of nested ANOVA testing for peak height. There was not
a significant difference between any of the punches within each individual
(p-value = 0.421), or between all fifteen punches (p-value = 0.874). 39
Table 15 Results from the peak height ratio comparison for the fifteen edge
punches. Average peak height ratio and standard error for each sample is
given. 40
vii
Table Page
Table 16 Results of ANOVA testing for heterozygote peak height
ratio. There was not a significant difference between any of the fifteen
punches (significance > 0.05). 42
viii
LIST OF FIGURES
Figure Page
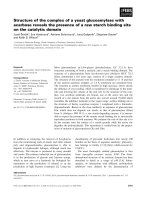
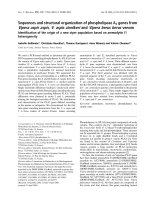
Figure 1 An electropherogram of the GeneScan™ 600 LIZ® Size Standard
showing the different sizes of the fragments. Copyright © 2011 Life
Technologies Corporation. Used under permission. 4
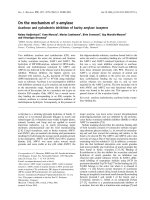
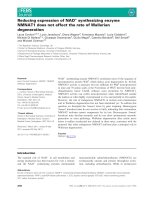
Figure 2 The allelic ladder from the Identifiler® Plus PCR amplification kit
[9]. It contains the most common alleles at each locus in the kit. The STR
amplification product is compared to this ladder and allele calls are made.
Copyright © 2011 Life Technologies Corporation. Used under permission. 5
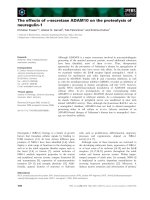
Figure 3 DNA entangled in Whatman FTA™ Paper matrix [23].
Copyright © 2011 GE Healthcare Corporation. Used under permission. 7
Figure 4 An example of the three disc locations taken from a bloodspot on
FTA™ paper: center, halfway, and edge [photo, Megan Carter]. Average
bloodspot size was found to be 9.74 mm in diameter, distance from center
to edge was an average 4.87 mm, and distance from halfway to edge was
an average 2.44 mm. 14
Figure 5 An example of allelic drop-in seen at the center punch location of
sample 565 of the study. The extra peak was only observed in one of the
three profiles at the D19S433 locus. This extra peak was determined to be
the result of allelic drop-in and not the result of a mixture, contamination,
or any other technological artifacts. The peak did not reoccur when an
adjacent sample was amplified. 25
ix
Figure Page
Figure 6 An example of –A peaks that surpassed the threshold amount and
were flagged by the software at all three punch locations in sample 6080
of the study. The amount of –A is higher than the true peaks at the center
and halfway punch locations. 26
Figure 7 Box and whisker plot of the –A data. The dark square represents
the location of the average number of loci with –A for each punch location. 27
Figure 8 An example of a stutter peak (allele 11) at the edge punch location
of sample 338 of the study. Minus A is also present one base pair shorter
than the true allele (allele 12). 28
Figure 9 Box and whisker plot of the peak height data. The dark square
represents the location of the average peak height for each punch location. 29
Figure 10 Box and whisker plot of the peak height ratio data. The dark
square represents the location of the average peak height ratio for each
punch location. 31
Figure 11 An example of peak height imbalance at the center punch
location from sample 777 of the study. The peak at allele 15 is much
shorter than the peak at allele 13, resulting in an imbalanced ratio. 33
Figure 12 Box and whisker plot of the peak height imbalance data. The
square represents the location of the average imbalance ratio for each
punch location. 33
Figure 13 An example of allelic dropout of one allele (11) in a
heterozygote (11, 12) resulting in false homozygosity at the center punch
location of sample 651 of the study. 35
Figure 14 Box and whisker plots of the peak height data. The square
represents the location of the average peak height for each punch location. 38
Figure 15 Box and whisker plots of the heterozygote peak height ratio
data. The square represents the location of the average heterozygote peak
height ratio for each punch location. The samples with imbalanced peak
height ratios are easily visible on the plot for 3701B, C and E. 41
x
LIST OF ABBREVIATIONS
° degree
µL microliter
-A minus A
+A plus A
ABI Applied Biosystems
ANOVA analysis of variance
bp base pairs
BSA bovine serum albumin
C Celsius
CE capillary electrophoresis
CODIS combined DNA index system
DNA deoxyribonucleic acid
EDTA ethylenediaminetetraacetic acid
FTA™ fast technology for analysis of nucleic acids
IUPUI Indiana University-Purdue University Indianapolis
min. minute(s)
mm millimeter
ηg nanograms
PCR polymerase chain reaction
pg picograms
RFLP restriction fragment length polymorphism
RFU relative fluorescence unit
RMP random match probability
sec. second(s)
xi
STR short tandem repeat
SWGDAM Scientific Working Group on DNA Analysis Methods
UV ultraviolet
VNTR variable number of tandem repeats
xii
ABSTRACT
Carter, Megan Elizabeth. M.S., Purdue University, August 2012. Blood on FTA™
Paper: Does Punch Location Affect the Quality of a Forensic DNA Profile? Major
Professor: Christine Picard.
Forensic DNA profiling is widely used as an identification tool for associating an
individual with evidence of a crime. Analysis of a DNA sample involves observation of
data in the form of an electropherogram, and subsequently annotating a DNA “profile”
from an individual or from the evidence. The profile obtained from the evidence can be
compared to reference profiles deposited in a national DNA database, which may include
the potential contributor. Following a match, a random match probability is calculated to
determine how common that genotype is in the population. This is the probability of
obtaining that same DNA profile by sampling from a pool of unrelated individuals. Each
state has adopted various laws requiring suspects and/or offenders to submit a DNA
sample for the national database (such as California’s law that all who are arrested must
provide a DNA sample). These profiles can then be associated with past unsolved
crimes, and remain in the database to be searched in the event of future crimes. In the
case of database samples, a physical sample of the offender’s DNA must be kept on file
in the laboratory indefinitely so that in the event of a database hit, the sample is able to be
retested.
Current methods are to collect a buccal swab or blood sample, and store the DNA
extracts under strict preservation conditions, i.e. cold storage, typically -20° C. With
continually increasing number of samples submitted, a burden is placed on crime labs to
store these DNA extracts. A solution was required to help control the costs of properly
storing the samples. FTA™ paper was created to fulfill the need for inexpensive, low
xiii
maintenance, long term storage of biological samples, which makes it ideal for use with
convicted offender DNA samples. FTA™ paper is a commercially produced, chemically
treated paper that allows DNA to be stored at room temperature for years with no costly
storage facilities or conditions. Once a sample is required for DNA testing, a small disc
is removed and is to be used directly in a PCR reaction. A high quality profile is
important for comparing suspect profiles to unknown or database profiles. A single
difference between a suspect and evidentiary sample can lead to exclusion.
Unfortunately, the DNA profile results yielded from the direct addition have been
unfavorable. Thus, most crime laboratories will extract the DNA from the disc, leading
to additional time and cost to analyze a reference sample. Many of the profiles from the
direct addition of an FTA™ disc result in poor quality profiles, likely due to an increase
in PCR inhibitors and high concentrations of DNA.
Currently, standardized protocols regarding the recommended locations for
removal of a sample disc from a bloodspot on an FTA™ card does not exist. This study
aims to validate the optimal location by comparing DNA profiles obtained from discs
removed from the center, halfway, and edge locations of a bloodspot from 50 anonymous
donors. Optimal punch location was first scored on the number of failed, partial or
discordant profiles. Then, profile quality was determined based on peak characteristics of
the resulting DNA profiles. The results for all three disc locations were 5.3% failed
amplifications, 4.2% partial amplifications, and one case of a discordant profile. Profile
quality for the majority of the samples showed a high incidence of stutter and the absence
of non-template adenylation. Of the three disc locations, the edge of the blood stain was
ideal, due to a presumably lower concentration of DNA and likely more dilute amount of
the PCR inhibitor heme. Therefore, based on the results of this study, there is a greater
probability of success using a sample from the edge of a blood stain spotted in FTA™
paper than any other location of the FTA™ card.
1
CHAPTER 1. INTRODUCTION
1.1 Introduction to Forensic DNA Analysis
Forensic DNA identification technology is widely used as a tool for associating an
individual with evidence of a crime. Analysis of a sample involves developing an
individual’s “profile” by analyzing a biological sample which contains DNA. The profile
obtained from an evidentiary sample can be compared to the profile obtained from a
suspect or a database. Following a match, statistical analysis is performed to determine
the random match probability (RMP) of the profile, which is of finding an identical
profile in a given ethnic population (if known). For example, in the case of a sexual
assault, biological material such as semen left on the victim or at the crime scene is
collected and a DNA profile of is obtained. If there is a suspect associated with the case,
this evidentiary profile is then compared to a suspect’s profile to determine whether there
is a match. If no suspect is associated with a case, the unknown profile may be searched
against a national DNA database called CODIS (Combined DNA Index System).
Depending on the state, any person is convicted of a crime is required to have his or her
profile entered into a searchable database and this profile can then be associated with
evidence from past unsolved crimes, and possibly assist in the event of future crimes.
Therefore, it is crucial to upload a reliable profile in order to make a comparison between
a suspect and the evidence.
2
1.2 History of Forensic Biology
Prior to DNA profiling, blood type analysis was used, albeit primarily for
exclusion purposes, and with only four blood types plus Rhesus factors, little
discrimination was possible [1, 2]. For example, 42% of the population has type A blood
and 42% has type O blood, and 85% of the population is positive for Rhesus factor [2].
The probability of discrimination for ABO blood typing is approximately 0.40, which
means there is a 40 percent chance that two randomly selected people would have the
same blood type [2]. Following blood typing, protein-specific antibody tests based on
polymorphic proteins associated with the immune system were used. Although these
methods were more discriminating than the blood typing system, with a power of 0.19,
about one in every five people [2]. More modern techniques of the analysis of biological
materials include the analysis of DNA (deoxyribonucleic acid). Every nucleated cell
contains 23 pairs of chromosomes, one inherited maternally and one paternally.
Interspersed among genes and regulatory elements are repetitive sequences of DNA
which are used to develop a DNA profile.
DNA profiling, or simply genotyping, was first utilized in a forensic context by
Sir Alec Jeffreys in 1985 [3]. It was based on counting the number of repeats of a
specific DNA sequence at known locations (loci) in the human genome [3]. Jeffreys’s
original genotyping method, referred to as restriction fragment length polymorphism
(RFLP) analysis, used restriction enzymes to digest DNA at enzyme specific sequences
[3]. The fragments, known as alleles, would be electrophoretically separated based on
their size, and one or two alleles would appear, depending on whether the person was
homozygous (meaning the same number of repeats for both alleles) or heterozygous
(meaning a different number of repeats, resulting in differently sized fragments). These
sequence repeat regions are known as variable number tandem repeats (VNTRs), and are
forensically useful because the number of repeats is variable, or polymorphic, within the
human population [3, 4]. VNTRs have a core repeat length of approximately ten to 100
bases, resulting in fragments that could be thousands of base pairs long [3, 4]. Though
VNTRs are discriminatory, they require a large amount of template DNA that is of high
quality, and unfortunately this is not a likely scenario with most forensic samples.
3
An alternative to VNTR genotyping is short tandem repeat (STR) genotyping.
This method that takes advantage of PCR (polymerase chain reaction), which reduces the
need for large concentrations of DNA [5-7]. STRs are similar to VNTRs, but with a
shorter core repeat length of approximately two to six bases, resulting in overall shorter
lengths of polymorphic fragments [8]. The shorter lengths of STRs as compared to
VNTRs are useful because degraded samples are common in forensic samples, and
shorter sequences are less likely to become degraded than longer sequences, thereby
reducing the need for high quality DNA.
The steps, in order, of the current standard DNA analysis are as follows:
collection, extraction, quantitation, STR amplification, separation and detection, and data
analysis [9]. Collection involves the initial recovery of a DNA sample, either from a
crime scene or from a reference sample. This step is crucial in preventing contamination,
and followed by proper storage to minimize degradation. Following collection,
extraction is then performed to isolate and purify the DNA from the remaining cellular
material and halt any further enzymatic degradation. Next, and importantly to the
specific downstream applications, the quantity of DNA must be determined. This step is
important because commercial PCR amplification reactions call for narrow concentration
ranges of DNA [9]. If too much DNA is added, profiles will have split or off-scale peaks.
If too little DNA is added, profiles are susceptible to stochastic fluctuations in PCR
amplifications, which can lead to partial profiles or false homozygosity [9-11].
The process of PCR was invented by Kary Mullis in 1985 [12]. PCR takes a
DNA region of interest and makes many copies of that specific sequence, a process is
known as amplification [12]. PCR is a series of heating and cooling cycles during which
sequence-specific primers anneal to single stranded template DNA. These primers are
then extended by a polymerase adding bases complementary to the template DNA
sequence, creating new copies of the DNA of interest [12]. After each cycle, the number
of template DNA molecules doubles [12]. This exponential growth in the number of
specific regions of DNA, known as amplicons, leads to millions or billions of copies after
25 to 35 cycles [12]. This amplified DNA containing only the loci of interest is then
separated and detected either using gel or capillary electrophoresis (CE). The fragments
4
are separated by size, with smaller fragments traveling through the matrix more quickly
than larger fragments [6]. In modern forensic DNA practices, this is performed using
CE. In a CE instrument, a laser is used to excite the fluorescently labeled primers that
were added to the DNA fragments during PCR amplification. These laser-excited
fragments are then detected as they travel through the instrument past a detection window
[6]. The use of fluorescently labeled primers also allows for multiplexing of
amplifications, allowing for the detection of up to 20 STR loci in a single PCR reaction
[5, 6, 8, 9].
This information is then analyzed with genotyping software, such as
GeneMapper® (Applied Biosystems, Foster City, CA) or GeneMarker® (Softgenetics,
State College, PA). An internal size standard is run through the CE instrument in
conjunction with all STR amplification products in order to properly size all fragments
[6]. The size standard is a set of DNA fragments of known sizes that is used to create a
standard curve (Figure 1).
Figure 1 An electropherogram of the GeneScan™ 600 LIZ® Size Standard showing the
different sizes of the fragments. Copyright © 2011 Life Technologies Corporation. Used
under permission.
The sizes are recorded as peaks in an electropherogram. A standard curve is
created to correlate the size of the fragments with the time of travel from injection to the
detection window.
5
Figure 2 The allelic ladder from the Identifiler® Plus PCR amplification kit [9]. It
contains the most common alleles at each locus in the kit. The STR amplification
product is compared to this ladder and allele calls are made. Copyright © 2011 Life
Technologies Corporation. Used under permission.
This is then used to calculate the sizes of the fragments in an allelic ladder. An
allelic ladder (Figure 2) is a DNA sample that contains all of the common alleles at each
locus included in the kit [6].
An allelic ladder must be included with each run of the genetic analyzer. The
sized STR fragments are then genotyped based on the ladder allele calls. The numbers
represent the number of repeats of the STR sequence present at each locus. For example,
if a person inherited 17 repeats from their mother and 18 repeats from their father at one
locus, their heterozygous genotype at that locus is 17, 18. A person can also inherit the
same number of repeats from both parents, for example 18, 18, which is considered
homozygous.
STR loci are chosen based on certain characteristics which make them beneficial
for forensic analysis. For CODIS, there are 13 core STR loci [9]. These selected STR
loci are polymorphic, which means there is large variation in the different possible
numbers of repeats present within the human population, and therefore they are capable
6
of individualizing identifications [5, 8]. Because STRs are so polymorphic, multiplexing
them to analyze several loci at once results in a high power of discrimination between
individuals [8]. The statistical calculations performed on DNA profiles are known as
random match probability (RMP). The RMP is the chance that a person randomly
selected from a population would have the same DNA profile. RMPs are calculated by
multiplying the allele frequencies from all loci using the product rule because each locus
is independent, and then dividing one by that number. Due to the polymorphic nature of
each locus, statistical calculations give a RMP of more than one in a trillion when all 13
core CODIS loci are tested [13].
An important issue that can arise with forensic casework samples is the presence
of PCR inhibitors. These samples are found in dirty locations where samples have been
exposed to substances that can interfere with the genotyping process. An example is
PCR inhibitors [5, 14]. Items such as soil, plants, leather, clothing dyes such as indigo,
and even heme in blood are known inhibitors [15-17]. Inhibitors prevent cell lysis
(extraction of DNA from a cell), degrade samples, and prevent the polymerase from
binding and annealing to the template, all of which lead to failed amplifications [9, 14].
Possible solutions to reduce the effects of PCR inhibitors are sample dilutions, the
addition of excess polymerase, the addition of BSA or further purification with silica
columns all reduce the effects of inhibitors [17, 18].
Forensic DNA samples are also degraded by environmental factors such as UV
light, heat, moisture, bacterial growth, therefore biological samples must be stored
carefully to avoid further damaging or contaminating the samples. When collecting
biological samples, they must be dried and carefully packaged to avoid coming into
contact with other evidence. In addition, the samples are stored cold to prevent any
further degradation. In the case of database samples, a physical sample of the offender’s
DNA must be kept in the laboratory indefinitely in case a database hit ever occurs and the
sample must be retested. Due to the large number of these samples, a solution was
required to help control the costs of properly storing the samples while also minimizing
the risk of contaminating the evidence. FTA™ paper was created to fulfill the need for
7
inexpensive, low maintenance, long term storage of biological samples, which makes it
ideal for use with convicted offender samples.
1.3 Introduction to FTA™ Paper
FTA™ paper is a special cellulose-based paper developed in the late 1980s by
Leigh Burgoyne [19] and commercialized by Whatman™ (Florham Park, NJ, a division
of GE Healthcare). FTA™ paper is used to store any biological sample that can be
applied to the filter paper, typically consisting of blood and buccal samples [10, 20-22].
In terms of forensic samples, FTA™ paper is commonly used for the long-term storage of
reference and convicted offender samples. FTA™ paper is treated with a mixture of a
base, a chelating agent, an anionic surfactant, and uric acid [10, 22, 23]. These chemicals
help capture and protect the DNA from degradation by nuclease activity, UV, bacteria
and other detrimental conditions [5, 20, 22, 24, 25]. Upon contact with denaturants, the
cells are lysed, and the DNA becomes entangled within the paper’s matrix (Figure 3) [5,
10, 20, 22, 25, 26].
Figure 3 DNA entangled in Whatman FTA™ Paper matrix [23]. Copyright © 2011 GE
Healthcare Corporation. Used under permission.
This type of treatment allows for DNA to be stored on FTA™ paper for years at
room temperature [5, 10, 20-26]. These properties of FTA™ paper helps eliminate the
requirement of refrigerated storage for biological samples, which is expensive and
requires large, specialized areas for storage [21-24, 26]. Also, use of FTA™ paper
8
prevents cross contamination between samples, even if they come in contact with each
other [20]. This means that large amounts of samples can be stored together without the
requirement for specialized storage equipment; one study even suggests using an ordinary
filing cabinet [20]. In addition, FTA™ cards are small in size at only three and a half
inches by five inches in size [10].
When using FTA™ paper for blood sample collection and storage, the liquid
blood is spotted directly on the card’s sample collection area and allowed to dry [20, 22].
When an analyst is ready to for analysis, a small disc (1.2 mm in diameter) is removed
from the bloodstain using a micro-punching tool, such as the Harris Uni-Core™ punch.
Following the removal of the disc, three to five washes are performed using a specialized
reagent remove inhibitors and contaminants [5, 21]. Potent PCR inhibitors are present in
blood samples (including heme and the anticoagulant EDTA), and they must be removed
prior to PCR amplification [15, 26]. Removal of heme can be visually observed with
FTA™ paper, as its red color also washes away [27]. If the washes are effective, they
should leave a colorless paper disc containing the purified DNA and little or no
remaining heme to inhibit amplification.
The purification reagent is then washed away with water, and the disc is then
dried. The manufacturer’s protocol then states that the disc is ready to be added directly
to a PCR amplification reaction [9, 21, 22]. A benefit of the direct addition of FTA™
paper discs to the amplification reaction is that it reduces the amount of handling by an
analyst, thereby reducing the potential for contamination [27]. However, no
quantification is performed, a deviation from the normal PCR amplification procedures
outlined by the manufacturers of STR amplification kits. These kits have been optimized
to use a narrow range of DNA amounts (i.e. 0.5-1 ηg DNA), and anything more or less
may result in a poor quality profile [9, 27]. The absence of this quantitation step is both a
benefit and a drawback of using FTA™ paper. Bypassing the quantification step saves
time and reduces the amount of sample used; however, this also introduces uncertainty in
the quality of profile to be generated [9, 27]. If the amplification procedure fails, then a
second amplification has to be done, and that comes with added cost and time.
According to the PCR amplification kit components manufacturer, no quantification is
9
necessary for successful amplification and analysis of FTA™ samples [9]. Their
literature states that a 1.2-mm disc contains between 5 and 20 ηg of DNA, and will give
reliable results [9].
Previous studies suggested that the quantity of DNA present at the center and
edge of a blood sample spotted on FTA™ paper is uniform [26]. Therefore, it has been
postulated that DNA is distributed evenly throughout a blood sample as it diffuses
through the FTA™ paper’s matrix [26]. Also, the study demonstrated that the speed of
delivery of the blood sample onto the FTA™ paper had no effect on uniformity of DNA
concentration [26]. Additionally, the study showed that there was no difference in
uniformity of DNA whether there is one point of application or multiple points, and with
no effect from different people making the applications [26]. However, Dr. Christine
Picard has found on average, using blood spotted FTA™ cards, that amplification
reactions either failed or yielded poor quality profiles in greater than 25% amplifications
in a study of 100 individuals [28].
1.4 Evaluating Profile Quality
The purpose of this study was to determine whether there was a difference in the
quality of DNA profile obtained from different punch locations from a blood spot on
FTA™ paper. The purpose of this was to demonstrate to current DNA laboratories the
optimal disc locations for the greatest probability of amplification success, therefore
enabling them to use the technology as it was intended. The number of failed reactions,
partial profiles, and concordance between individual genotypes was examined at each
locus, for all three punch locations. Furthermore, peak characteristics such as presence
and amount of minus A (-A) and stutter, average peak height in relative fluorescence
units (RFUs), heterozygote ratios, and allelic dropout were examined.
10
1.4.1 Peak Characteristics
When observing an electropherogram, good quality peaks should be sharp,
symmetric and well-defined, and easily distinguished from background noise [29]. They
should not be split, rounded, or otherwise misshapen [6, 29]. Sometimes normal peaks
may have associated biological artifacts such as –A and stutter peaks, as will be discussed
below [6, 9, 29]. Problems with the size, shape, and associated products of peaks can
lead to issues with obtaining a correct DNA genotype.
1.4.2 Concordance
Concordance failures are defined as unexpected differences in genotype at any
locus for a single individual’s FTA™ card blood sample. This is likely due to extra
peaks, missing peaks, or other abnormalities. Unusual peak characteristics, including
high percentages of –A [9], and the presence of high stutter percentages can result in
allelic drop-in, where these alleles are amplified over a predetermined threshold or are
even preferentially amplified over the true allele. In addition, heterozygote imbalance
and allelic dropout can also lead to different genotypes for the same individuals [6, 9, 29].
These issues will be discussed in detail in the following sections.
A failed amplification reaction occurs when the electropherogram does not show
peaks that can be reliably distinguished from background noise [29]. A failed reaction
may occur if insufficient DNA is present, which may have occurred if the DNA from the
punch was not correctly extracted into the PCR mixture. High concentrations of
inhibitors can also cause the amplification step to fail [14, 29]. Additionally, it is
possible that the DNA sample may have become too degraded to produce a profile;
however this is unlikely with the use of FTA™ paper under proper storage conditions.
Larger loci, such as D18S51 and FGA, are more susceptible to small changes in
the PCR conditions. For example, if the DNA sample has been degraded or has a high
concentration of inhibitors, amplification of these loci may fail while the smaller loci are
correctly amplified [9, 29]. Amplification failure of one or more loci results in a partial