Đề thi IELTS Writing test
Bạn đang xem bản rút gọn của tài liệu. Xem và tải ngay bản đầy đủ của tài liệu tại đây (106.83 KB, 2 trang )
IELTS WRITING TEST
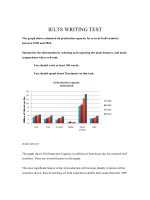
The graph shows estimated oil production capacity for several Gulf countries
between 1990 and 2010.
Summarise the information by selecting and reporting the main features, and make
comparisons where relevant.
You should write at least 150 words.
You should spend about 20 minutes on this task.
model answer:
The graph shows Oil Production Capacity in millions of barrels per day for selected Gulf
countries. There are several features in this graph.
The most significant feature is that oil production will increase sharply in almost all the
countries shown. Kuwait and Iraq are both expected to double their output between 1990
and 2010, with Kuwait's production rising from 1.8 million barrels per day (bpd) in 1990
to 3.8 in 2010. Iran will also increase its output by a slightly smaller amount. After
remaining steady at 2.5 million bpd from 1990 to 2000, the UAE's output is expected to
approach 4.0 million bpd in 2010. Only Qatar's production is predicted to fall, back to 0.8
million bpd after a slight rise in 2000.
However, the greatest increase will be from Saudi Arabia. In 1990, its output capacity at
8.5 million bpd exceeded the combined production of Iran, Iraq and Kuwait. This lead is
expected to continue with a 75% increase in production to 14.5 million bpd 2010.
In summary, while most of the countries are expected to show increases, Saudi Arabia
will maintain and strengthen its position as the major producer.