tóm tắt luận án hiệu quả kiểm soát glucose máu, cải thiện một số chỉ tiêu hóa sinh của thực phẩm chức năng chiết xuất từ lá vối - ổi - sen (voscap) trên bệnh nhân đtđ type 2 tại hà nội
Bạn đang xem bản rút gọn của tài liệu. Xem và tải ngay bản đầy đủ của tài liệu tại đây (260.73 KB, 33 trang )
MINISTRY OF EDUCATION AND TRAINING MINISSTY OF HEALTH
THE NATIONAL INSTITUTE OF NUTRITION
PHAM THI LAN ANH
EFFECTS OF VOSCAP, A FUNCTIONAL FOOD EXTRACTED
FROM CLEITOCALYX OPERCULATUS, GUAVA AND
LOTUS LEAVES ON CONTROL OF BLOOD GLUCOSEAND
SOME BIOCHEMICAL INDICATORSIN PATIENTS WITH
DIABETES TYPE 2 IN HANOI
SPECIALIZED: NUTRITION
CODE: 62.72.03.03
NUTRITION PHD THESIS SUMMARY
HA NOI, 2013
WORK TO BE DONE IN
NATIONAL INSTITUTE OF NUTRITION
=============
Scientific Advisors:
1. Pham Van Hoan Assc Prof., MD., PhD
2. Truong Tuyet Mai MD., PhD
Rapportor I:
Rapportor II:
Rapportor III:
The thesis to be defended at the National Institute
of Nutrition Training Council
The National Institute of Nutrition Ha Noi
On … Date …
Thesis can be found at:
National Library
Library of National Institute of Nutrition
ABBREVIATIONS LIST
ADA: American Diabetes Association
ALT: Alanine transaminase
AST: Aspartate transaminase
BMI: Body Mass Index
CTV: Collaborator.
ĐTĐ: Diabetes
GSV: Supervisor.
GI: Glycemic Index
Hb: Hemoglobin.
HOMA-Insulin :Homeostasis Model of Assessment
Insulin Resistance
IAUC: Incremental Area Under Curve
IC Inhibitory Concentration
NGSP: National Glyco-hemoglobin Standardization Progam
JNC VII: Joint National Committee 7
THA: Hypertension.
TP.HCM: Ho Chi Minh City
VOSCAP: Cleitocalyx operculatus, Guava, Lotus capsule
WHO: World Health Organization
2
INTRODUCTION
Diabetes mellitus type 2 is a non-communicable chronic
disease related to nutrition and lifestyle, growing very fast in many
countries around the world. Diabetes is a group of metabolic diseases
characterized by chronic hyperglycaemia as a result of the lack or
reduced activity of insulin or a combination of both.
In 2010, it was estimated that the world has about 285
million adults with diabetes aged 20-79, the number continued to
grow 154% from 2010 to 2012. In 2013 study of Endocrinology
Hospital showed the prevalence of diabetes was 5.7% (7.2% in the
South West, lowest was in the Central Highlands 3.8%). The rate of
glucose intolerance also increased quickly from 7.7% in 2002 to
nearly 12.8% in 2012.
Postprandial blood glucose control in patients with diabetes
type 2, in addition to weight loss, exercise and diet changes, there is a
need to coordinate with diabetes medications, including inhibitors of
α-glucosidase. α-glucosidase inhibitors slow the digestion of double
track glucose absorption, lead to reduced revenues, thereby slowing
the rise of blood glucose after eating. Polyphenols composition of
plant have been scientifically demonstrated the ability to inhibit α-
glucosidase in the intestinal epithelial cells, helping to limit
postprandial hyperglycaemia. Polyphenols also work to improve the
activity and insulin secretion, reduce blood fat. VOSCAP
3
combination product is extracted from the leaves of robusta, guava
and lotus has only been tested effectively control blood glucose in
healthy and diabetic rats. This is the next step, VOSCAP product has
been tested on both healthy people and people with diabetes type 2.
STUDYOBJECTIVES:
1. To identify the control of postprandial blood glucose of
VOSCAP product on healthy and in patients with diabetes type
2.
2. To assess the effects of VOSCAP product on blood glucose
control, HbA1c, Insulin Resistance in patients with diabetes type
2 after 12 weeks - trial and the changes in blood glucose 6 weeks
after discontinuation of the trial.
3. To assess the changes of some other indicators related
biochemical (blood fat and uric acid) and other index (blood
pressure, the use of pharmacy diabetes treatment) in patients with
diabetes type 2 after 12 weeks - trail of VOSCAP product and the
changes in these indicators 6 weeks after discontinuation of the
trial.
THE NEW CONTRIBUTIONS OF THE THESIS
1. This is a study of Vietnam's first test using VOSCAP product
derived from plant extracts of cleitocalyx operculatus, lotus leaves to
assess the effect of blood glucose control in both healthy volunteers
and patients with diabetes type 2.
2. This is a long-term clinical trials, not just taking VOSCAP product
during 12 weeks to evaluate the effectiveness of blood glucose
control in healthy volunteers and patients with diabetes type 2, but
4
also continue to monitor for another 6 weeks later the end of the test
to assess the ability to maintain the efficiency of the product.
5
CHAPTER 1: OVERVIEW
1.1. The situation of diabetes in the world and Vietnam:
1.1.1. The situation of diabetes in the world:
In recent years, disease patterns have changed, the infections tend to
a reduction, in contrast to non-communicable diseases such as
cardiovascular, psychiatric, cancer especially diabetes and
metabolic disorders are increasing. In the late 20th century and early
21st century, the WHO experts had predicted, "The 21st century will
be the century of the Endocrine diseases and metabolic disorders,
especially diabetes a non-communicable disease would be the fastest
growing one”.
The number of people with diabetes worldwide increased
from 171 million in 2000 to 194 million in 2003, jumped to 246
million in 2006 and forecasted to increase to 380-399 million in
2025. Of which, in the developed countries, the disease rate increased
42% and that in the developing countries increased 170%. Among
people with diabetes, the diabetes type 2 mainly accounts for about
85-95%. Diabetes is ranking the 4th in cause of death in the world,
causing reduced 5 to 10 years of life expectancy, the leading cause of
blindness and end-stage renal failure as well as the leading cause of
amputation not due to injury. Every 10 seconds, there is a person dies
due to diabetes and its complications, every 30 seconds there is a
complication of diabetes foot amputation. The cost of treatment of
diabetes worldwide in 2007 was estimated U.S. $ 232 trillion,
projected to grow to 302 trillion in 2025.
6
Diabetes increases fastest in countries with economic rapid
growth like India, China. The rate of diabetes in the Southeast Asia
countries is also relatively high. In the Philippines, in 2008 the
diabetes rate was 7.2%, impaired glucose tolerance was 6.5% and
fasting blood glucose disorders 2.1%; Diabetes rate in urban areas
was 8.3% and rural areas was 5.8%. In 2008, the diabetes rate in
Indonesia was 5.7%, the rate of reduced glucose tolerance was 10.2%
in the age group above 15 years old.
According to Wilds et al., the rate of diabetes of all ages
around the world in 2000 increased to 2.8% and in 2030 increase to
4.4% (171 million in 2000 and 366 million in 2030). A research
conducted by Shaw JE et al showed the diabetes rates worldwide
among adults 20-79 was 6.4% (285 million) and will increase to
7.7% (439 million people) by the year 2030. There are 69% of adults
with diabetes in developing countries and 20% in developed
countries. A study of David R et al 2011 showed that: In 2011, there
were 366 million people with diabetes aged 20-79, this figure
expected to rise to 552 million by 2030.
1.1.1. Diabetes situation in Vietnam:
In Vietnam, diabetes has tended to increase over time and the
level of economic development and urbanization. In 1991, Mai The
Trach et al. investigated in 4912 people in Hanoi, by the standards of
the World Health organization (WHO 1985), the prevalence of
diabetes in subjects over 15 years old was 1.2%, of which 1.44% in
the urban and 0.63% in the suburbs; The percentage of blood glucose
7
intolerance was 1.6%. In 1993, Mai The Trach et al. surveyed on
5,416 people over age 15 or older in the HCM city, the results
showed diabetes rate was 2.52%.
In 2001, the epidemiological investigation on diabetes
applied new international standard with the help of leading experts
from WHO, conducted in 4 cities: Hanoi, Hai Phong, Da Nang and
Ho Chi Minh City. Result of this investigation is really alarm bells
about the situation of non-communicable diseases in general and
diabetes in particular in Vietnam, the prevalence of diabetes in 4 big
cities of Hanoi, Ho Chi Minh City, Hai Phong and Da Nang in
subjects aged 30-64 was 4.9%, glucose intolerance rate was 5.9%,
the rate of fasting blood glucose disorder was 2.8%, the rate of
subjects with risk factors for diabetes was 38.5%; It is so worried that
44% of the people with diabetes has not been diagnosed and given
any preventive and treatment guidelines.
In 2002, Endocrinology Hospital conducted a national survey
of diabetes risk factors on over 9,122 people in 90 wards, ò which
1833 subjects in the Central Highlands, 2722 in the delta region,
2,759 in the cities, 45% of male and 55% of female. The results
showed people with diabetes type 2 nearly tripled over the last 10
years; The rate of diabetes type 2 aged 30-69 was about 5.7%; And
the rate in the urban and industrial zones was higher, 7,0% - 10%.
In 2013, the study of Endocrinology Hospital showed that the
prevalence of diabetes was 5.7% (the highest was in the South West
at 7.2%, the lowest was 3.8% in the Highland). The rate of glucose
8
intolerance also increased quickly from 7.7% in 2002 to 12.8% in
2012. According to this study, people over age 45 are at risk for
diabetes type 24 times higher than those under 45 years of age.
People with high blood pressure are at diabetes risk for more than 3
times the other. People with large waist are at diabetes risk for 2.6
times higher.
1.1.3. The consequences of diabetes mellitus type 2:
Diabetes is a serious disease threat to life and cause many
complications. According to the International Diabetes Association,
diabetes is the leading cause of death ranking the 4th or 5th in the
developed countries and is being considered epidemic in developing
countries. Approximately 50% of diabetic patients with
complications such as coronary heart disease, heart attack, stroke,
neuropathy, cuts amputation, kidney failure, blindness caused by
diabetes. These complications result in disability and reduced life
expectancy. Diabetes leads to serious consequences for the health
and economy of the entire society.
1.2. Diagnosis of diabetes type 2.
According to the ADA, the diagnostic criterias for diabetes
since 2010 are:
- HbA1c ≥ 6.5%.
- Fasting blood glucose level ≥ 7.0 mmol / l (≥ 126mg/dl).
- Blood glucose level ≥ 11.1 mmol / l (200mg/dl) at the time of 2
hours after glucose tolerance test orally.
9
- There are symptoms of diabetes (clinical) blood glucose level at any
point ≥ 11.1 mmol / l (200mg/dl).
1.3. Treatment of diabetes type 2:
The goal of diabetes treatment is to reduce or loss the clinical
symptoms of hyperglycaemia, to maintain blood glucose values as
close to normal as possible, but do not cause hypoglycaemia and
prevent acute and chronic complications, maintain your ideal weight
and improve the quality of life for patients. To achieve this goal,
diabetes treatments will include methods of taking and not taking
medications/ drugs. Not taking medications is a method that adjusts
the lifestyle, including reasonable diet and physical activity.
Besides the use of pharmaceutical medications/ drugs, many
herbs have been recommended to use for patients with diabetes, with
the purpose of supporting or alternative treatment. Some polyphenols
of plant have the ability to temporarily inhibit activity of metabolic
enzyme of glucose which reduces the postprandial hyperglycaemia.
Currently, in addition to single-use plants, studies in India, China,
South Korea and some other countries have demonstrated the role of
combinations of herbs (Polyherbal Formulation) to increase the
effectiveness of diabetes type 2 treatments in laboratory, diabetic
mice and in patients with diabetes. Some herbs products proved to
have the advantage of combined different active extracted groups,
reducing blood glucose with a synergistic mechanism, providing
better therapeutic efficacy with an excellent safety profile.
10
Robusta, guava and lotus leaves have been known to be the
familiar plants, long used in Vietnam with more experience in folk
remedies and no toxicity. Results of initial studies of VOS mixture
extracted from leaves of robusta, guava, lotus leaves which contain
mainly polyphenol components have proven their safety with the
ability to control blood glucose in diabetic rats.
CHAPTER 2: SUBJECTS AND METHODS
2.1. Study design:
This is a pre and post clinical trial with a control group.
2.2. Research content:
2.2.1. Phase 1: Assessment of postprandial blood glucose control of
VOSCAP product. 2 tests were conducted on two different subjects:
healthy volunteer individuals and patients with diabetes type 2.
- Conducted in two different days: the first day subjects drink white
water and a formulated meal (control day), in the second day (trial
day - 7 days after) the subjects have been taken VOSCAP tablets and
eat a formulated meal as in the first day.
2.2.1. Phase 2: Assessing the effectiveness of blood glucose control
in patients with long-term type 2 diabetes.
This is a clinical trial in subjects with diabetes patients
- Tested effective intervention after 12 weeks.
- Assessing the maintained effectiveness of VOSCAP 6 weeks after
intervention.
2.2. Object, location, time studies:
Object selection criterias:
• For patients with diabetes type 2:
11
- Voluntary to participate in the study.
- Fasting blood glucose an average of ≥ 7 to <8 mmol / L, and
HbA1c <8.0%.
- Aged 40-70.
- BMI from 18.5 to 25.0.
Exclusion criterias:
- Diabetes mellitus type 1.
- Kidney or liver disease, chronic /acute digestive diseases.
- Deaf, dumb, psychosis, confusion.
- Subjects must use insulin, α-glucosidase inhibitors during the study
period.
Location and time study:
Location: National Institute of Nutrition
Time: June 6/2011 to March 3/2012
2.4. Sample size and sampling method
2.4.1. Sample sizes and sampling methods diabetes patients:
Sample sizes and sampling methods for diabetic patients:
Applying the formula:
n =2.
2
21
]
)(
[
µµ
σβα
−
+
ZZ
Among them:
n is the sample size needed for accuracy 95%, Zα = 1.96, Zβ = 1.28,
sample power: 90%, μ1-μ2 is the average difference of the desired
target glucose fasting blood between the two groups at the end of the
12
studyperiod, μ1-μ2=0,6mmol/L; σ=0,7mmol/L
Calculated n = 30, the estimated dropout rate is 20%, so the total
number of participants is 36.
For the two groups: 36 x 2 = 72 subjects.
Selection of subjects with diabetes type 2:
- Make a list and preliminary screening diabetic members in the club.
Choose the 72 subjects eligible for selection. Make a list of 72
subjects eligible and agreed to participate in taking VOS tablets for
12 weeks and continue to be monitored for 6 weeks after intervention
(phase 2). Among 72 selected diabetic patients, 50 patients had been
randomly selected to participate in postprandial blood glucose testing
(Phase 1).
Sampling healthy subjects:
Sampling: selected 50 healthy voluntary students by convenient
method.
2.5. Research steps
2.5.1. Phase 1: Testing blood glucose change after eating.
2.5.1.1. Preparation of formulated meals with a total energy of 250
kcal:
The composition of the diet included:
- 01 bowls of scream rice: 55 gams of rice (160 kcal)
- 01 table spoons 35 gams minced lean meat + 4 gams fat + 1 gam
meat soup (90 kcal).
2.5.1.2. Conducting trial 1 and 2 to assess postprandial blood
glucose control of VOSCAP product
13
Each trial was conducted on 50 patients in 2 different days:
in the first day the subjects just drinking plain water (control day), in
the second day, 7 day later, they took VOSCAP (intervention day).
The participants were asked to fast for at least 8 hours before the
finger blood sample was taken (T0), then drunk water or VOSCAP
and ate 1 formulated meal within 8-10 minutes. The finger blood
samples then were taken after 15, 30, 60, 90 and 120 minutes after
eating. Blood glucose level was measured by Accucheck – a
Japanese machine.
2.5.2. Phase 2: Evaluation of VOSCAP product on blood glucose
control and some other biochemical and health indicators in
patients with diabetes type 2
Divided the subjects into 2 groups: control and intervention one.
Subjects of interventions group were taken 2 VOSCAP capsules
twice a day, 10-15 minutes before eating. Those in the control group,
due to no placebo used, they were continuously taken
medication/drugs for diabetes treatment and to be closely monitored.
Both groups had received advisory diet and exercise regime at home
based on each patient actual diet. All selected indicators of the 2
groups’ subjects were evaluated at time point T0, T6, T12, and T18.
2.6. Methods of data collection and evaluation criteria
2.6.1. Data collection in phase 1
- General information were gathered by direct interviewing subjects,
including age, gender, occupation, weight, height, blood pressure,
14
- Blood glucose concentration in mmol / L at different points were
determined before eating, 15, 30, 60, 90 and 120 minutes after eating
- The area under the curve of increased blood glucose was
determined.
2.6.2. Data collection Phase 2
General information: Direct interviews by the doctors with pre-
designed questionnaire to collect general information,
information related to living habits, diet, current health status,
disease history,
Food consumption and food frequency.
Anthropometric indicators: height, weight.
Biochemical indicators: blood glucose, HbA1c, cholesterol,
triglycerides, c-HCL, Creatinine, AST / ALT, uric acid, insulin.
2.7. The error and bias control measures
Anthropometric data were collected by two investigators
(interviewer) of the National Institute of Nutrition, who are very
technically proficiency and skill. The blood samples were taken
in the morning by technicians who were experienced to minimize
vein broken and erythrocyte rupture.
2.8. Analysis and data processing
The survey data are cleaned, then double entered using EPI DATA.
Data analysis using SPSS software 16.0. The data on the area under
the curve increased (IAUC) analysis by Frank Schoonjans MedCalc
software. Data on diet were checked and double entered and
processed by Access progam.
2.9. Ethical issues of the research
Research protocol and ethical issues were adopted by the Scientific
15
Council and Institutional Review Board (IRB) of the National
Institute of Nutrition before the research activities conducted.
CHAPTER 3: RESEARCH RESULTS
3.1. The effect of VOSCAP product in limiting postprandial
hyperglycaemia
Table 3.2 Postprandial blood glucose concentrations after different
times and area under the curve of increased blood glucose of the
healthy volunteers
Indicator Time point
Control day
(n=45;
TB ± SD)
VOSCAP taken day
(n=45;
TB ± SD)
Blood
Glucose
(mmol/L)
At the
beginning
5,30 ± 0,49 5,21 ± 0,34
After 15
minutes
8,12 ± 1,07 6,67 ± 0,90 *
After 30
minutes
8,92 ± 1,04 8,30 ± 0,92 **
After 60
minutes
7,12 ± 1,13 7,13 ± 0,92
After 90
minutes
5,83 ± 0,71 5,84 ± 0,68
After 120
minutes
5,11 ± 0,49 5,24 ± 0,63
IAUC
0-120
minutes
214,2± 105,7 168,4 ± 94,2 *
* p <0.01, ** p <0.05 compared with control day, t-test.
Postprandial blood glucose in the day of VOSCAP taken was
significantly lower than that of the day without VOSCAP at the time
point of 15 minutes (p<0.01) and 30 minutes (p<0.05). The area
16
under the curve of increased blood glucose (IAUC) of VOSCAP day
was significant lower compared to that of the control day (p<0.05).
Table 3.4. Blood glucose concentrations after different times and
area under the curve values of the 2 trial days, with VOSCAP and
without VOSCAP of the patients with diabetes type 2.
Indicator Time point
Control day
(n=45;
TB ± SD)
VOSCAP taken day
(n=45;
TB ± SD)
Blood
Glucose
(mmol/L)
At the
beginning
7,75 ± 1,27 7,84 ± 0,92
After 15
minutes
11,30 ± 1,75 10,54 ± 1,52*
After 30
minutes
13,58 ± 2,04 12,25 ± 1,95*
After 60
minutes
15,28 ± 3,36 14,14 ± 2,15
After 90
minutes
12,95 ± 3,12 12,32 ± 2,41
After 120
minutes
10,33 ± 2,46 9,62 ± 1,99
IAUC
0-120
minutes
605,0 ± 160,6 489,8 ± 129,8**
* p <0.05, ** p <0,001 compared with control day, t-test.
Postprandial blood glucose in the day with VOSCAP found
to be lower at 15 minutes (p<0.05) and 30 minutes (p<0.05). The
value of IAUC in the day with VOSCAP was significant lower
comparing to that of the control day (p<0.001).
17
3.2. The effect of VOSCAP on the indicators related to glucose
metabolism
3.2.1. The effect of VOSCAP after 12 weeks of trial:
Table 3.13 Blood glucose, insulin and HbA1c changes, Mean ± SD
Indicator Time point Control group VOSCAP group
Blood
Glucose
(mmol/L)
T0 8,1 ± 0,8 7,9 ± 0,9
T6 8,1 ± 2,1 7,7 ± 1,7
T12 7,7 ± 1,5 6,7 ± 1,4*,,
#
T12 - T0 -0,4 ± 1,4 -1,2 ± 1,1*
Insulin
(pmol/L)
T0 72 ± 35 68 ± 32
T12 76 ± 36 68 ± 31
T12 - T0 3,8 ± 9,5 0,3 ± 4,5
HbA1c (%)
T0 6,8 ± 0,8 6,8 ± 0,7
T12 6,8 ± 1,1 6,4 ± 0,8
##
T12 - T0 -0,02 ± 0,8 -0,4 ± 0,6
* p<0.01 compared with control group, t-test.
#
p<0.05,
##
p<0,001, compared with T0 in the same group, paired t-test.
After 12 weeks of testing, it was found blood glucose levels
decreased in both groups. However, the reduction in blood glucose of
VOSCAP group was statistically significant compared with that in
the control group and compared with blood glucose at T0 in the same
group (p<0.01 and p<0.05).
Similarly, reductions in HbA1c of VOSCAP group was
statistically significant at T12 compared with T0 (p<0.001). There
was no significant difference of insulin index between the 2 groups.
18
Table 3.14. Percentage of patients with blood glucose level ≤ 6.7
mmol / L and HbA1c ≤ 6.5% after 12 weeks of trial
Indicator Time point
Control
group
VOSCAP
group
Blood
Glucose
≤6,7
mmol/L
T6 8,3% 12,5%
T12 27,8% 53,8%*
Effective Index (%) 70,1 76,8
HbA1c ≤
6,5%
T0 38,9% 37,5%
T12 50,0% 56,4%
Effective Index (%) 22,2 33,5
True Effective Index
(%)
11,3
*p<0.05,
χ
2 test.
There was an higher increase in the proportion of patients
with blood glucose ≤ 6.7 mmol / L in VOSCAP group compared with
the control group, the difference was statistically significant
(p<0,05). The true effective index for blood glucose was 6.7% and
for HbA1c 11.3%.
Table 3.15. The changes of in insulin resistance index (HOMA-IR)
Indicator Time point
Control
group
VOSCAP
group
HOMA-IR
index
(mean±SD)
T0 1,77 ± 0,81 1,70 ± 0,89
T12 1,82 ± 0,92 1,41 ± 0,74*,
#
T12-T0 0,03 ±0,41 -0,30±0,33*
HOMA-IR T0 35 (89,7) 35 (87,5)
19
Indicator Time point
Control
group
VOSCAP
group
<2.7 (%)
T12 29 (80,6) 36 (92,3)
@
Effective Index
(%)
10,1 -5,4
True Effective
Index (%)
15,5
* p<0.01, compared with the control group, t-test;
#
p<0.05 compared with
the same group before, paired t-test; @ p<0.01 compared with control
group,
χ
2 test.
After 12 weeks of intervention, HOMA-IR index in
VOSCAP group was significantly reduced compared with initial time
and statistically significant lower compared with the control group (p
<0.01).
Table 3.16. The change in concentration of Cholesterol Triglyceride
and HDL-C (Mean ± SD)
Indicator Time point
Control
group
VOSCAP
group
Cholesterol
(mmol/L)
T0 5,3 ± 0,8 5,1 ± 0,9
T6 5,3 ± 1,0 5,3 ± 1,0
T12 5,2 ± 1,0 4,9 ± 0,9
T12 - T0 -0,15 ± 0,8 -0,17 ± 0,6
Triglyceride T0 2,2 ± 1,2 2,0 ± 1,1
20
(mmol/L)
T6 2,2 ± 1,7 2,1 ± 1,0
T12 2,0 ± 1,2 2,0 ± 1,0
T12 - T0 -0,18 ± 1,5 -0,005 ± 1,05
HDL-C
(mmol/L)
T0 1,1 ± 0,26 1,1 ± 0,27
T6 1 ± 0,24 1 ± 0,26
T12 1,1 ± 0,27 1,1 ± 0,32
T12 - T0 -0,002 ± 0,2 -0,04 ± 0,2
Cholesterol, triglyceride and HDL-C did not differ between
the 2 groups before and after the intervention.
Table 3.18. The change in concentration of AST / ALT, creatinine,
serum uric acid (Mean ± SD).
Indicator Time point Control group VOSCAP group
AST (U/L)
T0 24 ± 16 25 ± 10
T6 28 ± 14 25 ± 8,3
T12 28 ± 14 26 ± 7,3
T12 - T0 3,9 ± 10,9 0,7 ± 6,9
ALT (U/L)
T0 31 ± 24 26 ± 14
T6 29 ± 21 25 ± 12
T12 33 ± 20 26 ± 10
T12 - T0 2,2 ± 14,7 -0,18 ± 9,5
Creatinin
(µmol/L)
T0 90 ± 23 92 ± 21
T6 112 ± 24
98 ± 21
##
T12 97 ± 19 90 ± 17
T12 - T0 6,9± 16,9
-2,7 ± 10,7
#
Acid Uric
(µmol/L)
T0 367 ± 105 328 ± 88
T6 359 ± 112 329± 80
T12 31 0± 97 319± 70
21
Indicator Time point Control group VOSCAP group
T12 -T0 -57,5 ± 54,1
-9,3 ± 78,7
###
#
p <0.05,
#
#
p <0.01,
#
#
#
p <0.001, compared with control group, Man-
Whitney test.
After 12 weeks of trial, the concentration of AST, ALT of those
taking VOSCAP did not change at each stage, while that in the
control group increased but not significant. Creatinine in the
VOSCAP group was not change, while it was increased in the control
group. The creatinine difference between the 2 groups at T12 was
significantly (p<0,01). Uric acid levels in the control group found
statistically significant reduced compared with in those taking
VOSCAP.
3.3. Ability to maintain effectiveness of blood glucose control of
VOSCA product
22
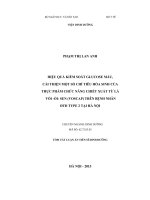
Hình 3.3 Changes in blood glucose during testing process T0-T12
and after finishing the test, T14-T18
After stopping the test, blood glucose in the control group at T16
and T18 increased almost back to the beginning, even in those taking
VOSCAP, blood glucose at T14 (7.13 mmol / l) remained close to
the level of blood glucose at T12 (6.7 mmol / l), only began to
increase at T16 and T18 to elevated blood glucose levels over the test
period started T0.
CHAPTER4:DISCUSSION
4.1. Effective control of postprandial blood glucose of VOSCAP
4.1.1. The efficacy to control postprandial blood glucose of the
VOSCAP product in healthy adults
Results of clinical trial on postprandial blood glucose in
healthy adults showed that, blood glucose levels were not increased
in VOSCAP day as that in the control one. The differences found to
23
be statistically significant at 15 minutes and 30 minutes after eating.
After 60 and 90 minutes, although the blood glucose levels in the
VOSCAP day were lower than that in non-VOSCAP day, the
difference found not to be statistically significant. Thus, the ability to
limit postprandial hyperglycemia of VOSCAP is most apparent only
at the point of 15 minutes and 30 minutes. The value of area under
the curve of increased postprandial blood glucose in the VOSCAP
day had been significantly lower that in the control day. This result is
similar to studies of Deguchi et al on guava leaf tea and Truong
Tuyet Mai on robusta, in terms of limiting the increase of
postprandial blood glucose.
4.1.2. The effect to control postprandial blood glucose of
VOSCAP product in patients with diabetes type 2:
The results of the clinical trial on postprandial blood
glucose control of VOSCAP in patients with diabetes type 2
showed that blood glucose levels did not rise much in the
VOSCAP day compared with control one. The differences found
to be statistically significant at the 15 minutes and 30 minutes
points. At 60 and 90 minutes points after eating, although blood
glucose levels in VOSCAP day lower than non-VOSCAP day, the
difference found not to be statistically significant. Thus, the
ability of limiting the increase of blood glucose is most apparent
only after 15 minutes and 30 minutes after. The value of area
under the curve of increased blood glucose in the VOSCAP day
was significantly lower that in the control day (489.8 the
24