nghiên cứu sự biến đổi một số chỉ số chống oxy hóa ở người tiếp xúc nghề nghiệp với chì vô cơ, tác dụng bảo vệ của sâm ngọc linh trên động vật thực nghiệm bản tóm tắt tiếng anh
Bạn đang xem bản rút gọn của tài liệu. Xem và tải ngay bản đầy đủ của tài liệu tại đây (239.59 KB, 26 trang )
LIST OF LETTERS, SYMBOLS HAVE ABBREVIATED
IN THESIS
TT Abbreviation All letters
1. ADN Acid desoxyribonucleic
2. ALA Acid aminolevulinic
3. ALAD Acid aminolevulinic dehydratase
4. ALT Alanin transaminase
5. AST Aspartat transaminase
6. GGT Gamma glutamyl transferase
7. GPx Glutathion peroxidase
8. GR Glutathion reductase
9. LO
•
Gốc alkoxyl
10. LOO
•
Gốc peroxyl
11. LPO Lipid hydroperoxides
12. MCH Mean corpuscular volume
13. MCHC Mean corpuscular hemoglobin concenrtration
14. MDA Malonyl dialdehyd
15. ppm Parts per million
16. G Group
17. ROS Reactive oxygen species
18. TAS Total antioxydant status
2
INTRODUCTION
When infiltrating into body, lead causes a number of
diversified and complicated injuries on most organs and
organizations. The mechanism of causing diseases of lead is
inhibiting and linking with enzymes, biological substances containing
-SH group but not satisfactorily explaining the systematically lead-
induced injuries. Some studies shown that lead entering into the body
can stimulate the generation of free radicals and reduce the function
of the system against free radicals. To clarify this matter, it is
necessary to evaluate changes of antioxidant enzymes in the body.
Panax vietnamensis biomass is believed to have capacity of
preventing oxidation, protecting the body from oxidative stress. The
application and assessment of the protection effectiveness of Panax
vietnamensis biomass for objects exposing to lead is a new issue
which has not been studied in reality. Based on that fact, we carry out
the theme “Study the change of some oxidation indexes of people
occupationally exposing to inorganic lead, the protective effects
of biomass Panax vietnamensis on experimental animals”.
1. Objectives:
- Specify the change of some antioxidant indexes and blood
biochemistry of people occupationally exposing to inorganic lead and
experimental animals.
- Assess the protective effects of Panax vietnamensis
biomass on animals infected semi-chronic with lead acetate.
2. Necessity:
Lead is an irreplaceable raw material in many industries. The
number of people exposing to lead not only reduces but also tends to
increase despite the fact that lead triggers to several adverse effects
on human’s health. When entering into the body, lead can cause
occupational exposure and oxidative stress.
Nowadays, specific treatment drugs are used to treat lead
poisoning but their effects are not as expected especially in chronic
poisoning. Panax vietnamensis biomass is a preparation having
3
antioxidant and protective effects on the body. It can reduce harms of lead
causing to the body. From this fact, we conducted to study this theme.
3. New contributions of the thesis:
Lead is harmful to the body, causing oxidative stress which
leads to the alteration of antioxidant indexes. The thesis studied quite
comprehensively the antioxidant indexes of workers directly
exposing to inorganic lead and on experimental animals.
The thesis assessed the protective effects of Panax vietnamensis
biomass on animals semichronic poisoned with lead acetate.
By dint of the research results, factories, enterprises using
lead in production enhance measures to protect heath of labors as
well as study more to choose Panax vietnamensis biomass to protect
workers occupationally exposing to lead.
4. Arrangement of the thesis:
The thesis includes 137 pages consisting of 2 pages of
introduction, 38 pages of general view, 20 pages of research objects
and methods, 41 pages of research results, 33 pages of discussion, 2
pages of conclusion, 1 page of recommendation.
The thesis has 37 tables, 21 charts, 5 diagrams, and 161
references in which 27 in Vietnamese and 137 in English.
CHAPTER 1 - GENERAL VIEW
1.1. Free radicals and system against the free radicals of the body
1.1.1. Definition of free radicals and types of Reactive Oxygen
Species (ROS)
Free radicals are atoms or group of atoms whose outer layer
contains unpaired electrons (single electrons). Free radicals are
frequently unstable in both energy and kinematics and tend to reach
to very short stability and longevity, strong reactivity.
ROS are free radicals, active ions, and molecules containing
oxygen atoms and are capable of generating free radicals or activated
by free radicals.
1.1.2. Oxidative stress
4
Oxidative stress is an imbalance between the formation of
reactive oxygen species and the antioxidant systems. Oxidative stress
may be resulted from the decline of the antioxidant system,
increasing formation of reactive oxygen species and the lack of
ability to repair injuries caused by oxidation in the body.
1.1.3. The formation process of free radicals.
The free radicals in the body is created from cellular
respiration chain, radioactive agents, inflammatory syndrome, the
phenomenon of ischemia - reperfusion, xenobiotic agents and some
other factors. Xenobiotic substances including lead when entering
into the body will be converted and xenobiotic structure significantly
altered, they can add more -OH,-NH2,-SH,-COOH groups to form
water-soluble substances and continue connecting with substances,
excreting from the body; at the same time generating ROS such as
•
2
O
,
1
O
2,
etc which have high toxicity causing oxidative stress. The
antioxidants in the body such as SOD, catalase, protein SH groups,
ceruloplasmin, etc in erythrocytes and liver are very sensitive to the
xenobiotic.
1.1.4. Antioxidant system in the body.
1.1.4.1. Ezymatic antioxidant system.
- Superoxid dismutase (SOD, EC 1.15.1.1) is an
antioxidant enzyme containing metal of oxidoreductase type and it
catalyzes the reaction to convert superoxid to O
2
and H
2
O
2
:
2
•
2
O
+ 2H
+
→
SOD
H
2
O
2
+ O
2
The higher activity SOD has, the less activity O
2
•
has. SOD SOD
is an very basic antioxidant that lowers the concentration of precursor
•
2
O
from which all other reactive oxygen species are produced.
- Catalase (CAT, EC 1.15.1.1) is an enzyme catalyxing the
reaction of H
2
O
2
decompostion
H
2
O
2
→
Catalase
H
2
O + ½ O
2
5
- Peroxidase (EC 1.11.1.7) is a group of enzyems catalyzing
redox reaction belong to oxidoreductase catalyzing the following reaction.
AH
2
+ H
2
O
2
→
peroxidase
A + 2H
2
O
- Glutathion peroxidase (GPx) (E C.1.11.1.9) is an enzyme
catalyzing reactions to remove peroxides which activate in the tissues
and erythrocyte when the concentration of H2O2 is low.
GPx
ROOH + 2GSH GSSG + ROH + H
2
O
1.1.4.2. Non-enzymatic antioxidant system
It consists of three main groups: group of polyphenols, iron
and copper ligands and thiols. The gruops can exist both inside and
outside cells. This system support for te enzymatic antioxidant system.
- Total antioxidant status (TAS) is the total antioxidant status
of plasma basing on the ability of inhibiting and combating the oxidants of
antioxidants including all the antioxidants in the body wich include a lot of
protection systems to prevent from the adverse effects of free radicals and
peroxide phenomenon for the body.
1.2. The Mechanism of effect, capacity of generating free
radicals, inhibiting antioxidant system of inorganic lead
1.2.1. Mechanisms of common effects
Lead entering into the body will inhibit and connect
selectively with enzyme system, biomolecular having -SH group and
cause several important biochemical disorders of cells.
1.2.2. Mechanism of generating free radicals, inhibiting
antioxidant system of inorganic lead
Inorganic Lead induces to oxidative stress by two opposing
mechanisms closely linking to each other: stimulating the formation
of free radicals and reducing the antioxidant ability of the body.
- Stimulating the generation of free radicals: free radicals are
formed from four main sources such as (1) the enolization and
oxidation process of aminolevulinic acid (ALA), (2) the self-
6
oxidation of oxyhemoglobin, (3) the enhancement of activity of
oxidative enzymes, (4) the oxidation of nitric oxide by free radicals.
- Inhibiting the antioxidant system: Lead associates with -SH
groups to reduce level of GSH, GR, G6PD activity and GSH/GSSH
ratio. Lead reduces the absorption of microquantity elements such as
selenium, Cu, Zn, therefore reducing the activity of antioxidant enzymes
such as GPx, SOD, CAT and increasing reactivity of the membranes to
oxidative attacks.
1.3. Antioxidant effects of biomass Panax vietnamensis
1.3.1. Chemical composition
Panax vietnamensis biomass consists of main chemical
ingredients such as saponin whose total content is 2.01%. In which,
the content of ginsennosids such as Rg1, Rb1, Rg1 is 0.31%, 0.36%,
0.15% respectively.
1.3.2. Antioxidant effects
Total saponin and active element MR-2 in SNL antioxidant
have antioxidant effects. Ginseng extracts can inhibit the formation
of OH • radicals from Fenton reaction by the mechanism of
complexion with metal ions as well as directly cleanup OH • radicals.
They have antioxidant effects in both the oil and water environment
and are able to participate in all stages of the POL process. Some
authors believed that antioxidant effects of SNL are by dint of the
mineral components of ginseng.
CHAPTER 2- RESEARCH OBJECTS AND METHODS
2.1. Research objects
2.1.1. Study labor environment
Study on characteristics of microclimate and lead level in the
air in labor environment.
2.1.2. Study on humans
- Objects: 165 workers working in primary detonating
explosives (Zx factory); battery assembly workshop, plate electrode
workshop (Vinh Phu Battery Joint Stock Company) directly exposing
to lead, are divided into 2 groups:
7
+ Group I (55 workers) has blood lead level ≤ 10 µg/dL
+ Group II (110 workers) has blood lead level > 10 µg/dL.
+ Group II is divided into 2 small groups: Group IIA (86
workers): blood lead level from 10 µg/dL to < 40 µg/dL and group IIB
(24 workers): blood lead level ≥ 40 µg/dL.
- Criteria to choose:
+ Time to work in the environment directly exposing to lead
is ≥ 5 năm, and continuous. Not expose to other toxic elements. And
participate in the study voluntarily.
+ Exclusion criteria: acute exacerbations of chronic diseases,
malignant diseases, diabetes mellitus, hypertension, kidney diseases,
acute and chronic hepatitis, liver failure and autoimmune disease.
- Choose all workers in the criteria and not in exclusion
criteria into the research.
2.1.3. Study on animals
* Experimental animals: 360 male white house-mice, 20 -
25 gram, divided into 3 lots.
- Control lot (108 mice) (lot 1).
- Lot infected lead acetate (108 mice) (lot 2).
- Lot infected lead acetate and drinking/with SNLSK to
protect (108 mice) (lot 3).
- 36 mice were killed and taken blood to experiment
immediately prior to testing.
* Research materials.
Lead acetate solution is provided by Division of Technical
Equipment, Vietnam Military Medical Academy (manufactured by
Lucheng Qinda plastic injection Factory- China). Panax vietnamensis
biomass is newly manufactured and provided by the Center for
Research and Application of Military Medicine, Vietnam Military
Medical Academy. Research tools are full enough for the experiment.
2.2. Research methods.
2.2.1. Research methods of labor environment. Survey microclimate
and lead dust concentration in labor environment.
8
2.2.2. Research methods on workers
- Research design: descriptive and cross-sectional
- Research targets and techniques.
+ Test lead concentration in blood
+ Test peripheral blood formula
+ Test blood biochemistry indexes
+ Identify content of free –SH group in blood, activity of
plasma peroxidase, erythrocyte superoxide dismutase (SOD), activity
of erythrocyte glutathion peroxidase (GPx), plasma malondialdehyde
(MDA), plasma total antioxidant status (TAS).
2.2.3. Research methods on animals.
Research design: experimental, have intervention
* Mix lead acetate and Panax vietnamenis biomass: Mix
2,592g (2.592mg) of lead acetate into 1,296L (1.296mL) of distilled
water, obtain lead acetate solution. Mix 24,30g (24.300mg) of Panax
vietnamenis biomass into 0,324L (324mL) of distilled water, obtain
Panax vietnamenis biomass solution.
* Toxic method: Semichronic toxic method under toxic model
of El-Sayed I. H, Lotfy. M et al (2006); Flora G, Gupta D et al (2013)
- Lot 1 (n = 108): drink 0,2mL of distilled water in mornings
every day, continuous in 15 days, 30 days and 45 days.
- Lot 2 (n = 108): drink 0,2mL of lead acetate solution (20
mg/kg/day) in mornings every day, continuous in 15 days, 30 days
and 45 days.
- Lot 3 (n = 108): drink 0,1mL of Panax vietnamensis
biomass solution (375 mg/kg/day). After drinking SNLSK for one
hour, mice are drunk 0,2mL of lead acetate solution (20 mg/kg/day),
continuous in 15 days, 30 days and 45 days.
* Method of blood drawn for testing: Mice are killed at the
time of experiment and blood is taken at two eye sockets.
* Prior to the implementation of experiment: (36 mice).
- 12 mice are randomly selected, taken blood and divided
into 2 parts to test blood formula and blood lead level.
9
- 12 next mice are randomly in the remainder, taken blood
and divided into 2 parts to test the activity of SOD, erythrocyte GPx
and TAS, activity of peroxidase, plasma MDA, -SH.
- 12 remaining mice are taken blood to test biochemistry index.
* After the implementation of experiment: (324 mice).
- At the time of 15 days, 30 days and 45 days after the
implementation of experiment, 108 mice (each lot: 36 mice) are
randomly selected, killed and taken blood for the experiment.
* Research targets and techniques: as on humans.
2.3. Data processing
The data is processed by medical statistical methods and used
softwares such as EpiInfo 2005 (Version 3.3.2), EpiCalc 2000.
2.4. Ethnic issues in the research.
Ensure medical ethnics in the research.
CHAPTER 3
RESULT OF RESEARCH
3.1. Result of research on human.
3.1.1. The mean blood lead level in the research groups.
10
Group
Content
Group I
(n=55)
(
X
±SD)
Group II
(n=110)
(
X
±SD)
Group II
Group IIA
(n=86)
(
X
±SD)
Group IIB
(n=24)
(
X
±SD)
blood lead
level
(µg/dL)
4,26±2,28 36,54±18,36 23,82±7,54 57,66±9,73
Blood lead level in group II, IIB have considerable change.
3.1.2.The result of test of SOD, GPx, peroxidase, -SH, MDA, TAS
in the research groups.
Table 3.7. The change of some antioxidant index in group I, II
Group
Content
Group I (n=55)
(
X
±SD)
Group II
(n=110)(
X
±SD)
p
SOD (U/g Hb) 1212.87±180.70 1578.26±180.65 p<0.001
GPx (U/g Hb) 64.46±8.57 54.29±7.82 p<0.001
Peroxidase (µg/mg) 0.019±0.006 0.021±0.008 p>0.05
- SH (mmol/mg) 0.685±0.092 0.461±0.120 p<0.001
MDA (µmol/L) 3.19±0.42 4.01±0.49 p<0.001
TAS (mmol/L) 1.58±0.22 1.42±0.21 p<0.001
Table 3.11. The correlation of SOD, GPx, peroxidase, MDA, TAS
with blood lead level in group II
Content r p Linear equation
SOD
(U/gHb)
BLL
(µg/dL)
0.45 <0.05 y = 5.282 x + 1197
GPx
(U/gHb)
BLL
(µg/dL)
-0.49 <0.01 y = -0.339 x + 58.31
11
MDA
(µmol/L)
BLL
(µg/dL)
0.57 <0.01 y = 0.020 x + 3.731
-SH
(mmol/mg)
BLL
(µg/dL)
-0.68 <0.01 y = -0.0046 x +0.6172
Peroxidase
(µg/mg)
BLL
(µg/dL)
0.17 >0.05 y = 0.0004 x + 0.020
TAS
(mmol/L)
BLL
(µg/dL)
-0.32 <0.05 y = -0.008 x + 1.506
3.1.3. The result of test of peripheral blood formula in the research groups.
Table 3.12. The change of peripheral blood formula in group I, II
Group
Content
Group I(n=55)
(
X
±SD)
Group II(n=110)
(
X
±SD)
p
RBC (T/L) 5.19±0.48 4.88±0.51 p<0.001
Hemoglobin
(g/L)
154.21±11.14 149.07±10.16 p<0.01
Hematocrid (%) 46.28±3,40 43.98±6,02 p<0.01
WBC (G/L) 7.10±1.36 7.18±1.49 p>0.05
PLT (G/L) 225.42±46,35 234.06±39.28 p>0.05
3.1.4. The result of test of biochemical blood indices in the research groups.
Table 3.15. The change of AST, ALT, GGT, total bilirubin
in plasma in group I, II.
Group
Content
Group I (n=55)
(
X
±SD)
Group II (n=110)
(
X
±SD)
p
AST (U/L) 29.42±6.85 35.28±18.27 p<0.05
ALT (U/L) 30.08±9.16 37.56±25.40 p<0.05
GGT (U/L) 31.19±10.24 39.88±23.29 p<0.01
Bi TP (µmol/L) 9.87±1.26 10.14±3.65 p>0.05
Table 3.17. The change of a number of index biochemical blood
in group I, II
Group
Content
Group I (n=55)
(
X
±SD)
Group II (n=110)
(
X
±SD)
p
Glucose
(mmol/L)
4.71±0.59 4.83±0.70 p>0.05
Acid Uric 325.65±90.24 321.58±91.68 p>0.05
12
(µmol/L)
Urea (mmol/l) 5.12±0.87 5.61±0,92 p<0.01
Creatinine
(µmol/L)
79.89±15.22 87.34±12.75 p<0.01
Cholesterol
(mmol/L)
4.70±0.72 4.69±0.69 p>0.05
Triglycerid
(mmol/L)
1.68±0.64 1.72±0.71 p>0.05
3.2. Result of research on animals.
3.2.1. The mean blood lead level in experimental mice.
Table 3.21. Blood lead level (BLL) in the research lots (L)
L
BLL (µg/dL)
p
Date
o
(n=12)(a)
Date
15
(n=12)(b)
Date
30
(n=12)(c)
Date
45
(n=12)(d)
L 1
2.99±0.82 2.92±0.63 2.91±0.83 2.96±0.82
p
ba
>0.05
p
ca
>0.05
p
da
>0.05
L 2
2.99±0.82 21.01±1.77 23.34±2.17 24.97±1.59
p
ba
<0.05
p
ca
<0.05
p
da
<0.05
L 3
2.99±0.82 12.43±1.56 11.93±1.58 11.38±1.64
p
ba
<0.05
p
ca
<0.05
p
da
<0.05
p
p
21
<0.05
p
32
<0.05
p
21
<0.05
p
32
<0.05
p
21
<0.05
p
32
<0.05
13
3.2.2. The result of a number of index of antioxidant in experimental
mice
Table 3.22. The change of activity of SOD of RBC at times
L
Activity of SOD (U/gHb)
p
D
o
(n=12)
(a)
D
15
(n=12)
(b)
D
30
(n=12)
(c)
D
45
(n=12)
(d)
L 1
1056.8±74.6 1064.3±68.1 1055.8±66,4 1052.6±67.1
p
ba
>0.05
p
ca
>0.05
p
da
>0.05
L 2
1056.8±74.6 1247.7±56.8 1246.1±77.9 1249.6±71.7
p
ba
<0.05
p
ca
<0.05
p
da
<0.05
L 3
1056.8±74.6 1138.3±45.0 1144.8±43.0 1138.4±40.7
p
ba
<0.05
p
ca
<0.05
p
da
<0.05
p
p
21
<0.05
p
32
<0.05
p
21
<0.05
p
32
<0.05
p
21
<0.05
p
32
<0.05
Table 3.23. The change of activity of GPx of RBC at times
L
Activity of GPx (U/gHb)
p
D
o
(n=12)
(a)
D
15
(n=12)
(b)
D
30
(n=12)
(c)
D
45
(n=12)
(d)
L 1 55.49±6.85 54.18±6.66 55.79±6.22 56.91±7.00
p
ba
>0.05
p
ca
>0.05
p
da
>0.05
L 2 55.49±6.85 43.82±5.44 38.80±4.47 37.47±4.80
p
ba
<0.05
p
ca
<0.05
p
da
<0.05
L 3 55.49±6.85 50.14±4.01 49.92±2.99 50.07±3.72
p
ba
<0.05
p
ca
<0.05
p
da
<0.05
p
p
21
<0.05
p
32
<0.05
p
21
<0.05
p
32
<0.05
p
21
<0.05
p
32
<0.05
14
Table 3.24. The change of plasma peroxidase activity at times
L
Activity of peroxidase (µg/mg protein)
p
D
o
(n=12)
(a)
D
15
(n=12)
(b)
D
30
(n=12)
(c)
D
45
(n=12)
(d)
L 1
0.062±0.005 0.063±0.005 0.062±0.006 0.064±0.004
p
ba
>0.05
p
ca
>0.05
p
da
>0.05
L 2
0.062±0.005 0.068±0.008 0.067±0.008 0.069±0.005
p
ba
<0.05
p
ca
>0.05
p
da
<0.05
L 3
0.062±0.005 0.063±0.004 0.063±0.006 0.065±0.005
p
ba
>0.05
p
ca
>0.05
p
da
>0.05
p
p
21
>0.05
p
32
>0.05
p
21
>0.05
p
32
>0.05
p
21
<0.05
p
32
>0.05
Table 3.25. The change of concentration of -SH in blood at times
L
Concentration of -SH (mmol/mg protein)
p
D
o
(n=12)
(a)
D
15
(n=12)
(b)
D
30
(n=12)
(c)
D
45
(n=12)
(d)
L 1 1.89±0.06 1.88±0.05 1.89±0.03 1.90±0.0
7
p
ba
>0.05
p
ca
>0.05
p
da
>0.05
L 2 1.89±0.06 1.65±0.07 1.41±0.11 1.22±0.0
9
p
ba
<0.05
p
ca
<0.05
p
da
<0.05
L 3 1.89±0.06 1.74±0.06 1.63±0.07 1.61±0.0
6
p
ba
<0.05
p
ca
<0.05
p
da
<0.05
p p
21
<0.05
p
32
<0.05
p
21
<0.05
p
32
<0.05
p
21
<0.05
p
32
<0.05
15
Table 3.26. The change of concentration of plasma MDA
at times
L
Concentration of MDA (µmol/L)
p
D
o
(n=12)
(a)
D
15
(n=12)
(b)
D
30
(n=12)
(c)
D
45
(n=12)
(d)
L 1 1.52±0.14 1.52±0.10 1.54±0.08 1.53±0.09
p
ba
>0.05
p
ca
>0.05
p
da
>0.05
L 2 1.52±0.14 3.50±0.40 3.51±0.44 3.54±0.41
p
ba
<0.05
p
ca
<0.05
p
da
<0.05
L 3 1.52±0.14 2.72±0.58 2.58±0.55 2.56±0.46
p
ba
<0.05
p
ca
<0.05
p
da
<0.05
p p
21
<0.05
p
32
<0.05
p
21
<0.05
p
32
<0.05
p
21
<0.05
p
32
<0.05
Bảng 3.27. The change of concentration of plasma TAS at times
L
Concetration of TAS (mmol/L)
p
D
o
(n=12)
(a)
D
15
(n=12)
(b)
D
30
(n=12)
(c)
D
45
(n=12)
(d)
L 1 1.64±0.12 1.59±0.13 1.59±0.15 1.64±0.16
p
ba
>0.05
p
ca
>0.05
p
da
>0.05
L 2 1.64±0.12 1.23±0.08 1.20±0.09 1.22±0.10
p
ba
<0.05
p
ca
<0.05
p
da
<0.05
L 3 1.64±0.12 1.45±0.11 1.44±0.14 1.42±0.12
p
ba
<0.05
p
ca
<0.05
p
da
<0.05
p p
21
<0.05
p
32
<0.05
p
21
<0.05
p
32
<0.05
p
21
<0.05
p
32
<0.05
16
3.2.3. The result of test of peripheral blood formula in
experimental mice.
Table 3.28. The change of the number of RBC at times
L
Number of RBC (T/L)
p
D
o
(n=12)
(a)
D
15
(n=12)(b)
D
30
(n=12)
(c)
D
45
(n=12)(d)
L 1
7.81±0.34 7.85±0.31 7.79±0.39 7.84±0.32
p
ba
>0.05
p
ca
>0.05
p
da
>0.05
L 2
7.81±0.34 6.92±0.42 6.88±0.25 6.86±0.30
p
ba
<0.05
p
ca
<0.05
p
da
<0.05
L 3
7.81±0.34 7.28±0.38 7.31±0.35 7.30±0.29
p
ba
<0.05
p
ca
<0.05
p
da
<0.05
p
p
21
<0.05
p
32
<0.05
p
21
<0.05
p
32
<0.05
p
21
<0.05
p
32
<0.05
Table 3.29. The change of hemoglobin content at times
L
Hemoglobin content (g/L)
p
D
o
(n=12)
(a)
D
15
(n=12)(b)
D
30
(n=12)(c)
D
45
(n=12)
(d)
L 1 90.5±4.2 89.6±4.7 90.3±5.3 91.7±5.1
p
ba
>0.05
p
ca
>0.05
p
da
>0.05
L 2 90.5±4.2 80.4±3.9 77.7±3.8 75.6±4.5
p
ba
<0.05
p
ca
<0.05
p
da
<0.05
L 3 90.5±4.2 84.6±3.7 85.0±4.4 85.8±4.9
p
ba
<0.05
p
ca
<0.05
p
da
<0.05
p
p
21
<0.05
p
32
<0.05
p
21
<0.05
p
32
<0.05
p
21
<0.05
p
32
<0.05
17
Table 3.30. The change of hematocrit (%) at times
L
Hematocrit (%)
p
D
o
(n=12)
(a)
D
15
(n=12)(b)
D
30
(n=12)
(c)
D
45
(n=12)(d)
L 1 38.3±5.6 39.2±5.1 37,9±5,4 40.0±4.4
p
ba
>0.05
p
ca
>0.05
p
da
>0.05
L 2 38.3±5.6 34.6±4.6 33,8±4,3 32.1±5.0
p
ba
>0.05
p
ca
<0.05
p
da
<0.05
L 3 38.3±5.6 37.7±3.9 37.4±4.1 36.6±4.7
p
ba
>0.05
p
ca
>0.05
p
da
>0.05
p
p
21
<0.05
p
32
>0.05
p
21
<0.05
p
32
<0.05
p
21
<0.05
p
32
<0.05
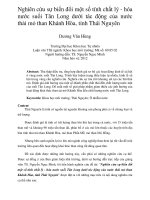
Chart 3.19. The change of the number of WBC at times
WBC (G/l)
18
3.2.4. The result of test of a number of index biochemical blood in
experimental mice
Table 3.31. The change of activity of ALT in plasma at times
L
Activity of ALT (U/L)
p
D
o
(n=12)(a) D
15
(n=12)
(b)
D
30
(n=12)
(c)
D
45
(n=12)
(d)
L 1
55.79±10.31 52.03±7.05 48.79±7.12 50.14±6.64
p
ba
>0.05
p
ca
>0.05
p
da
>0.05
L 2
55.79±10.31 59.14±13.77 61.42±11.71 66.14±10.85
p
ba
>0.05
p
ca
>0.05
p
da
<0.05
L 3
55.79±10.31 54.46±9.43 55.03±8.37 56.78±9.75
p
ba
>0.05
p
ca
>0.05
p
da
>0.05
p
p
21
>0.05
p
32
>0.05
p
21
<0.05
p
32
>0.05
p
21
<0.05
p
32
<0.05
Table 3.32. The change of activity of AST in plasma at times
L
Activity of AST (U/L)
p
D
o
(n=12)
(a)
D
15
(n=12)
(b)
D
30
(n=12)
(c)
D
45
(n=12)
(d)
L 1
271.9±91.0 268.6±67.3 265.4±59.7 268.1±33.9
p
ba
>0.05
p
ca
>0.05
p
da
>0.05
L 2
271.9±91.0 315.5±48.3 333.8±76.9 351.9±64.6
p
ba
>0.05
p
ca
>0.05
p
da
<0.05
L 3
271.9±91.0 307.8±79.8 309.7±53.6 291.0±59.5
p
ba
>0.05
p
ca
>0.05
p
da
>0.05
p
p
21
>0.05
p
32
>0.05
p
21
<0.05
p
32
>0.05
p
21
<0.05
p
32
<0.05
Table 3.33. The change of activity of GGT in plasma at times
19
L
Activity of GGT (U/L)
p
D
o
(n=12)
(a)
D
15
(n=12)
(b)
D
30
(n=12)
(c)
D
45
(n=12)
(d)
L 1
3.03±0.95 3.08±0.96 3.09±0.95 3.01±1.04
p
ba
>0.05
p
ca
>0.05
p
da
>0.05
L 2
3.03±0.95 4.17±0.83 4.08±1.08 4.26±1.09
p
ba
<0.05
p
ca
<0.05
p
da
<0.05
L 3
3.03±0.95 3.19±0.79 3.13±0.89 3.10±0.98
p
ba
>0.05
p
ca
>0.05
p
da
>0.05
p
p
21
<0.05
p
32
<0.05
p
21
<0.05
p
32
<0.05
p
21
<0.05
p
32
<0.05
CHAPTER 4 - DISCUSSION
4.1 The effects of lead on some antioxidant indexes
4.1.1. The effects of lead on activity of SOD enzyme
For lead-exposing workers, the average SOD activity of
erythrocyte in group II is higher than that in group I (p<0.001), that in
group IIB is higher than group IIA and group I (p<0.05). For
experimental animals, in Lot 2 average SOD activity increased
compared with the time before causing toxicity and compared with Lot
1 at the same time (p <0.05). Lead binds to the -SH group of ALAD,
ALAD inhibition and ferrochelatase, thus δ-ALA is not converted into
Hem-δ resulting in accumulation of ALA, accumulated ALA will be
enolized from the form of ceto = ALA into enol-ALA and enol-ALA
will be oxidized into free radicals, together with the metabolic product
of 4,5-dioxovaleric acid; this is an alkylating agent having damage to
genetic material as a result of release of pre-oxidants. Maybe the
increase of the amount of pre-oxidants (including O
2
) leads to
increasing reaction of SOD to reduce O
2
.
4.1.2. The effects of lead on GPx enzyme activity
For lead-exposing workers, GPx activity in group II decreased
compared with in group I (p<0.001) and in group IIB decreased
20
compared with group IIA, group I (p <0.05). For experimental animals,
the activity of GPx in Lot 2 descended and achieved the lowest level
on forty fifth day after causing toxicity (37.47 ± 4.80 U/g Hb). The
reduction had a statistic meaning (p <0.05) compared with the time
before causing toxicity and Lot 1 at the same time of the study.
Decreased GPx activity may be during lead poisoning,
reduced concentration of selenium in blood causing decreased activity
of GPx, or the increase of H
2
O
2
because when SOD activity increases
resulting in the increase of H
2
O
2
while H
2
O
2
inhibits GPx; besides lead
has effects on group SH of GPx causing enzyme inhibiton.
4.1.3. The effects of lead and peroxidase activity.
After SOD deoxidizes free radicals, generates a lot of H
2
O
2
,
peroxidase involves in the process of removing H
2
O
2
, peroxidase
uses H
2
O
2
as an electron acceptor to catalyze many different redox
reactions, at that time H
2
O
2
is deoxidized into H
2
O. Because SOD
generates a lot of H
2
O
2
which can reult in the increase of peroxidase,
that is considered as a defensive reaction of the body to reduce H
2
O
2
.
4.1.4 The effects of lead on the concentration of -SH group in blood.
For lead-exposing workers, the average concentration of -SH
group in group II decreases compared with that in group I
(p<0.001); that in group IIB decreases compared with in group I,
IIA (p<0.05) and -SH concentration inversely correlates with blood
lead levels (r = -0.68). For experimental animals, the concentration
of -SH in Lot 2 descends along with the time of the study, decreases
compared with that in Lot 1 at the same time and compared with the
time before conducting studies (p<0.05).
The mechanism of lead toxicity is caused by binding to -SH
group of proteins and enzymes containing -SH groups, so the higher
blood lead level concentration led to decreased group SH and blood.
4.1.5. Effects of lead on the concentration of plasma MDA
For lead-exposing workers, the average concentration of
plasma MDA in group II increases compared to that in group I
(p<0.001) and that in group IIA, IIB increased compared to group I
(p<0.05). MDA positively correlates (r = 0.57, p <0.01) with blood
21
lead levels. For experimental animals, the average concentration of
MDA in Lot 2 increases compared to that in Lot 1 at the same time
and at the time before causing toxicity (p <0.05).
4.1.6. The effects of lead on the concentration of plasma TAS
For lead-exposing workers, the concentration of plasma TAS
in group II decreases compared to group I (p<0.001) and that in
group IIA, IIB decreases compared to group IIA and group IIB
(p<0.05), there is an inverse correlation between TAS and blood lead
levels (r = -0.32; p<0.05). For experimental animals, the average
concentration of TAS in Lot 2 decreases compared to the time before
causing toxicity and compared to Lot 1 at the same time (p<0.05).
4.2. The effects of lead on biochemical indices
4.2.1. The effects of lead on the concentration of urea, creatinine in
blood.
For lead-exposing workers, the average concentration of urea,
creatinine in blood in group II are higher than that in group I
(p<0.01), that in group IIB are higher than that in group I, IIA
(p<0.05); the concentration of urea, reatinin in blood positively
correlate with blood lead levels (r = 0.32, r = 0.38, p<0.5). For
experimental animals, in Lot 2 the average concentration of urea,
creatinine in blood increase compared with that in Lot 1 at the same
time of the study and compared with the time before causing toxicity
(p<0.05). Because lead is mainly eliminated out of the body through
the kidneys it can be poisonous to this organ.
4.2.2. The effect of lead on some biochemical indices of liver.
For workers exposing to lead, the average activity of AST,
ALT, GGT in group II are higher than that in group I (p<0.05), GGT
moderately correlate with blood lead levels (r =0.31). For experimental
animals, in Lot 2 the average activity of ALT, AST, GGT are higher
than that in Lot 1 (p<0.05). Dioka C. E et al (2004), Al-Neamy F. R. M
et al (2010) showed that the activity of ALT, AST of lead-exposed
workers increased compared with the control group (p<0.05). Kilikdar
D et al (2011), a study on rats showed there was a significant increase
22
of ALT, ALP, bilirubin in lot causing toxicity in comparison with
control lot. This was explained that lead fixed in the liver, converted
and eliminated, leading to toxic effects of lead on the liver and the
increase of the activity of liver enzymes.
4.3. The effectiveness of Panax vietnamenis biomass on
experimental animals
4.3.1. The effectiveness of Panax vietnamenis biomass on
antioxidant systems
* Activity of erythrocyte SOD: In Lot 3, average SOD activity of
erythrocyte is lower than that in Lot 2 at the same time of study (p <0.05).
Maybe, when blood lead levels increase resulting in more produced free
radicals (including O
2
) and experimental animal’s body reacts by
increasing the activity of SOD for O
2
clean-up. In Lot 3, blood lead levels
increase less than Lot 3, thus free radicals (including O
2
) can be generated
less leading to lower activity of SOD. Kim. S. H et al (2003), a research
on volunteers showed that long-term use of ginseng may enhance the
effect of antioxidant potential of the body by improving the system of
antioxidants such as SOD, catalase . Nguyen Trong Diep et al (2012),
showed that Panax vietnamenis biomass has the effectiveness of
increasing SOD activity of radiation exposed rats and equivalent
effectiveness as Belaf.
* GPx activity of erythrocyte: average GPx activity of
erythrocyte in Lot 3 is higher than that in Lot 2 at the same time of the
study, but still lower than that in the initial time (p <0.05). Panax
vietnamenis biomass has the effectiveness of reducing blood lead levels
in Lot 3 compared to Lot 2. As a result, the activity of GPx in Lot 2 is
higher than that in Lot 3. Nguyen Trong Diep et al (2012) showed that
Panax vietnamenis biomass has the effectiveness of increasing GPx
activity of radiation exposed rats and equivalent effectiveness as Belaf.
Kilikdar D et al (2011) found that garlic is active in increasing the
activity of GSH, SOD in Lot causing lead poisoning compared to Lot
causing lead poisoning without using garlic
23
* The concentration of -SH group in blood: The concentration
of -SH group in blood in Lot 3 is higher than tht in Lot 2 at the same
time of study, but still lower than before causing toxicity (p <0.05) .
Panax vietnamenis biomass is active in reducing blood lead levels of
lead toxicity in which poisoning mechanism of lead has been widely
known as inhibiton of enzyme containing -SH group, so when blood
lead level increases resulting in the decreased concentration of -SH
group in blood. In Lot 2, blood lead levels decrease compared with Lot 3
leading to the higher concentration of -SH group.
* The concentration of plasma MDA: the concentration of
MDA in Lot 3 is lower than that in Lot 2 at the same time, but MDA
concentration was higher compared with before conducting study (p
<0.05). Nguyen Quoc Huy (2008), Nguyen Van Long (2011), Panax
vietnamenis biomass significantly reduces MDA concentration
compared to toxic Lot CCl
4
without using ginseng
* The concentration of plasma TAS: the concentration of
plasma TAS in Lot 3 is higher than that in Lot 2 at the same time of
the study, but still lower than that in the initial time (p <0.05). Bui
Tuan Anh (2004), rabbits exposed to single dose toxicity of
methamidophos, at the fourth hour found that the concentration of
TAS decreased compared with control lot(p <0.05), Belaf have the
effectiveness of increasing concentration of TAS. Nguyen Trong
Diep et al (2012) showed that Panax vietnamenis biomass increases
GPx activity of radiation-exposed mice and has the equivalent
effectiveness as belaf.
4.3.2. The effectiveness of Panaxv vietnamenis biomass on blood
formula.
The number of erythrocyte, hemoglobin and hematocrit
concentration in Lot 3 is higher than that in Lot 2 at the same time,
but decrease compared with the initial time (p <0.05). The number of
leukocyte in Lot 3 is lower than that in Lot 2 (p <0.05). When blood
lead level in Lot 3 is lower than that in Lot 2, leading to the
decreased possibility of lead toxicity to peripheral blood and blood-
24
forming organs and the number of erythrocyte, hemoglobin and
hematocrit concentration in Lot 3 is higher than that in Lot 2.
4.3.3. The effectiveness of Panaxv vietnamenis biomass on some
biochemical blood indices.
The average activity of ALT, AST, GGT in Lot 3 is lower
than that in Lot 2 (p <0.05). Nguyen Van Long (2011), the activity of
ALT, AST in lot of white house-mice poisoned by CCl
4
and drunk
Panax vietnamenis biomass (1.2 g/kg) reduced compared with
poisoned Lot without using Panax vietnamenis biomass (p <0.01),
the weight of liver increased less (p <0.05) and the histopathological
images showed that damage of liver is milder, the number of liver
necrosis in rats is less. Nguyen Thi Thu Huong et al (2006), Tran Q.
L et al (2001), Panax vietnamenis biomass has the effectiveness of
protecting liver cells when causing damages to experimental liver.
CONCLUSION
1. The changes of some antioxidant indexes and serum
biochemistry in people occupationally exposed to inorganic lead
and experimental animals.
1.1. In workers occupationally exposed to inorganic lead.
- Reduce the activity of antioxidant enzymes such as
erythrocyte GPx, -SH group, plasma total antioxidant status (TAS) in
blood lead level > 10 µg/dL (group II) compared to blood lead level
≤ 10 µg/dL (group I) (p<0.001). GPx, -SH and TAS have inverse
correlation with blood lead level (r = -0.49; r = -0.68 and r = -0.32).
Increase the activity of antioxidant enzymes, erythrocyte SOD, plasma
MDA level in group II compared to group I (p<0.001). SOD, MDA have
positive correlation with blood lead level (r = 0.45; r = 0.57).
- Increase the activity of enzymes such as AST, ALT, GGT,
urea level and creatinine in group II compared to group I (p<0.05 and
p<0.01). Activity of GGT, urea and creatinine level have positive
correlation with blood lead level (r = 0.31; r = 0.32 và r = 0.38).
25
1.2. In experimental animals.
- Reduce the activity of antioxidant enzymes such as
erythrocyte GPx, -SH group, plasma total antioxidant status (TAS) in
toxic lot (lot 2) compared to control lot (lot 1) (p<0.05). Increase the
activity of antioxidant enzymes erythrocyte SOD, peroxidase, plasma
MDA level in lot 2 compared to lot 1, the difference is statistically
significant (p<0.05).
- Increase the activity of enzymes AST, ALT, plasma GGT; urea
level and blood creatinine in lot 2 compared to lot 1 (p<0.05).
2. Protective effects of Panax vietnamensis biomass in animals
infected lead acetate.
Panax vietnamenis biomass (375 mg/kg/day) has protective
effects on experimental animals infected lead acetate (20 mg/kg/day):
- The activity of erythrocyte GPx, -SH group, plasma TAS
level in toxic lot with Panax vietnamenis biomass (lot 3) is higher
than that of toxic lot without Panax vietnamenis biomass (lot 2)
(p<0.05). The activity of erythrocyte SOD, plasma MDA level in lot
3 is lower than that of lot 2 (p<0.05).
- The number of erythrocyte, hemoglobin, hematocrit in lot 3
is higher than that in lot 2 (p<0.05). The number of hemoleukocyte in
lot 3 is lower than that in lot 2 (p<0.05). The activity of plasma AST,
ALT, GGT in lot 3 is lower than that in lot 2 (p<0.05).
RECOMMENDATION
1. You can use tests on the changes of some antioxidant
enzymes to measure oxidative stress in workers occupationally
exposed to inorganic lead.