nghiên cứu xác định một số tham số về mưa góp phần hoàn thiện công thức tính lưu lượng thiết kế công trình thoát nước nhỏ trên đường trong điều kiện khí hậu việt nam bản tóm tắt tiếng anh
Bạn đang xem bản rút gọn của tài liệu. Xem và tải ngay bản đầy đủ của tài liệu tại đây (1.04 MB, 46 trang )
MINISTRY OF EDUCATION & TRAINING
UNIVERSITY OF TRANSPORT AND COMMUNICATIONS
Nguyen Anh Tuan
STUDYING THE DETERMINATION OF A NUMBER OF RAIN PARAMETERS TO MAKE CONTRIBUTIONS TO
COMPLETING THE FORMULA OF DESIGN FLOW OF SMALL SIZED DRAIN WORKS ON ROAD UNDER
THE CLIMATIC CONDITIONS OF VIETNAM
Major: Building auto road and city road
Code: 62.58.30.01
- 2 -
SUMMARY OF DOCTOR OF ENGINEERING
Hanoi-2014
PREAMBLE
1. Background for the research.
Today, the transportation network has been expanding; urban areas, industrial zones have been developed at a
rapid pace. We require a formula to calculate the design flow for simple, easy-to-calculate small drainage structures
with the acceptable accuracy.
In recent decades, Vietnam has been seriously affected by the climate change phenomenon, increasing the
extreme climate phenomena, affecting the rainfall regime in Vietnam. Therefore, it affects the rainfall parameters
used in calculating the design flow of drainage works on the road Q
p
. The use of the research results, previous
rainfall data in calculating Q
p
becomes the reduced reliability, with large errors, giving rise to the damages to
works, delaying the transport, increasing costs of repairing and maintaining, affecting the living environment…
- 3 -
This clearly shows the reality out of the practice, such as the phenomenon of damages to small drainage works
on the road due to increasing flood; damages can occur immediately or only a few years after being put into use;
phenomenon of water storage at the upstream causes flooding to the fields and villages, affecting the agricultural
production often occurs in the Central Region after completing the construction of roads; the phenomena of street
inundation after the heavy rains in some urban areas of Vietnam makes difficulties, disturbance for activities and
production. . . Obviously, there are outstanding problems, emerged problems of determining the rainfall parameters
in formula of calculating Q
p
of small water drainage works on the roads in Vietnam today.
From the above urgent requirements, the dissertation has been selected for the research.
2. Research objectives.
- Theoretical research, analysis of nature, proposing principles and methods, formula for determining the
parameters of rain used in the formula of calculating design flow of small drainage works on roads under the
conditions of Vietnam.
- Applying into the practice: immediately, because there has not been enough conditions, targets of determining
specific valuation of parameters on rainfall at 12 typically selected meteorological stations, these values are
proposed for reference to the practical use in calculating design flow of drainage works on roads in these areas of
Vietnam.
3. Research contents.
- The thesis focuses on researching and resolving rain parameters. This is the decisive, important and indefinite
parameters in calculating Q
p
of small drainage works on the roads, totally depending on the particular
characteristics of the climate in Vietnam. The rainfall parameters of the research are as follows:
+) The study shall determine the calculated daily rainfall H
n,p
at a design frequency tailored to the
characteristics of the weather changes in Vietnam.
- 4 -
+) The study shall identify specific factors of the rain shape Ψ
T
and issues of rain zoning in line with the
requirements on calculating design flow of small drainage works on the roads in Vietnam.
+) The study shall determine parameters on the designed rainfall intensity a
T,p
, corresponding to the
concentration time of designed water and design frequency. Calculated rain intensity parameters a
T,p
is the general
impact parameter in calculating design flow of drainage works on the roads.
- The above are the parameters on rain used in the formula of calculating design flow of drainage works on the
roads.
4. Research methods.
Statistical analysis is the main method used in the thesis.
5. Scientific meanings and pratice of the project.
- Researching characteristics of rainfall changes, contributing to further elucidate the unusual situation of
change of rain in the territory of Vietnam in recent decades. Realizing the urgency to recalibrate or gradually
replace the new database of rainfall in line with the weather phenomenon under the affects of the climate changes;
suggesting solutions to coping with the phenomenon of radical changes in rain in calculating design flow of water
drainage works on the roads in Vietnam today.
- The study shall determine the parameters of rainfall (calculated daily rainfall H
n, p
, calculated rainfall intensity
a
T,p
, logical rain zoning and other characteristics of rain: Ψ
T
, S
p
, A, B, m, α) suitable for the climatic conditions in
Vietnam used in the formula Q
p
calculating the small drainage works on the roads. A few researched rain
parameters identified in the thesis (such as daily calculated rainfall parameters H
n,p
, typical characteristic rain shape
coefficient Ψ
T
) can also be used in the Sokolopsky formula calculating design flow for medium and large basins;
used in calculating showers - flow with NAM - MIKE model with reliable results.
- 5 -
- Rain gauge stations in Vietnam are numerous, but most of them are used to measure daily rainfall and few of
them are recording rain gauge stations, so that when the method of directly determining the calculated rain intensity
parameters are based on recording rain gauge data, then researching the construction of empirical formula in
indirectly calculating the rainfall intensity a
T,p
in the thesis; issues of transferting the calculated daily rainfall H
n,p
into the calculated rainfall of each short time H
T,p
is necessary for calculating the peak flow of the design flood of
the basin of drainage works on roads in Vietnam.
- To better plan the flood prevention, firstly, it is required to logically zone flood, in accordance with rainfall
characteristics of each region. The thesis has researched proposals on criteria, rain zoning methods for mapping the
logical rain zoning with a large proportion in accordance with the requirements for calculating flood flow of the
small basins of small drainage works on the roads in Vietnam.
- The thesis has established the specific parameters of rain, such as calculated daily rainfall H
n,p
according to
the design frequency, typical coefficienmt of the rain shape Ψ
T
, rain strength S
p
, factors of the climate zones A, B,
coefficient of the rain shape m, the regression coefficient of the climate zone α, standard rainfall intensity a
TO,p
used in 07 empirical formula that the dissertation researches and develops to calculate the rainfall intensity a
T,p
corresponding to the concentration time of calculated water and design frequency, for 12 selected typical
meteorological stations, including stations at Muong Lay Town-Dien Bien Province, Tuyen Quang City, Lang Son
City, Lang-Hanoi, Ha Dong-Hanoi, Son Tay Town-Hanoi, Vinh City, Dong Hoi City, Da Nang City, Nha Trang
City, Buon Ma Thuat City, Can Tho City, with the actual rainfall records from 1960 - 2010, reference
recommendations forn the practical use to compute the design flow of small drainage works on the roads today in
these regions of Vietnam.
6. New contributions of the dissertation.
- 6 -
- Determining the values of calculated daily rainfall H
n,p
according to the design frequency at 12 selected
meteorological stations on the basis of long actual rainfall recording sequence from 1960 to 2010, in which the last
time is supposed to correspond to the new context with the impact of climate change phenomena, applied to
calculate the design flow of small drainage works on the roads in accordance with current design standards
TCVN9845:2013 [5] or using Sokolopsky formula in computing the design flow for medium and large basins (in
the regions located with these meteorological stations).
- Determining the values of characteristic coefficient of the rain shape Ψ
T
for the regions of 12 studied
meteorological stations with the rain gauge period from 1960 to 2010, used to calculate the rainfall intensity
corresponding to the water concetrating time of the basins and the design frequency used in the standard
TCVN9845:2013 [5] to calculate the design flow of small drainage works on the roads. At the same time, it is an
important parameter used to calculate the transfer from the calculated daily rainfall H
n,p
to the calculated rainfall of
each short timeH
T,p
used in Sokolopsky formula to calculate the design flow for medium and large basins in
calculating showers-flow with the NAM-MIKE model with the reliable results. Also, the characteristic rain shape
coefficient Ψ
T
can also be used as a criterion for zoning the rain.
- Summarizing and researching to improve into 7 types of empirical formula in calculating the calculated rain
intensity parameter a
T,p
corresponding to the water concentration time of the basin and the design frequency used to
calculate the design flow of small drainage works on the roads in Vietnam corresponding to the different conditions
on rainfall data available in the design areas, in which there are 3 types of new improved formula of the thesis, the
formula remains the coefficients in the formula new building for the thesis area 12 meteorological stations selected
for the study period rainfall in 1960-2010.
- 7 -
Chapter 1: OVERVIEW ABOUT THE RESEARCH ISSUES
1.1. Domestic and international related researches.
1.1.1. Theoretical basis of the formula for determining the maximum flood current flow due to rain on the
catchment [32].
- The formula of the limited intensity determining the design flood peak flow is drawn from the famous flow
formula whose basis is the theory of concentrating water from the basin. This theory was firstly analyzed and
researched by USSR scientists (N.E. Dongov, M.E. Velikanov and M.M.Protodiakonov) and it is now widely used
in the world in the field of hydrological computation. The assumptions are.
+) Basins are evenly shaped, the river bed in the middle.
+) Rain and losses are evenly distributed over the entire basin and with unchanged intensity during the
computation time.
+) Considering the rain frequency of flood flow to be equal to the flood flow frequency.
- By analyzing rules of water running from slopes of the basin to drainage works, the authors of the theory of
concentrating water from the basin have drawn the formula for determining the maximum flow of the design flood
flow.
FaKQ
pp
,
τ
ϕ
=
(1.1)
In which: Q
p
is the design flow at frequency p; F is the catchment area
ϕ is the flow coefficient with regard to the amount of lost rain water
a
τ
,p
is calculated rainfall intensity at water concentration time τ of the basin and the frequency p. It is
the max average rainfall intensity during the water concentration time τ and frequency p
- 8 -
K is the unit conversion coefficient when elements in the formula are not calculated at the same unit. K
= 16.67 when Q
p
is in m
3
/s, a
τ
,p
calculated in mm/ph, F in km
2
.
- Formula (1.1) is the basic formula. From the basic formula (1.1), very many authors have studied the
application and completed to suit the actual conditions in terms of rainfall intensity distribution law, water running
conditions on the natural basins.
1.1.2. Formula defining the design flow for small drainage works on the roads in some countries and in
Vietnam.
1.1.2.1. In some countries: countries with the developed science such as the U.K., the U.S., Russia, Japan, China,
etc use the limited intensity formular in the form (1.1) to determine the design flow Q
p
for small water drainage
works on the roads.
1.1.2.2. The formula for determining the design flow for small drainage works on the roads in Vietnam
- The formula of the limited intensity of the standard TCVN9845:2013: Calculation of flood flow
characteristics [5]: applied to the basin with F ≤ 100 km
2
.
1,
δϕ
FHAQ
pnpp
=
(1.9)
In which: A
p
is the relative flood peak flow module at the frequency p
A
p
= 16.67Ψ
τ
/
τ
H
n,p
is the calculated daily rainfall at the frequency p
δ
1
is the factor with regard to effects of ponds, lakes, and swamps.
- Limited intensity formula of National University of Civil Engineering (the formula proposed by Prof.,
Dr.Nguyen Xuan Truc) [3], [32].
- 9 -
The small drainage structures on roads in Vietnam often have the small catchment area (usually less than 1 km
2
to a few km
2
), so the water concentration time τ is short. Therefore, the calculation of Q
p
is based on the rain
intensity parameters with the short calculation time, but the high rain intensity will be more accurate than using the
daily rainfall parameters as in the formula (1.9) of the design standard [5]. With that viewpoint, since the 1980s,
Prof. Dr. Nguyen Xuan Truc has proposed using the following formula (1.10) to calculate the design flow Q
p
for
small drainage structures on roads with the basin area F≤30 km
2
in Vietnam.
1,
67.16
δφϕ
τ
FaQ
pp
=
(1.10)
With: φ the flow reduction coefficient depending on the basin area.
- Limited intensity formula used in calculating urban road drainage under the design standard
TCVN7957:2008 [8].
FqCQ
pp
,
τ
=
(1.11)
With: C is the flow coefficient, depending on the nature of the basin surface and p
q
τ
,p
is the rain flow module or rain intensity according to the calculated volume corresponding to the water
concentration time τ and design frequency p
q
τ
,p
= 166.67a
τ
,p
In which: q
τ
,p
in liter/s/ha, a
τ
,p
in mm/ph.
1.1.2.3. Sokolopsky Formula [3], [15], [32].
This is the kind of volume formula used to calculate the flow of water drainage works on the roads with the
basin area F>100 km
2
.
- 10 -
0
0,
)(278.0
QFf
t
HH
Q
l
p
p
+
−
=
δϕ
τ
(1.12)
With: H
τ
,p
is the calculated rain flow at the water concentration flow τ of the basin and the frequency p. It is the
max rainfall during the water concentration time τ and the frequency p (mm)
H
0
is the initial lost rain water (mm)
f is the factor of flood shape , t
l
the duration of rise (h)
δ is the coefficient with regard to the influence of reduced flow of ponds, swamps and forests in the basin
Q
0
the water flow in the river before the flood (m
3
/s).
1.1.3. The problem of determining the parameters in the formula for calculating the design flow of small
drainage works on the roads.
The parameters of rain in the formula for calculating the design flow of small drainage works on the roads are:
calculated daily rainfall H
n,p
at the design frequency p; characteristic rain shape coefficient Ψ
T
and the issue of rain
zoning; the calculated rain intensity a
τ
,p
at the water concentration time τ and design frequency p.
1.1.3.1. Calculated daily rainfall H
n,p
.
- Calculated daily rainfall H
n,p
is determined by the statistical analysis method on the basis of sequence of data
measuring actual daily rainfall for many continuous years at rain gauge stations within the project design area.
- Up to now, the fullest database about H
n,p
in Vietnam was founded in 1987 in accordance with the design
standard TCVN9845:2013 [5], for 589 points of rainfall gauge across the country with the frequency p=1%, 2%,
4%, 10%, 25%, 50%. Since then now, it has passed over 25 years, the rainfall regime in Vietnam has been changed,
influenced by the phenomenon of climate change, so the database has become less accurate so far.
1.1.3.2. Characteristic coefficient of the rain shape
Ψ
Τ
and rain zoning.
- 11 -
- Up to now in Vietnam, there have been some projects on zoning rain and building the coefficient Ψ
T
∼ T for
each rain zone. The rain partitioning projects are subdivided by the rainfall intensity, i.e. only paying attention to
the relation of reducing the rainfall intensity by the calculated interval a
T
∼ T. Like the rain partition of the year
1977 of the Irrigation Standard QP.TL.C-6-77 [7], it divided the Northern Region into 10 rain zones; the 1980 rain
partition of Hoang Minh Tuyen divided the entire territory of Vietnam into 15 rain zones [60]; the 1991 rain
partition of Hoang Niem and Do Dinh Khoi divided the whole nation into 18 rain zones. In 1993, Dr. Trinh Nhan
Sam also divided the entire territory into 18 rain zones as above, but the coefficient value Ψ
T
established in rain
zones is a bit different [29], [40]. Results of rain zoning in 1993 were included in the design standard
TCVN9845:2010 [5], which are now used to calculate Q
p
for the drainage works on the roads.
- Therefore, over the annual periods, the rainfall regime of Vietnam has been changed, leading to the fact that
the rain zoning is also adjusted accordingly and characteristic rain shape coefficient value shape Ψ
Τ
in the rain
zones are also corrected accordingly.
1.1.3.3. Defining the calculated rain intensity a
T,p
: with the following instructions.
- Direct calculation a
T,p
: on the basis of sufficient surbey data available for recording rain gauge at the
meteorological stations, using the method of statistical analysis to calculate the calculated rainfall intensity value
a
T,p
in calculated rain period T and the design frequency p. When calculating the flow of drainage works, the
calculated rain period T is drawn by including the water concentration time τ of the basin.
- Determining the calculated rainfall intensity a
T,p
based on the calculated daily rainfall H
n,p
and characteristic
rain shape coefficient
Ψ
T
pn
T
pT
H
T
a
,,
.
Ψ
=
(1.14)
- 12 -
This method is proposed by Alexayev. It has been used in Vietnam to calculate Q
p
in the design standard
TCVN9845:2013 [5].
- Building the empirical formula to calculate a
T, p
.
The empirical formulas are all built based on the characteristic rain strength S and the rain form factor m to
determine the rainfall intensity calculated a
T,p.
The basic form is: a
T,p
= S
p
/ T
m
= (A + B.lgN) / T
m
.
From this basic formulation, it has been developed into a lot of other empirical formulations to suit the climatic
conditions in each country, such as the formula of the U.S., India, Russia, China, Japan, Korea China, Indonesia,
Malaysia, etc. In these formulas, compared to above basic formulations, they can be added or subtracted a few
regression coefficients.
In Vietnam, there have been many studies to suit the climatic conditions of the nation, typically:
./ The research of Prof., Dr. Nguyen Xuan Truc in the year 1980 for 18 meteorological stations:
m
pT
T
NBA
a
lg.
,
+
=
./ The research of Dr.Tran Huu Uyen in the year 1973 for 34 meteorological stations:
mk
pT
NbT
NBA
a
).(
lg.
,
+
+
=
./ The research of Dr.Tran Viet Lien in the year 1979 for 47 meteorological stations:
m
pT
bT
NBA
a
)(
lg.
,
+
+
=
./ The research of Prof., Dr.Ngo Dinh Tuan in the year 1980 for 10 meteorological stations:
m
T
ppT
eaa
−
=
.
max,,
- 13 -
1.1.4. Researching, analyzing the factors affecting the design flood flow calculation of the small drainage works
on the roads.
- Factors affecting the flood flow of small basins of small drainage works on the roads can be divided into 3
categories: climatic conditions, in particular the rain; buffering surface factors; effects of socio-economic activities
of human beings.
+) Under the climatic conditions of Vietnam, the rain is a factor directly affecting the flood flow of small
basins and the rain is the cause of flood flows on small watersheds in Vietnam.
+) Buffering surface factors including: geographical location, topographical and geomorphological features,
geological and soil conditions, surface features, shape of basin. . . These factors affect the two main stages:
decisive to concentrating the flow and loss rate. In addition, geographical location and topographical features affect
climate conditions expressed by different climate regions and zones in the country. Topography affects rainfall,
flood currents of the basin in both direct and indirect manners. Direct manner: creating heavy rainfall due to the
windward, creating the little rainfall due to the leeward. Indirect manner: centralizing water fast or slow due to
large or small slope, stream network in the fan shape or feather shape. . .
+) Socio-economic activities of the human beings are today increasingly large with negative or positive
influence such as effects causing the phenomena of climate change, sea level rise, changing basin buffering surface
factors. It is considered through two factorsd of rain and other padding surface.
- In addition, the design flow of drainage works on the roads Q
p
is also influenced by the design frequency p.
The greater the frequency value p becomes (p = 10%, 20%, 50%, ), the smaller the calculated Q
p
is and vice versa,
it is designed with smaller value p (p = 3%, 2% , 1%, ), then the greater the calculated Q
p
is.
- The calculated rain intensity parameter a
τ,
p
is a general affecting quantity in calculating the design flow of
drainage works on the roads because it shows the impacts of all factors affecting the calculation of the design flood
- 14 -
flow of drainage works on the roads, including the rain factors, factors of padding surface and the design
frequency.
+) Indeed: a
τ
,p
= H
τ
,p
/ τ
./ Precipitation regime in the design zone is decisive to the largest value the calculated period H
τ,
p
, so it
affects a
τ,
p
.
./ Design frequency p affecting H
τ
,p
, so it affects a
τ
,p
.
./ Buffering surface factors affecting the water concentration time parameter τ of the basin, so it affects a
τ,
p
.
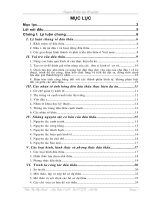
+) Also, unlike the calculated daily rainfall parameter H
n,p
, then the calculated rain intensity parameter a
τ,
p
also reflects the influence of rain shape.
Figure 1.4 shows that
despite the same calculated
daily rainfall H
n,p
, in the two
rain regions I and II, they have
different shapes, then the
highest rainfall in the
calculated period H
τ,
p
in two
different areas of rain and as a
result, the calculated rain
intensity a
τ,
p
= H
τ
,p
/τ is also
different.
t
H
τ
H
II
τ
,p
n,p
I
II
H
τ
,p
I
H
t,p
0
Figure 1.4: Influence of the rain
shape to the rain intensity a
τ,
p
- 15 -
- Thus, the limited intensity formula used to calculate Q
p
for the small drainage works already has a general
affecting parameter a
τ,
p
1.2. Shortcoming issues at the thesis to be focused on the settlement.
- Through the above analysis and evaluation, the most urgent existing problems in computing the design flow
of small drainage works on the roads in Vietnam today is the determination of the rain parameters in formulars
calculating Q
p
of small drainage works on the roads. Because the currently used parameters were set in previous,
they are not matched with the computational requirements Q
p
of small drainage works on the roads in the weather
and climate conditions in Vietnam today.
- Zoning rain (too wide and for long time) as used in the applicable design standard TCVN9845:2013 [5] is not
suitable for the computational requirements Q
p
of small drainage works on roads under the present conditions in
Vietnam and it is necessary to propose the researches for correcting.
- The calculated rain intensity parameters are of the general and representative characteristics for the rain
regime and the shape of the rain zone, for the specific watershed buffering surface, the water concentration time
and design frequency, it is characterized by the distinct climates of Vietnam, so it is necessary parameters for
calculating the design flow of small drainage works on the roads, reflecting more closely the condition climate and
terrain of Vietnam. It is necessary to research and determine the calculated rain intensity parameter a
T,p
under the
climatic conditions of Vietnam used to determine the design flow of small drainage works on the roads Q
p
in order
to ensure the required level of precision.
Chapter 2: STUDYING RAIN CHARACTERISTICS UNDER THE EFFECTS OF THE PHENOMENON
OF CLIMATE CHANGE IN COMPUTING THE DESIGN FLOW OF SMALL DRAINAGE WORKS ON
THE ROADS
- 16 -
2.1. Overview of Vietnam climatic conditions.
- Vietnam is within the humid tropical, monsoon climate. The annual rainfall and rain duration are relatively
large, averaging from 1100 - 8000 mm/year and from 67-223 days of rain/year, compared with countries in the
same latitude, it is about 2.4 times higher [25].
- The rainfall regime in Vietnam is under the effect of three main factors:
(i) Weather forms of raining amd raining causes
(ii) Wind
(iii) Topography.
2.2. Introduction about the network of meteorological stations and rain gauge data sources in Vietnam.
- According to sources of the National Centre for Hydrometeorological Forecasting, at present, the whole
nation has more than 800 rain gauge points (including meteorological stations, meteorological stations and rain
gauge sites are operating) distributed throughout the territory, reaching the national average density of
approximately 433 km
2
/rain gauge point. Self-recording rain gauge equipments have been present at most
meteorological stations, accounting for about 20% of the total rainfall stations, each province has ≥ 1 meter
meteorological station with self-recording rain gauge machine, some provinces have up to ≥ 2-3 stations, remaining
rain gauge points have only daily rainfall measuring equipments.
- For the time of observation: in the north, there are uniform monitoring data from around the year 1960
onward; in the south, due to historical circumstances, continuous and reliable monitoring data are from the year
1980 now.
- In the thesis, rain gauge data is collected from 1960 - 2010 (stations in the North Vietnam), from 1980 to
2010 (stations in the South Vietnam). The sequence of research data is 30-50 years long, so results ensures the
necessary reliability.
- 17 -
2.3. Studying rainfall variability features under the effect of the phenomenon of climate change and its
effects over calculating the design flood peak flow of small drainage works on the roads.
The study was carried out over 7 norms related to the calculation of the design flow of small drainage works
on the roads as follows.
2.3.1. The rainy season, dry season.
- To distinguish the rainy season, dry season in the year, the thesis used “excess loss norms” [34]. According to
this criterion: the rainy season is the season including continuous months with the rainfall exceeding losses (usually
taken as 100mm/month, according to the study [34]) with the exceeding frequency p≥50%.
That is: p{ (H
month
)
i
≥ 100 mm/month } ≥ 50%.
- Research findings about the rainy season in the year in the sequence of actual rainfall records in 1960 - 2010
at 12 selected typical meteorological stations are as in Table 2.2 below. Recognizing that in general, the rainy
season in Vietma does not have the shift, the change compared with the results of previous studies, however, there
have been fluctuations in recent years.
2.3.2. Rainy months with many days and few days.
- To classify the rainy month with many days, use the classification coefficient
K
rain-for-many-days
= the number of rainy days in the month/30
- The month with many rainy days: K
rain-for-many-days
≥ 0.5
Table 2.2: Summary of research findings of the month with many rainy days, comparing the research findings of
months of the rainy season at 12 meteorological stations selected for studies from 1960-2010
No. Meteorological stations, Month with many rainy days in the Rainy months in the year
- 18 -
places
year (average) (average)
Months Time of appearance
Rainy
months
Time of rainy season
1 Muong Lay Town Station 4 months May → August 6 months April → September
2 Tuyen Quang City Station 6 months March → August 7 months April → October
3 Lang Son City Station 4 months May → August 5 months May → September
4 Lang Station-Hanoi 6 months March → August 6 months May → October
5 Ha Dong Station-Hanoi 6 months March → August 6 months May → October
6 Son Tay Town Station-Hanoi 6 months March → August 6 months May → October
7 Vinh City Station 4 months February → March &
September → October
4 months August → November
8 Dong Hoi City Station 4 months September → December 4 months August → November
9 Da Nang City Station 4 months September → December 5 months August → December
10 Nha Trang City Station 4 months September → December 6 months July → December
11 Buon Ma Thuat City Station 6 months May → October 6 months May → October
12 Can Tho City Station 7 months May → November 7 months May → November
- Comments: The months of the rainy season is not necessarily the month with many rainy days and vice versa.
This shows that the rainfall not spread in the rainy days, but focuses on some heavy rains.
- 19 -
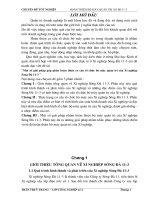
2.3.3. The trend and the variability in the annual rainfall and rainy days in the year
- Using the average trend line and double sliding average line of 5 years to study the trend and the variability
by the time of the survey precipitation value. Figure 2.1, Figure 2.2 below are examples of the trend of variation of
annual rainfall and the number of rainy days in the year at Lang Station-Hanoi City from 1960 to 2010.
- Comments: In all 12 research stations, in recent years, the variation of annual rainfall H
year
and the number of
rainy days become greater, more different and more unusual, appearing extremely big values in recent years.
x
y
1
3
2
x
y
1
3
2
1-Actual measurements; 2-Average trends; 3-Double sliding average
of 5 years
Sudden big values appeared in recent years
Figure 2.1: Variation trends in
annual rainfall H
annual
at Lang
Station-Hanoi City from 1960 -
2010
Figure 2.2: Variation trends in the
number of rainy days in the year at
Lang Station-Hanoi City from
1960 - 2010
‘‘ ’’
- 20 -
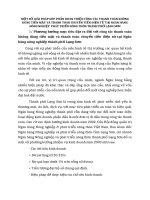
2.3.4. Trends and variability of the biggest daily rainfall H
day
max
and the biggest calculated rainfall intensity in
the year a
T
max
. The extreme sudden variation due to effects of the climate change phenomena.
x
y
1
3
2
x
y
1
3
2
1-Actual measurements; 2-Average trends; 3-Double sliding average
of 5 years
Sudden big values appeared in recent years
Figure 2.3: Variation trends H
day
max
at Lang Station-Hanoi City from
1960 - 2010
Figure 2.4: Variation trend a
T
max
at
T= 60ph at Lang Station-Hanoi
City from 1960 - 2010
- Purposes: comparing and clarifying the rules of change in two important rain parameters in calculating design
flood flow of small drainage works on the roads H
day
max
and a
T
max
, assessing the difference between them. This
research is especially needed to determine the calculated daily rainfall H
n,p
according to the design frequency and
calculated rain intensity interval a
T,p
at the design frequency in chapters 3 and 4 in handling issues of heavy rain. In
addition, from this study, it also suggests proactive measures to respond to climate change phenomena in
computing the design of small drainage works on the roads today in Vietnam.
‘‘ ’’
- 21 -
- Research results: realized at all 12 research stations, parameters H
day
max
and a
T
max
are constantly changing and
not even; in some times, there are sudden significant changes in recent years. At the same station, the trend and
level of time-variaton trend of H
day
max
and a
T
max
are different, the variability of H
day
max
and the highest 24-hour
rainfall in the year H
24h
max
is not identical, the variability of H
24h
max
is not identical to that of the highest rainfall in
the year H
T
max
at other short computational interval T.
+) The extreme interval suddeness of H
day
max
, a
T
max
occurs at all research stations. The extreme segment are in
both values and time of appearance.
./ Extremeness in value: values (H
day
max
)
*
, (a
T
max
)
*
are suddenly big exceeding values H
n,p
, a
T,p
at the design
frequency usually used for small drainage works p = 4%, even exceeding the value at p = 1%.
./ Extremeness on the appearance time: the extreme value (H
day
max
)
*
, (a
T
max
)
*
can occur at the time which is
considered to be in the dry season. Even the time when the value (H
day
max
)
*
, (a
T
max
)
*
is extremely big at the same
station, they are not coincided. For example, for Lang Station-Hanoi City from 1960 - 2010, the time of appearing
the value (H
day
max
)
*
was on 31 October 2008, but the time of appearing the value (a
20ph
max
)
*
was on 03 May 2005,
(a
30ph
max
)
*
on 03 May 2005, while in the year 2005, the highest daily rainfall in the year H
day
max
created fell on 27
September 2005. Therefore, with the arrival of rain heavy rain intensity although mutations do not create value in
the largest daily rainfall, does not create large daily rainfall values are still causing mutations major flood surge for
small drainage structures on roads due to the small basin of small drainage works on the road a short time focus
countries. This is of particular concern in the design calculations minor drainage works on the road.
+) The change of the highest rainfall in the year H
day
max
, the rain intensity of the highest calculated interval in
the year a
T
max
in recent years make the value H
n,p
, a
T,p
under the frequency set with the sequence of the actual rain
measuremens collected up to 2010 tend to increase compared with the calculation result H
n,p
, a
T,p
with the sequence
of actual rain measurements up to years backward and results make the calculated value Q
p
increase.
- 22 -
2.3.5. Average value in many years
X and scattering coefficient Cv, hệ bias coefficient Cs of H
day
max
and a
T
max
.
- Purposes: This research serves for computing and defining H
n,p
, a
T,p
under the design frequency in chapters 3
and 4 in estimating statistical parameters; in determining the years of necessary observation and sampling n
yc
to
ensure the sampling error because the more statistical sequences H
day
max
, a
T
max
have the coefficient Cv, the longer the
required years of observation n
yc
are in order to ensure the calculated results H
n,p
, a
T,p
are reliable. The rate Cs
/
Cv is
also a condition for making decision on selecting a suitable probability distribution rule when calculating and
determining H
n,p
, a
T,p
to gain the best results. In addition to values X, Cv, Cs, they also relect the nature of change
by the time of the parameter H
day
max
, a
T
max
that we need to research, compare and clarify.
- Research results at 12 meteorological stations from 1960 - 2010: the highest daily rainfall has the average
value H
day
max
from 89.31 - 237.46 mm, coefficient Cv = 0.24 - 0.55, Cs = 0.34 - 2.99, Cs/Cv = 1.4 - 5.7; the highest
rain density in the year a
T
max
at intervals T = 5mins – 1440mins with the average value a
T
max
from 3.01 - 0.07
mm/min, Cv = 0.18 - 0.63, Cs = (-0.25) - 3.58, Cs/Cv = 0.05 - 8.0, with the same station coefficients Cv, Cs of a
T
max
, the shorter intervals T are, the smaller they have values and vice versa.
2.3.6. Cycle of large-small-medium changes of H
day
max
and a
T
max
.
- Purposes: This study serves for testing the representation of the period of sampling of the statistical data
sequence H
day
max,
a
T
max
included in the calculation of the frequency to determine H
n,p
, a
T,p
in chapters 3 and 4. They
are deemed to have the representativeness, reflecting the approximate accuracy in line with the general change rule,
then the overall sampling period H
day
max
, a
T
max
must have the number of years in the heavy rain period and some
years in the light rain period in succession. Additionally, researching the cycle of changes also reflects the over-
time variation of H
day
max
, a
T
max
that we need to research compare, and clarify.
- 23 -
+/ Time of high
values: (1983 - 1994),
(2007 - 2010).
+/ Time of small
values: (1956 - 1983),
(1999 -2007).
+/ Average time:
(1994 - 1999).
+/ With 2 cycles.
+/ Time of high
values: (1996 - 2010).
+/ Time of small
values: (1986 - 1996).
+/ Average time:
(1961 - 1986).
+/ With 01 cycle.
- In order to determine the change cycle of H
day
max
, a
T
max
, we use the standard error comulative line S
t
= Σ(K
i
–
1) với K
i
= (X
i
/X) as the variable coefficient. On the standard error comulative line S
t
, if the general trends are
Figure 2.7: Cycle of changing the biggest daily rainfall in the year H
day
max
at
Lang Station – Hanoi City from 1960 – 2010
Figure 2.8: Cycle of changing the biggest rain intensity in the year a
T
max
at
the computational interval T = 30 mins at Lang Station-Hanoi from 1960 –
2010
- 24 -
considered, we will realize there are groups of 5 cumulative lines always rising up corresponding to the heavy rain
periods, or declining corresponding to the light rain periods or always in parallel corresponding to the medium rain
periods. A rain cycle includes a period of heavy rain and a little rainy period or a period of heavy rain, a period of
little rain and a period of continuous rain average. For example, in above Figure 2.7, Figure 2.8.
- Comments: H
day
max
, a
T
max
change with cycles; the length of a change cycle of them ranges from 20 to 50 years.
In the same station, the change cycle of H
day
max
and a
T
max
are not the same, at the calculation interval, the shorter T
is, the more different they are and vice versa. With the length sequence of survey data up to 2010 at the selected
meteorological stations, H
day
max
and a
T
max
at T = 5mins – 1440mins reach at least 01 change cycle, even >= 2 change
cycles.
2.3.7. Correlation of changes in value and time of together appearance of H
day
max
and a
T
max
.
- Comparing the change in values: using the graph standards to compare the variation coefficient K
i
of H
day
max
and a
T
max
.
- 25 -
- Comparing the appearance time within the same date in the year of H
day
max
and a
T
max
: assessed with the color
table.
Figure 2.9: Graph comparing the change in values between H
ngày
max
and a
T
max
at the
calculation interval T = 5
→
1440mins at Lang Station-Hanoi from 1960 - 2010