nghiên cứu một số đặc điểm sinh học và biện pháp kỹ thuật chọn tạo giống và gây trồng rừng giổi (michelia mediocris dandy) phu luc LA (gui BGD)
Bạn đang xem bản rút gọn của tài liệu. Xem và tải ngay bản đầy đủ của tài liệu tại đây (894.16 KB, 58 trang )
151
PHẦN PHỤ LỤC
152
Phụ lục 01. Một số hình ảnh về hoạt động nghiên cứu của đề tài về cây Giổi xanh
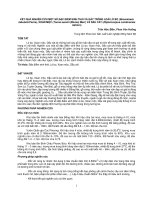
Ảnh 1a,b,c. Điều tra Giổi xanh tại rừng tự nhiên Gia Lai
Ảnh 2a,b,c. Điều tra tái sinh Giổi xanh tại Thanh Hóa
Ảnh 3a,b. Thu hái hạt giống Giổi xanh
a
b
c
a
b c
a
b
153
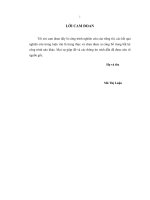
Ảnh 4a,b. Chế biến và xử lý hạt
giống Giổi xanh
Ảnh 5a,b,c. Gieo ươm Giổi xanh tại Hoành Bồ, Quảng Ninh
Ảnh 6a,b,c. Thí nghiệm về che bóng Giổi xanh ở vườn ươm
a b
a
bc
a b c
154
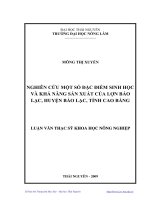
Ảnh 7a,b. Gieo ươm và ghép Giổi xanh
Ảnh 8a,b,c,d. Xác định độ tàn che tầng cây cao bằng máy đo độ tàn che cầm tay
Ảnh 9a,b,c,d. Khảo nghiệm gia đình cây trội, xuất xứ Giổi xanh tại Hoành Bồ
a b
a
b
c
d
a b c
155
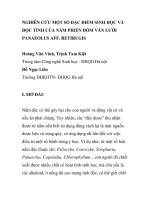
Ảnh 10a,b. Trồng rừng Giổi xanh dưới tán rừng phục hồi nghèo kiệt và
rừng trồng Thông xen Keo
Ảnh 11a,b. Sinh trưởng của Giổi xanh trồng 6 năm tuổi tại Chi Lăng, Lạng
Sơn
b
a
ba
156
Phụ lục 02. Danh mục tên khoa học một số loài cây
TT Tên Việt Nam Tên khoa học
1 Bứa Garcinia oblongifolia Champ.Ex Benth
2 Chân chim tám lá Schefflera heptaphylla (L.) Frodin
3 Chẹo tía Engethardtia roxburghiana Wall
4 Chò xót Schima superba (DC.) Korth
5 Chôm chôm Nephelium lappaceum L
6 Cóc đá Garuga pierrei Guillaumin
7 Côm tầng Elaeocarpus chinensis (G&Ch.) Hook
8 Dẻ Bắc Giang Lithocarpus bacgiangensis (Hickel & A. Camus)
9 Dẻ cọng mảnh Lithocarpus stenopus (Hickel & A.Camus)
10 Dẻ gai Lithocarpus ducampii (Hickel & A.Camus)
11 Dung Symplocos cochinchinensis
12 Giổi ăn quả Michelia tonkinensis
13 Giổi nhung Paramichelia braiannesis (Gagnep.) Dandy
14 Giổi xanh Michelia mediocris Dandy
15 Gội Aglaia gigantea
16 Hà nụ Ixonanthes reticulata Jack.
17 Kha thụ nhiếm Castanopsis hystrix A. DC
18 Kháo Machilus sp
19 Kháo hoa thưa Machilus parviflora Meissn.
20 Lão mai Gomphia striata (Tiegh.) C. F. Wei
21 Lấu tuyến Psychotria poilanei Pitard
22 Lim xẹt Peltophorum pterocarpum
23 Máu chó kính Knema lenta Warb.
24 Máu chó lá lớn Knema pierrei Warb.
25 Nang Alangium ridleyi King
26 Ngát Gironniera subequalis Plarch
27 Nhọ nồi Diospyros eriantha Champ. ex Benth.
28 Phân mã Archidendronmchevalieri (Kosterm.) I.C. Nielsen
29 Ràng ràng mít Ormosia balansae Drake
30 Re hương Cinamomum parthenoxylon Meisn
31 Sâng Amesiodendron chinensis
32 Sến núi cao Madhuca alpinia (Chev.) Chev
33 Sồi Lithocarpus sp
34 Táu mật Vatica tonkinensis
35 Thông nàng Dacrycarpus imbricatus
36 Thông tre Podocarpus neriifolius D. Don
37 Trám trắng Canarium album
38 Trâm Syzygium sp
39 Vạng trứng Endospermum sinensis
40 Vối thuốc Schima wallichii
41 Xoài cọng dài Mangifera longipes Griff.
157
42 Xoan đào Prunus arborea (Blume) Kalkm
43 Xoay Dialium cochinchinense Pierre
158
Phụ lục 03. Quan hệ giữa sinh trưởng, tăng trưởng với vị thế xã hội tán Giổi xanh
• Quan hệ giữa H
vn
và V
Model Summary
,754 ,568 ,566 3,305
R R Square
Adjusted
R Square
Std. Error of
the Estimate
The independent variable is V.
ANOVA
3135,941 1 3135,941 287,139 ,000
2380,853 218 10,921
5516,794 219
Regression
Residual
Total
Sum of
Squares df Mean Square F Sig.
The independent variable is V.
Coef f icients
3,280 ,194 ,754 16,945 ,000
8,986 ,737 12,197 ,000
V
(Constant)
B Std. Error
Unstandardiz ed
Coefficients
Beta
Standardiz ed
Coefficients
t Sig.
• Quan hệ giữa D
1,3
và V
Model Summary and Paramet er Est imat es
Dependent Variable: D
,259 76,027 1 218 ,000 5,949 7,443
,221 61,680 1 218 ,000 9,473 19,254
,158 40,963 1 218 ,000 44,535 -35,349
,267 39,573 2 217 ,000 15,973 ,459 1,057
,267 26,283 3 216 ,000 13,040 4,201 - ,275 ,141
,298 92,608 1 218 ,000 12,067 1,274
,267 79,447 1 218 ,000 13,277 ,641
,201 54,876 1 218 ,000 3,763 - 1,206
,298 92,608 1 218 ,000 2,490 ,242
,298 92,608 1 218 ,000 12,067 ,242
,298 92,608 1 218 ,000 ,083 ,785
Equation
Linear
Logarithmic
Inverse
Quadratic
Cubic
Compound
Power
S
Growth
Exponential
Logistic
R Square F df1 df2 Sig.
Model Summary
Constant b1 b2 b3
Parameter Estimates
The independent variable is V.
159
Model Summary
,546 ,298 ,295 ,429
R R Square
Adjusted
R Square
Std. Error of
the Estimate
The independent variable is V.
ANOVA
17,050 1 17,050 92,608 ,000
40,137 218 ,184
57,187 219
Regression
Residual
Total
Sum of
Squares df Mean Square F Sig.
The independent variable is V.
Coef f icients
1,274 ,032 1,726 39,786 ,000
12,067 1,154 10,455 ,000
V
(Constant)
B Std. Error
Unstandardized
Coefficients
Beta
Standardiz ed
Coefficients
t Sig.
The dependent variable is ln(D).
• Quan hệ giữa Z
D
và V
Model Summary and Paramet er Est imat es
Dependent Variable: Zd
,379 56,829 1 93 ,000 - ,175 ,213
,367 53,890 1 93 ,000 - ,169 ,625
,294 38,724 1 93 ,000 1,025 - 1,340
,385 28,782 2 92 ,000 -,404 ,367 -,023
,427 22,579 3 91 ,000 ,946 -1,185 ,503 -,054
,520 100,830 1 93 ,000 ,081 1,619
,548 112,805 1 93 ,000 ,077 1,474
,500 92,982 1 93 ,000 ,310 - 3,370
,520 100,830 1 93 ,000 - 2,509 ,482
,520 100,830 1 93 ,000 ,081 ,482
,520 100,830 1 93 ,000 12,297 ,618
Equation
Linear
Logarithmic
Inverse
Quadratic
Cubic
Compound
Power
S
Growth
Exponential
Logistic
R Square F df1 df2 Sig.
Model Summary
Constant b1 b2 b3
Parameter Estimates
The independent variable is V.
160
Model Summary
,740 ,548 ,543 ,516
R R Square
Adjusted
R Square
Std. Error of
the Estimate
The independent variable is V.
ANOVA
30,021 1 30,021 112,805 ,000
24,751 93 ,266
54,772 94
Regression
Residual
Total
Sum of
Squares df Mean Square F Sig.
The independent variable is V.
Coef f icient s
1,474 ,139 ,740 10,621 ,000
,077 ,014 5,647 ,000
ln(V)
(Constant)
B Std. Error
Unstandardiz ed
Coefficients
Beta
Standardized
Coefficients
t Sig.
The dependent variable is ln(Zd).
161
Phụ lục 04. Quan hệ giữa H-D Giổi xanh
Tại Thanh Hóa
Model Summary and Parameter Estimates
Dependent Variable: Hvn
,817 174,469 1 39 ,000 15,828 ,154
,919 441,967 1 39 ,000 - 6,476 7,786
,841 206,541 1 39 ,000 29,413 - 261,537
,898 168,061 2 38 ,000 10,656 ,356 -,002
,918 138,215 3 37 ,000 5,843 ,673 - ,008 3,55E-005
,727 103,756 1 39 ,000 16,575 1,007
,727 103,756 1 39 ,000 2,808 ,007
,727 103,756 1 39 ,000 16,575 ,007
,727 103,756 1 39 ,000 ,060 ,993
Equation
Linear
Logarithmic
Inverse
Quadratic
Cubic
Compound
Growth
Exponential
Logistic
R Square F df1 df2 Sig.
Model Summary
Constant b1 b2 b3
Parameter Estimates
The independent variable is D1,3.
Model Summary
,959 ,919 ,917 ,829
R R Square
Adjusted
R Square
Std. Error of
the Estimate
The independent variable is D1,3.
ANOVA
303,903 1 303,903 441,967 ,000
26,817 39 ,688
330,720 40
Regression
Residual
Total
Sum of
Squares df Mean Square F Sig.
The independent variable is D1,3.
Coef f icient s
7,786 ,370 ,959 21,023 ,000
- 6,476 1,424 - 4,547 ,000
ln(D1,3)
(Constant)
B Std. Error
Unstandardiz ed
Coefficients
Beta
Standardiz ed
Coefficients
t Sig.
162
Tại Gia Lai
Model Summary
,919 ,845 ,841 2,001
R R Square
Adjusted
R Square
Std. Error of
the Estimate
The independent variable is D1,3.
ANOVA
848,816 1 848,816 211,888 ,000
156,233 39 4,006
1005,049 40
Regression
Residual
Total
Sum of
Squares df Mean Square F Sig.
The independent variable is D1,3.
Coef f icient s
8,755 ,601 ,919 14,556 ,000
- 10,593 2,143 - 4,943 ,000
ln(D1,3)
(Constant)
B Std. Error
Unstandardized
Coefficients
Beta
Standardiz ed
Coefficients
t Sig.
Tại Lâm Đồng
Model Summary and Paramet er Est imat es
Dependent Variable: Hvn
,682 130,659 1 61 ,000 9,307 ,419
,694 138,298 1 61 ,000 - 15,506 11,267
,616 97,926 1 61 ,000 30,596 - 229,160
,706 72,148 2 60 ,000 5,156 ,730 - ,005
,710 48,081 3 59 ,000 9,218 ,250 ,012 ,000
,603 92,540 1 61 ,000 11,313 1,021
,660 118,498 1 61 ,000 3,107 ,578
,625 101,638 1 61 ,000 3,518 -12,142
,603 92,540 1 61 ,000 2,426 ,021
,603 92,540 1 61 ,000 11,313 ,021
,603 92,540 1 61 ,000 ,088 ,979
Equation
Linear
Logarithmic
Inverse
Quadratic
Cubic
Compound
Power
S
Growth
Exponential
Logistic
R Square F df1 df2 Sig.
Model Summary
Constant b1 b2 b3
Parameter Estimates
The independent variable is D1,3.
163
Model Summary
,833 ,694 ,689 3,086
R R Square
Adjusted
R Square
Std. Error of
the Estimate
The independent variable is D1,3.
ANOVA
1316,674 1 1316,674 138,298 ,000
580,754 61 9,521
1897,429 62
Regression
Residual
Total
Sum of
Squares df Mean Square F Sig.
The independent variable is D1,3.
Coef f icient s
11,267 ,958 ,833 11,760 ,000
- 15,506 3,008 - 5,155 ,000
ln(D1,3)
(Constant)
B Std. Error
Unstandardiz ed
Coefficients
Beta
Standardiz ed
Coefficients
t Sig.
Phụ lục 05. Ảnh hưởng của độ tàn che tới tỷ lệ sống cây Giổi xanh 1 năm tuổi
164
Descriptives
TLS%
CT N Mean
Std.
Deviation
Std.
Error
95% Confidence
Interval for Mean
Minimu
m
Maximu
m
Lower
Bound
Upper
Bound
1 3 36,667 ,5774 ,3333 35,232 38,101 36,0 37,0
2 3 38,667 1,1547 ,6667 35,798 41,535 38,0 40,0
3 3 36,333 1,1547 ,6667 33,465 39,202 35,0 37,0
4 3 30,000 2,6458 1,5275 23,428 36,572 28,0 33,0
Tota
l
12 35,417 3,6546 1,0550 33,095 37,739 28,0 40,0
Test of Homogeneity of Variances
TLS%
Levene
Statistic
df1 df2 Sig.
3,963 3 8 ,053
ANOVA
TLS%
Sum of
Squares
df
Mean
Square
F Sig.
Between
Groups
126,917 3 42,306 16,922 ,001
Within
Groups
20,000 8 2,500
Total 146,917 11
Tỷ lệ sống %
CT N
Subset for alpha = .05
1 2
Duncan(a) 4 3 30,000
3 3 36,333
1 3 36,667
2 3 38,667
Sig. 1,000 ,121
Means for groups in homogeneous subsets are displayed.
a Uses Harmonic Mean Sample Size = 3,000.
Phụ lục 06. Ảnh hưởng của độ tàn che tới tỷ lệ sống cây Giổi xanh 2 năm tuổi
165
Descriptives
TLS2%
CT N Mean
Std.
Deviation
Std.
Error
95% Confidence
Interval for Mean
Minimu
m
Maximu
m
Lower
Bound
Upper
Bound
1 3 35,0000 1,00000 ,57735 32,5159 37,4841 34,00 36,00
2 3 35,0000 1,00000 ,57735 32,5159 37,4841 34,00 36,00
3 3 35,0000 2,00000 1,15470 30,0317 39,9683 33,00 37,00
4 3 30,0000 2,64575 1,52753 23,4276 36,5724 28,00 33,00
Total 12 33,7500 2,73446 ,78937 32,0126 35,4874 28,00 37,00
Test of Homogeneity of Variances
TLS2%
Levene
Statistic
df1 df2 Sig.
1,630 3 8 ,258
ANOVA
TLS2%
Sum of
Squares
df
Mean
Square
F Sig.
Between
Groups
56,250 3 18,750 5,769 ,021
Within
Groups
26,000 8 3,250
Total 82,250 11
TLS2%
CT N
Subset for alpha = .05
1 2
Duncan(a) 4 3 30,0000
1 3 35,0000
2 3 35,0000
3 3 35,0000
Sig. 1,000 1,000
Means for groups in homogeneous subsets are displayed.
a Uses Harmonic Mean Sample Size = 3,000.
Phụ lục 07. Ảnh hưởng của độ tàn che tới tỷ lệ sống cây Giổi xanh 3 năm tuổi
Descriptives
166
TLS3%
CT N Mean
Std.
Deviation
Std.
Error
95% Confidence
Interval for Mean
Minimu
m
Maximu
m
Lower
Bound
Upper
Bound
1 3 33,000 1,0000 ,5774 30,516 35,484 32,0 34,0
2 3 32,667 ,5774 ,3333 31,232 34,101 32,0 33,0
3 3 32,333 ,5774 ,3333 30,899 33,768 32,0 33,0
4 3 30,000 2,6458 1,5275 23,428 36,572 28,0 33,0
Total 12 32,000 1,7581 ,5075 30,883 33,117 28,0 34,0
Test of Homogeneity of Variances
TLS3%
Levene
Statistic
df1 df2 Sig.
4,772 3 8 ,034
ANOVA
TLS3%
Sum of
Squares
df
Mean
Square
F Sig.
Between
Groups
16,667 3 5,556 2,564 ,128
Within
Groups
17,333 8 2,167
Total 34,000 11
TLS3%
CT N
Subset for alpha = .05
1 2
Duncan(a) 4 3 30,000
3 3 32,333 32,333
2 3 32,667 32,667
1 3 33,000
Sig. ,066 ,609
Means for groups in homogeneous subsets are displayed.
a Uses Harmonic Mean Sample Size = 3,000.
Phụ lục 08. Ảnh hưởng của độ tàn che tới sinh trưởng Giổi xanh 1 năm tuổi
167
Descript ives
3 10,100 ,0000 ,0000 10,100 10,100 10,1 10,1
3 9,800 ,1000 ,0577 9,552 10,048 9,7 9,9
3 10,133 ,3786 ,2186 9,193 11,074 9,7 10,4
3 9,833 ,2309 ,1333 9,260 10,407 9,7 10,1
12 9,967 ,2498 ,0721 9,808 10,125 9,7 10,4
3 76,467 ,7506 ,4333 74,602 78,331 75,7 77,2
3 82,767 3,1533 1,8206 74,933 90,600 80,0 86,2
3 78,833 1,9858 1,1465 73,900 83,766 77,4 81,1
3 72,067 5,1859 2,9941 59,184 84,949 68,4 78,0
12 77,533 4,8896 1,4115 74,427 80,640 68,4 86,2
1,00
2,00
3,00
4,00
Total
1,00
2,00
3,00
4,00
Total
D001
Hvn1
N Mean Std. Deviation Std. Error Lower Bound Upper Bound
95% Confidence Interval for
Mean
Minimum Maximum
Test of Homogeneity of Variances
Levene
Statistic df1 df2 Sig.
D00
1
7,063 3 8 ,012
Hvn
1
4,095 3 8 ,059
ANOVA
,273 3 ,091 1,763 ,232
,413 8 ,052
,687 11
180,300 3 60,100 5,815 ,021
82,687 8 10,336
262,987 11
Between Groups
Within Groups
Total
Between Groups
Within Groups
Total
D001
Hvn1
Sum of
Squares df Mean Square F Sig.
168
D001
3 9,800
3 9,833
3 10,100
3 10,133
,130
CT
2,00
4,00
1,00
3,00
Sig.
Duncan
a
N 1
Subset
for alpha
= .05
Means for groups in homogeneous subsets are displayed.
Uses Harmonic Mean Sample Siz e = 3,000.
a.
Hvn1
3 72,067
3 76,467 76,467
3 78,833
3 82,767
,132 ,050
CT
4,00
1,00
3,00
2,00
Sig.
Duncan
a
N 1 2
Subset for alpha = .05
Means for groups in homogeneous subsets are displayed.
Uses Harmonic Mean Sample Size = 3,000.
a.
169
Phụ lục 09. Ảnh hưởng của độ tàn che tới sinh trưởng Giổi xanh 2 năm tuổi
Descript ives
3 15,273 1,3450 ,7765 11,932 18,614 14,0 16,7
3 25,087 1,0152 ,5861 22,565 27,609 24,4 26,3
3 29,433 2,0117 1,1615 24,436 34,431 27,9 31,7
3 9,933 ,4605 ,2659 8,789 11,077 9,4 10,3
12 19,932 8,1451 2,3513 14,757 25,107 9,4 31,7
3 131,900 11,8621 6,8486 102,433 161,367 121,1 144,6
3 168,807 4,8887 2,8225 156,662 180,951 164,6 174,2
3 191,967 6,6395 3,8333 175,473 208,460 186,0 199,1
3 118,653 3,2309 1,8653 110,627 126,679 116,6 122,4
12 152,832 31,0679 8,9685 133,092 172,571 116,6 199,1
1,00
2,00
3,00
4,00
Total
1,00
2,00
3,00
4,00
Total
D002
Hvn2
N Mean Std. Deviation Std. Error Lower Bound Upper Bound
95% Confidence Interval for
Mean
Minimum Maximum
Test of Homogeneit y of Variances
2,198 3 8 ,166
1,666 3 8 ,251
D002
Hvn2
Levene
Statistic df1 df2 Sig.
ANOVA
715,567 3 238,522 134,407 ,000
14,197 8 1,775
729,764 11
10179,126 3 3393,042 61,936 ,000
438,261 8 54,783
10617,387 11
Between Groups
Within Groups
Total
Between Groups
Within Groups
Total
D002
Hvn2
Sum of
Squares df Mean Square F Sig.
170
D002
3 9,933
3 15,273
3 25,087
3 29,433
1,000 1,000 1,000 1,000
CT
4,00
1,00
2,00
3,00
Sig.
Duncan
a
N 1 2 3 4
Subset for alpha = .05
Means for groups in homogeneous subsets are displayed.
Uses Harmonic Mean Sample Siz e = 3,000.
a.
Hvn2
3 118,653
3 131,900
3 168,807
3 191,967
,060 1,000 1,000
CT
4,00
1,00
2,00
3,00
Sig.
Duncan
a
N 1 2 3
Subset for alpha = .05
Means for groups in homogeneous subsets are displayed.
Uses Harmonic Mean Sample Siz e = 3,000.
a.
171
Phụ lục 10. Ảnh hưởng của độ tàn che tới sinh trưởng Giổi xanh 3 năm tuổi
Descriptives
3 49,667 1,8583 1,0729 45,050 54,283 47,6 51,2
3 45,900 1,7349 1,0017 41,590 50,210 44,4 47,8
3 39,200 ,8544 ,4933 37,078 41,322 38,4 40,1
3 33,833 1,8583 1,0729 29,217 38,450 32,3 35,9
12 42,150 6,5129 1,8801 38,012 46,288 32,3 51,2
3 388,267 13,5434 7,8193 354,623 421,910 373,6 400,3
3 378,300 7,7737 4,4881 358,989 397,611 370,9 386,4
3 301,300 5,0478 2,9143 288,761 313,839 296,7 306,7
3 270,467 12,3249 7,1158 239,850 301,083 261,4 284,5
12 334,583 52,9818 15,2945 300,920 368,246 261,4 400,3
1,00
2,00
3,00
4,00
Total
1,00
2,00
3,00
4,00
Total
D003
Hvn3
N Mean Std. Deviation Std. Error Lower Bound Upper Bound
95% Confidence Interval for
Mean
Minimum Maximum
Test of Homogeneit y of Variances
,837 3 8 ,510
1,314 3 8 ,336
D003
Hvn3
Levene
Statistic df1 df2 Sig.
ANOVA
445,297 3 148,432 55,767 ,000
21,293 8 2,662
466,590 11
30035,323 3 10011,774 95,070 ,000
842,473 8 105,309
30877,797 11
Between Groups
Within Groups
Total
Between Groups
Within Groups
Total
D003
Hvn3
Sum of
Squares df Mean Square F Sig.
172
D003
3 33,833
3 39,200
3 45,900
3 49,667
1,000 1,000 1,000 1,000
CT
4,00
3,00
2,00
1,00
Sig.
Duncan
a
N 1 2 3 4
Subset for alpha = .05
Means for groups in homogeneous subsets are displayed.
Uses Harmonic Mean Sample Siz e = 3,000.
a.
Hvn3
3 270,467
3 301,300
3 378,300
3 388,267
1,000 1,000 ,268
CT
4,00
3,00
2,00
1,00
Sig.
Duncan
a
N 1 2 3
Subset for alpha = .05
Means for groups in homogeneous subsets are displayed.
Uses Harmonic Mean Sample Siz e = 3,000.
a.
173
Phụ lục 11. Ảnh hưởng của độ tàn che tới sinh trưởng cây Giổi xanh 4 năm tuổi
Descript ives
3 7,967 ,5508 ,3180 6,599 9,335 7,6 8,6
3 6,500 ,1732 ,1000 6,070 6,930 6,4 6,7
3 5,367 ,0577 ,0333 5,223 5,510 5,3 5,4
3 3,600 ,1000 ,0577 3,352 3,848 3,5 3,7
12 5,858 1,6866 ,4869 4,787 6,930 3,5 8,6
3 5,200 ,3464 ,2000 4,339 6,061 4,8 5,4
3 4,433 ,2082 ,1202 3,916 4,950 4,2 4,6
3 4,067 ,1528 ,0882 3,687 4,446 3,9 4,2
3 2,933 ,1155 ,0667 2,646 3,220 2,8 3,0
12 4,158 ,8743 ,2524 3,603 4,714 2,8 5,4
1,00
2,00
3,00
4,00
Total
1,00
2,00
3,00
4,00
Total
D004
Hvn4
N Mean Std. Deviation Std. Error Lower Bound Upper Bound
95% Confidence Interval for
Mean
Minimum Maximum
Test of Homogeneit y of Variances
8,506 3 8 ,007
2,815 3 8 ,108
D004
Hvn4
Levene
Statistic df1 df2 Sig.
ANOVA
30,596 3 10,199 117,676 ,000
,693 8 ,087
31,289 11
8,009 3 2,670 53,394 ,000
,400 8 ,050
8,409 11
Between Groups
Within Groups
Total
Between Groups
Within Groups
Total
D004
Hvn4
Sum of
Squares df Mean Square F Sig.
D004
3 3,600
3 5,367
3 6,500
3 7,967
1,000 1,000 1,000 1,000
CT
4,00
3,00
2,00
1,00
Sig.
Duncan
a
N 1 2 3 4
Subset for alpha = .05
Means for groups in homogeneous subsets are displayed.
Uses Harmonic Mean Sample Siz e = 3,000.
a.
Hvn4
3 2,933
3 4,067
3 4,433
3 5,200
1,000 ,079 1,000
CT
4,00
3,00
2,00
1,00
Sig.
Duncan
a
N 1 2 3
Subset for alpha = .05
Means for groups in homogeneous subsets are displayed.
Uses Harmonic Mean Sample Siz e = 3,000.
a.
174
Phụ lục 12. Ảnh hưởng của độ tàn che tới sinh trưởng cây Giổi xanh 6 năm tuổi
Descriptives
3 10,033 ,2082 ,1202 9,516 10,550 9,8 10,2
3 6,533 ,0577 ,0333 6,390 6,677 6,5 6,6
3 4,833 ,1155 ,0667 4,546 5,120 4,7 4,9
9 7,133 2,2995 ,7665 5,366 8,901 4,7 10,2
3 8,967 ,0577 ,0333 8,823 9,110 8,9 9,0
3 6,867 ,0577 ,0333 6,723 7,010 6,8 6,9
3 5,867 ,0577 ,0333 5,723 6,010 5,8 5,9
9 7,233 1,3711 ,4570 6,179 8,287 5,8 9,0
1,00
2,00
3,00
Total
1,00
2,00
3,00
Total
D6
Hvn6
N Mean Std. Deviation Std. Error Lower Bound Upper Bound
95% Confidence Interval for
Mean
Minimum Maximum
Test of Homogeneit y of Variances
3,167 2 6 ,115
,000 2 6 1,000
D6
Hvn6
Levene
Statistic df1 df2 Sig.
ANOVA
42,180 2 21,090 1054,500 ,000
,120 6 ,020
42,300 8
15,020 2 7,510 2253,000 ,000
,020 6 ,003
15,040 8
Between Groups
Within Groups
Total
Between Groups
Within Groups
Total
D6
Hvn6
Sum of
Squares df Mean Square F Sig.
D6
3 4,833
3 6,533
3 10,033
1,000 1,000 1,000
CT
3,00
2,00
1,00
Sig.
Duncan
a
N 1 2 3
Subset for alpha = .05
Means for groups in homogeneous subsets are displayed.
Uses Harmonic Mean Sample Siz e = 3,000.
a.
Hvn6
3 5,867
3 6,867
3 8,967
1,000 1,000 1,000
CT
3,00
2,00
1,00
Sig.
Duncan
a
N 1 2 3
Subset for alpha = .05
Means for groups in homogeneous subsets are displayed.
Uses Harmonic Mean Sample Siz e = 3,000.
a.
175
Phụ lục 13. Ảnh hưởng của độ tàn che tới sinh trưởng cây Giổi xanh 8 năm tuổi
Descript ives
3 6,133 ,1155 ,0667 5,846 6,420 6,0 6,2
3 4,233 ,1528 ,0882 3,854 4,613 4,1 4,4
3 2,667 ,2517 ,1453 2,042 3,292 2,4 2,9
9 4,344 1,5117 ,5039 3,182 5,506 2,4 6,2
3 7,567 ,2082 ,1202 7,050 8,084 7,4 7,8
3 5,300 ,1732 ,1000 4,870 5,730 5,2 5,5
3 3,333 ,0577 ,0333 3,190 3,477 3,3 3,4
9 5,400 1,8398 ,6133 3,986 6,814 3,3 7,8
1,00
2,00
3,00
Total
1,00
2,00
3,00
Total
D8
Hvn8
N Mean Std. Deviation Std. Error Lower Bound Upper Bound
95% Confidence Interval for
Mean
Minimum Maximum
Test of Homogeneit y of Variances
,867 2 6 ,467
2,897 2 6 ,132
D8
Hvn8
Levene
Statistic df1 df2 Sig.
ANOVA
18,082 2 9,041 271,233 ,000
,200 6 ,033
18,282 8
26,927 2 13,463 526,826 ,000
,153 6 ,026
27,080 8
Between Groups
Within Groups
Total
Between Groups
Within Groups
Total
D8
Hvn8
Sum of
Squares df Mean Square F Sig.
D8
3 2,667
3 4,233
3 6,133
1,000 1,000 1,000
CT
3,00
2,00
1,00
Sig.
Duncan
a
N 1 2 3
Subset for alpha = .05
Means for groups in homogeneous subsets are displayed.
Uses Harmonic Mean Sample Siz e = 3,000.
a.
Hvn8
3 3,333
3 5,300
3 7,567
1,000 1,000 1,000
CT
3,00
2,00
1,00
Sig.
Duncan
a
N 1 2 3
Subset for alpha = .05
Means for groups in homogeneous subsets are displayed.
Uses Harmonic Mean Sample Siz e = 3,000.
a.