fracture porosity of naturally fracture reservoir
Bạn đang xem bản rút gọn của tài liệu. Xem và tải ngay bản đầy đủ của tài liệu tại đây (411.22 KB, 13 trang )
Copyright 2006, Society of Petroleum Engineers
This paper was prepared for presentation at the First International Oil Conference and Exhibition
in Mexico held in Cancun, Mexico, 31 August–2 September 2006.
This paper was selected for presentation by an SPE Program Committee following review of
information contained in an abstract submitted by the author(s). Contents of the paper, as
presented, have not been reviewed by the Society of Petroleum Engineers and are subject to
correction by the author(s). The material, as presented, does not necessarily reflect any
position of the Society of Petroleum Engineers, its officers, or members. Papers presented at
SPE meetings are subject to publication review by Editorial Committees of the Society of
Petroleum Engineers. Electronic reproduction, distribution, or storage of any part of this paper
for commercial purposes without the written consent of the Society of Petroleum Engineers is
prohibited. Permission to reproduce in print is restricted to an abstract of not more than
300 words; illustrations may not be copied. The abstract must contain conspicuous
acknowledgment of where and by whom the paper was presented. Write Librarian, SPE, P.O.
Box 833836, Richardson, TX 75083-3836, U.S.A., fax 01-972-952-9435.
Abstract
The storage capacity ratio, ω, measures the flow capacitance
of the secondary porosity and the interporosity flow
parameter, λ, is related to the heterogeneity scale of the
system. Currently, both parameters λ and ω are obtained from
well test data by using the conventional semilog analysis,
type-curve matching or the TDS Technique. Warren and Root
showed how the parameter ω can be obtained from semilog
plots. However, no accurate equation is proposed in the
literature for calculating fracture porosity.
This paper presents an equation for the estimation of the λ
parameter using semilog plots. A new equation for calculating
the storage capacity ratio and fracture porosity from the
pressure derivative is presented. The equations are applicable
to both pressure buildup and pressure drawdown tests. The
interpretation of these pressure tests follows closely the
classification of naturally fractured reservoirs into four types,
as suggested by Nelson
1
.
The paper also discusses new procedures for interpreting
pressure transient tests for three common cases: (a) the
pressure test is too short to observe the early-time radial flow
straight line and only the first straight line is observed, (b) the
pressure test is long enough to observe the late-time radial
flow straight line, but the first straight line is not observed due
to inner boundary effects, such as wellbore storage and
formation damage, and (c) Neither straight line is observed for
the same reasons, but the trough on the pressure derivative is
well defined. Analytical equations are derived in all three
cases for calculating permeability, skin, storage capacity ratio
and interporosity flow coefficient, without using type curve
matching.
In naturally fractured reservoirs, the matrix pore volume,
therefore the matrix porosity is reduced as a result of large
reservoir pressure drop due to oil production. This large
pressure drop causes the fracture pore volume, therefore
fracture porosity, to increase. This behavior is observed
particularly in reservoir where matrix porosity is much greater
than fracture porosity. Fractures in reservoirs are more
vertically than horizontally oriented, and the stress axis on the
formation is also essentially vertical. Under these conditions,
when the reservoir pressure drops, the fractures do not suffer
from the stress caused by the drop. Using these principles, a
new method is introduced for calculating fracture porosity
from the storage capacity ratio, without assuming the total
matrix compressibility is equal to the total fracture
compressibility.
Several numerical examples are presented for illustration
purposes.
Introduction
Nelson
1
identifies four types of naturally fractured reservoirs;
based on the extent the fractures have altered the reservoir
matrix porosity and permeability: In Type 1 reservoirs,
fractures provide the essential reservoir storage capacity and
permeability. Typical Type-1 naturally fractured reservoirs are
the Amal field in Libya, Edison field California, and pre-
Cambrian basement reservoirs in Eastern China. All these
fields contain high fracture density.
In Type 2 naturally fractured reservoirs, fractures provide the
essential permeability, and the matrix provides the essential
porosity, such as in the Monterey fields of California, the
Spraberry reservoirs of West Texas, and Agha Jari and Haft
Kel oil fields of Iran.
In Type 3 naturally fractured reservoirs, the matrix has an
already good primary permeability. The fractures add to the
reservoir permeability and can result in considerable high flow
rates, such as in Kirkuk field of Iraq, Gachsaran field of Iran,
and Dukhan field of Qatar. Nelson includes Hassi Messaoud
(HMD) in this list. While indeed there are several low-
permeability zones in HMD that are fissured; in most zones
however the evidence of fissures is not clear or unproven.
In Type 4 naturally fractured reservoirs, the fractures are filled
with minerals and provide no additional porosity or
permeability. These types of fractures create significant
reservoir anisotropy, and tend to form barriers to fluid flow
and partition formations into relatively small blocks. Nelson
discusses three main factors that can create reservoir
anisotropy with respect to fluid flow: fractures, crossbedding
and stylolite. The anisotropy in Hassi Messaoud field, for
instance, appears to be the result of a non-uniform
combination of all three factors with varying magnitude from
zone to zone. Stylolites, just like fractures, are a secondary
feature. They are defined as irregular planes of discontinuity
between two rock units. Stylolites, which often have fractures
associated with them, occur most frequently in limestone,
SPE 104056
Fracture Porosity of Naturally Fractured Reservoirs
D. Tiab, D.P. Restrepo, and A. Igbokoyi, SPE, U. of Oklahoma
2 SPE 104056
dolomite, and sandstone formations. Mineral-filled fractures
and stylolites can create strong permeability anisotropy within
a reservoir. The magnitude of such permeability is extremely
dependent on the measurement direction, thereby requiring
multiple-well testing. Interference testing is ideal for
quantifying reservoir anisotropy and heterogeneity, because
they are more sensitive to directional variations of reservoir
properties, such as permeability, which is the case of type 4
naturally fractured reservoirs.
It is important to take this classification into consideration
when interpreting a pressure transient analysis for the purpose
of identifying the type of fractured reservoir and its
characteristics. Each type of naturally fractured reservoir may
require a different development strategy. Ershaghi
2
reports
that: (a) Type 1 fractured reservoirs, for instance, may exhibit
sharp production decline and can develop early water and gas
coning; (b) Recognizing that the reservoir is a type 2 will
impact any infill drilling or the selection of improved recovery
process; (c) In Type 3 reservoirs, unusual behavior during
pressure maintenance by water or gas injection can be
observed because of unique permeability trends.
PROPERTIES OF MATRIX BLOCKS AND
FRACTURES
A naturally fractured reservoir is composed of a
heterogeneous system of vugs, fractures, and matrix which are
randomly distributed. Such type of system is modeled by
assuming that the reservoir is formed by discrete matrix block
elements separated by an orthogonal system of continuous and
uniform fractures which are oriented parallel to the principal
axes of permeability. Two key parameters, ω and λ, were
introduced by Warren and Root
3
to characterize naturally
fractured reservoirs. These dimensionless parameters λ and ω
are mathematically expressed as
3
:
mtft
ft
tt
ft
cc
c
c
c
)()(
)(
)(
)(
φφ
φ
φ
φ
ω
+
== ……………… (1)
2
2
m
w
f
m
x
r
k
k
αλ
=
…………………………………… (2)
The geometry parameter, α, is defined as:
)2(4 += nn
α
………………………………… (3)
where n is 1, 2 or 3 for the slab, matchstick and cube
models, respectively.
Assuming:(a) the flow between the matrix and the
fractures is governed by the pseudo-steady state condition, but
only the fractures feed the well at a constant rate, and (b) the
fluid is single phase and slightly compressible, the wellbore
pressure solution and the pressure derivative in an infinite-
acting reservoir are given by
4,5
:
s
-
t
Ei
-
t
Eit= P
DD
D
D
+
⎟
⎟
⎠
⎞
⎜
⎜
⎝
⎛
−−
⎟
⎟
⎠
⎞
⎜
⎜
⎝
⎛
−++
⎥
⎥
⎦
⎤
⎢
⎢
⎣
⎡
)1()1(
80908.0ln
2
1
ω
λ
ωω
λ
… (4)
⎥
⎥
⎦
⎤
⎢
⎢
⎣
⎡
⎟
⎟
⎠
⎞
⎜
⎜
⎝
⎛
−
⎟
⎟
⎠
⎞
⎜
⎜
⎝
⎛
−×
)1(
exp
)1(
exp1
2
1
'
ωω
λ
ω
λ
-
t
+
-
t
-= Pt
DD
DD
………… (5)
The second pressure derivative of the dimensionless
pressure equation is:
⎥
⎥
⎦
⎤
⎢
⎢
⎣
⎡
⎟
⎟
⎠
⎞
⎜
⎜
⎝
⎛
−−
⎟
⎟
⎠
⎞
⎜
⎜
⎝
⎛
−
−
−
×
)1(
exp
)1(
exp
1
)1(2
)''(
ω
λ
ωω
λ
ω
ω
λ
-
t
-
t
= Pt
DD
DD
…… (6)
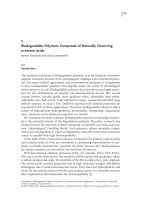
(A) Semilog Analysis
A plot of the well pressure or pressure change (P) versus
test time on a semilog graph should yield two parallel straight
line portions as shown in Figure 1. The pressure change P
during a drawdown test is (P
i
- P
wf
). During a buildup test P
= (P
ws
– P
wf
(t=0)).
1. Fracture Permeability
Figure 1 shows two well defined parallel straight lines of
slope m. The slope m of the straight lines may be used to
calculate the average permeability of the fractured system or
the k
f
h product:
m
qB
kh
o
μ
6.162
= …………………………………. (7)
Assuming the sugar cube model is valid and Types 1
naturally fractured reservoirs, the product kh is essentially
equal to (kh)
f
, so the slope of either straight line can be used to
determine kh.
In Type 2 naturally fractured reservoirs the first straight
line is mostly related to fracture flow, and therefore the kh
product in Eq 7 is essentially (kh)
f
. The second straight line is
however related to both fracture flow and matrix flow, thus the
kh product in Eq 7 reflects both (kh)
m
and (kh)
f
. In this case it
is unlikely that the two straight lines will be perfectly parallel.
If however (kh)
m
<< (kh)
f
then kh can be approximated by
(kh)
f
.
In Type 3 reservoirs, both straight lines are related to
fracture flow and matrix flow, the product kh in Eq 7 is
therefore equivalent to (kh)
t
.
2. Skin Factor
The skin factor is obtained using conventional technique,
i.e.:
()
⎥
⎥
⎦
⎤
⎢
⎢
⎣
⎡
+
⎟
⎟
⎠
⎞
⎜
⎜
⎝
⎛
−
Δ
=
+
23.3log
)(
1513.1
2
1
w
mf
t
hr
rc
k
m
P
s
μφ
(8)
(P)
1hr
is taken from the second straight line.
3. Fracture Storage Capacity Ratio
The vertical distance between the two semilog straight
lines, δP, may be used to estimate
3
the storage capacity ratio,
ω:
⎟
⎠
⎞
⎜
⎝
⎛
−=
m
P
δ
ω
303.2exp ………………………… (9)
or
mP /
10
δ
ω
−
= ……………………………………… (10)
In Type 4 naturally fractured reservoirs the value of is
close to unity. The sugar cube model is not realistic in Type 4
SPE 104056 3
fractured reservoirs, since the fractures do not provide
additional porosity or permeability. These reservoirs are best
treated as anisotropic and analyzed accordingly.
4. Interporosity Flow coefficient
A characteristic minimum point, or trough, is typically
observed on the pressure derivative plot for naturally fractured
reservoirs, as shown in Figure 2. This minimum takes place at
the point where the second pressure derivative equals zero
(t
D
×P
D
’)’ = 0. The dimensionless time at which this minimum
point occurs is given by the following expression
4, 5, 6
⎥
⎦
⎤
⎢
⎣
⎡
⎟
⎠
⎞
⎜
⎝
⎛
=
ωλ
ω
1
ln
minD
t …………………………… (11)
On the semilog plot of well pressure versus test time, this
minimum point corresponds to the inflection point during the
transition portion of the curve. Therefore, Eq. 11 can be
rewritten as:
⎥
⎦
⎤
⎢
⎣
⎡
⎟
⎠
⎞
⎜
⎝
⎛
=
ωλ
ω
1
ln
infD
t ………………………………. (12)
The dimensionless time is defined as:
2
inf
inf
)(
0002637.0
wmft
D
rc
tk
t
μφ
+
=
…………………………. (13)
Where t
inf
= t
min
. Combining Eqs. 12 and 13 and solving
for λ, yields a new relationship for the interporosity flow
parameter:
⎥
⎦
⎤
⎢
⎣
⎡
⎟
⎠
⎞
⎜
⎝
⎛
=
+
ω
ω
μφ
λ
1
ln
)(3792
inf
2
tk
rc
wmft
……………… (14)
t
inf
can be directly read at the inflection point of the
pressure curve from a semilog plot of the flowing well
pressure versus test time. For a Miller-Dyes-Hutchinson
(MDH) semilog plot, i.e. shut-in well pressure (P
ws
) versus
shut-in time (t), t
inf
= t
inf
. When using a Horner plot, the
corresponding inflection (Horner) time, (HT)
inf
, is read and
converted to inflection time using the following equation:
1)(
inf
inf
−
=
T
p
H
t
t
……………………………… (15)
Where (HT) is the Horner time (tp+t)/t or the effective
Horner time tpt/(tp+t).
The idea of estimating the interporosity flow parameter
from semilog plots is not new. Uldrich and Ershaghi
7
,
formulated a complex and cumbersome procedure for that
purpose. They introduced one equation for pressure drawdown
tests which uses the coordinates of the inflection point time,
the storage capacity ratio, the skin factor and a parameter read
from a plot which is a function of ω. They also introduced
another equation for pressure buildup tests which utilizes the
inflection point time, the storage capacity ratio, the
dimensionless Horner production time, t
D
, and two parameters
read from two different plots. These two graphically-obtained
parameters are also function of the ω value. These equations
have received limited applications. Bourdet and Gringarten
8
suggest plotting a horizontal line through the approximate
middle of the transition portion of the curve, and then use the
time at which this horizontal line intersects the parallel straight
lines to calculate the storativity ratio, , and the interporosity
flow coefficient, . Eq. 14 offers a much simpler and
analytically sound procedure for calculating from the
conventional semilog analysis.
5. Short buildup Test – Second Straight is not observed
The interpretation of a buildup test is similar to that of a
drawdown. Generally, the second straight line is more likely to
be observed than the first one, which often is masked by near
wellbore effects, such as wellbore storage. In Type 3 naturally
fractured system, where the matrix has a high enough
permeability for the fluid to enter the wellbore both from the
fracture (mostly) and the matrix, then the first straight line
should last a long time, and will not be masked by inner
wellbore effects. In this system, it is also possible for an
unsteady state flow regime to develop in the matrix. This flow
regime will appear during the transition period, i.e. after the
first semilog straight line.
However pressure buildup tests often give more reliable
value of the storage capacity ratio, , especially when the
second parallel straight line is not observed, such as when the
pressure test is too short, or the well is near a boundary. In
these cases it impossible to determine p, and consequently
Eq. 10 can not be used. The equation of the early time straight
line can be represented by
9
:
⎥
⎥
⎦
⎤
⎢
⎢
⎣
⎡
⎟
⎠
⎞
⎜
⎝
⎛
+
+
⎟
⎟
⎠
⎞
⎜
⎜
⎝
⎛
Δ
Δ+
−=
ω
ω
1
loglog
t
tt
mPP
p
iws
…… …… (16)
Extrapolating the first straight line to a Horner time of
unity, i.e. (t
p
+t)/t = 1, where P
ws
=P
FF1
, then the storage
capacity ratio can be calculated from:
mPP
mPP
FFi
FFi
/)(
/)(
1
1
101
10
−
−
−
=
ω
… …………………….…….(17)
P
FF1
stands for “Fracture Flow” pressure, since near the
wellbore, fluid flows into the well exclusively through the
fractures, particularly in Types 1 and 2 naturally fractured
reservoirs. P
FF1
will always be greater than (by a value equal
to p) the average pressure, P
i
and P*, since normally the
second parallel line is used to estimate these three pressure
values. If the initial reservoir pressure P
i
is not available, use
the average reservoir pressure instead, or the false pressure P*
(if it is known from another source).
The vertical distance between the two parallel semilog
straight lines and passing through the inflection point is of
course identified as p. For uniformly distributed matrix
4 SPE 104056
blocks, the inflection point is at equal distance between the
two parallel lines. Therefore
m
P
inf1
2
10
Δ
−
=
ω
…………… ………………………… (18)
Where:
P
1inf
(= 0.5P) is the pressure drop between the 1
st
semilog straight line and the inflection point along a vertical
line parallel to the pressure axis.
Equation 18 is analogous to Eq. 10 for calculating the
storage capacity ratio, and therefore should yield the same
results as long as the first straight line is well defined and the
pressure test is run long enough to observe the trough on the
pressure derivative, and therefore the inflection point on the
semilog plot. The interporosity flow coefficient is then
calculated from Eq. 14.
If the inflection point is difficult to determine, then read
the end-time of the first or early time straight line, t
EL1
, and
use the following equation to estimate :
ωω
μφ
λ
)1(
013185.0
)(
1
2
−
⎟
⎟
⎠
⎞
⎜
⎜
⎝
⎛
=
+
EL
wmft
kt
rc
……… ……… (19)
If the buildup test is however too short to even observe the
trough (which provides the best evidence of a naturally
fractured system), then results obtained from the interpretation
of the test should at best be considered as an approximation.
The skin factor is then obtained from the following
equation:
()
⎥
⎥
⎦
⎤
⎢
⎢
⎣
⎡
+
⎟
⎟
⎠
⎞
⎜
⎜
⎝
⎛
−
−−Δ
=
+
23.3log
)()(
1513.1
2
11
w
mf
t
FFihr
rc
k
m
PPP
s
μφ
… (20)
or
()
⎥
⎥
⎦
⎤
⎢
⎢
⎣
⎡
+
⎟
⎟
⎠
⎞
⎜
⎜
⎝
⎛
−
Δ−Δ
=
+
23.3log
2)(
1513.1
2
inf11
w
mf
t
hr
rc
k
m
PP
s
μφ
……. (21)
where (P)
1hr
is taken from the first straight line.
EXAMPLE 1
Given the build up test data in Table 1 and the following
formation and fluid properties, estimate formation
permeability, skin factor, λ, and ω from.
q = 125 STB/D h = 17 ft
t
p
= 1200 hr φ = 13.0%
p
wf
= 211.20 psia r
w
= 0.30 ft
µ = 1.72 cp B=1.054 RB/STB
c
t
=7.19×10
-6
psi
-1
Solution
The following data are read from Figure 3:
t
inf
= 0.63 hr ΔP
1inf
= 33 psi
P
1hr
= 497 psi m=35.67 psi/cycle
t
EL1
= 0.012 hr
From Equation 7:
mdk 7.60
)17)(67.35(
)72.1)(054.1)(125(6.162
==
From Equation 21 the storage capacity ratio is:
014.010
67.35
)33(2
==
−
ω
Using equation 1, we can calculate (φc
t
)
f
:
86
103.1
014.01
014.0
)1019.7)(13.0()(
1
)()(
−−
×=
⎟
⎠
⎞
⎜
⎝
⎛
−
×=
⎟
⎠
⎞
⎜
⎝
⎛
−
=
ft
mtft
c
cc
φ
ω
ω
φφ
From equation 21 the skin factor is:
89.0
23.3
)3.0)(72.1)(103.11019.713.0(
7.60
log
67.35
)3328.285(
1513.1
286
=
⎥
⎥
⎦
⎤
⎢
⎢
⎣
⎡
+
⎟
⎟
⎠
⎞
⎜
⎜
⎝
⎛
×+××
−
×−
=
−−
s
s
From Equation 14, the interporosity flow parameter is:
7
286
107.8
014.0
1
ln014.0
)63.0)(7.60(
)3.0)(72.1)(103.11019.713.0(3792
−
−−
×=
⎥
⎦
⎤
⎢
⎣
⎡
⎟
⎠
⎞
⎜
⎝
⎛
××
×+××
=
λ
λ
From Equation 19:
7
286
101.2
014.0)014.01(
)012.0)(7.60)(013185.0(
)3.0)(72.1)(103.11019.713.0(
−
−−
×=
−×
⎟
⎟
⎠
⎞
⎜
⎜
⎝
⎛
×+××
=
λ
λ
6. Long buildup Test – First Straight is not Observed
Generally, the second straight line is more likely to be
observed than the first one, which often is masked by near
wellbore effects, such as wellbore storage. In Type 1 and Type
2 naturally fractured systems, where the matrix permeability is
negligible, the fluid flows into the wellbore exclusively
through the fractures. The first straight line will probably be
too short and easily masked by inner wellbore effects.
The permeability and skin factor are calculated from Eqs.
7 and 8 respectively. The following equation provides a direct
and accurate method for calculating , as long as the
inflection point and the second straight line are observed and
the matrix blocks are uniformly distributed:
m
P
inf2
2
10
Δ
−
=
ω
………… …………………………… (22)
P
2inf
(= 0.5p) is the pressure drop between the 2
nd
semilog straight line and the inflection point along a vertical
line parallel to the pressure axis.
The interporosity flow parameters is then calculated from
Eq. 14.
If the inflection point is difficult to determine, then read
the starting-time of the second semilog straight line, t
SL2
, and
use the following equation to estimate :
SPE 104056 5
)1(
1027.5
)(
2
5
2
ω
μφ
λ
−
⎟
⎟
⎠
⎞
⎜
⎜
⎝
⎛
×
=
−
+
SL
wmft
kt
rc
…… ………… …… (23)
EXAMPLE 2
Given the build up test data in Table 2 and the following
formation and fluid properties, estimate formation
permeability, skin factor, λ, and ω.
q = 125 STB/D h = 17 ft
t
p
= 1200 hr φ = 13.0%
p
wf
= 211.20 psia r
w
= 0.30 ft
µ = 1.72 cp B=1.054 RB/STB.
c
t
=7.19×10
-6
psi
-1
Solution
The following data are read from Figure 4:
t
inf
= 3.05 hr ΔP
2inf
= 24 psi
P
1hr
= 419 psi m=30 psi/cycle
t
SL2
=55 hr
From Equation 7:
mdk 25.72
)30)(17(
)72.1)(054.1)(125(6.162
==
From Equation 22:
025.010
30
)24(2
==
−
ω
It is possible to calculate (φc
t
)
f
by:
86
104.2
025.01
025.0
)1019.7)(13.0()(
1
)()(
−−
×=
⎟
⎠
⎞
⎜
⎝
⎛
−
×=
⎟
⎠
⎞
⎜
⎝
⎛
−
=
ft
mtft
c
cc
φ
ω
ω
φφ
From equation 8:
⎥
⎥
⎦
⎤
⎢
⎢
⎣
⎡
⎟
⎟
⎠
⎞
⎜
⎜
⎝
⎛
+
−
×+
−
××
−= 23.3
2
)3.0)(72.1)(
8
104.2
6
1019.713.0(
25.72
log
30
8.207
1513.1s
69.1=s
From Equation 14:
7
286
1036.2
025.0
1
ln025.0
)05.3)(25.72(
)3.0)(72.1)(104.21019.713.0(3792
−
−−
×=
⎥
⎦
⎤
⎢
⎣
⎡
⎟
⎠
⎞
⎜
⎝
⎛
×
×+××
=
λ
λ
From Equation 23:
7
5
286
1091.6
)025.01(
)55)(25.72)(1027.5(
)3.0)(72.1)(104.21019.713.0(
−
−
−−
×=
−×
⎟
⎟
⎠
⎞
⎜
⎜
⎝
⎛
×
×+××
=
λ
λ
(B) TDS Technique
In 1993 Tiab introduced a technique
10
for interpreting
loglog plots of the pressure and pressure derivative curves
without using type curve matching. This technique utilizes the
characteristic intersection points, slopes, and beginning and
ending times of various straight lines corresponding to flow
regimes strictly from loglog plots of pressure and pressure
derivative data. Values of these points and slopes are then
inserted directly in exact, analytical solutions to obtain
reservoir and well parameters. This procedure for interpreting
pressure tests, which is referred to as the Tiab’s Direct
Synthesis (TDS) technique offers several advantages over the
conventional semilog analysis and type curve matching. It has
been applied to over fifty different reservoir systems
11-18
, and
hundreds of field cases.
1. Fracture Permeability
The pressure derivative portion corresponding to the
infinite acting radial flow line is a horizontal straight line. This
flow regime is given by
10
:
kh
Bq
Pt
R
μ
6.70
)'( =Δ×
…………………………… … (24)
The subscript “R” stands for radial flow. The formation
permeability is therefore:
R
Pth
Bq
k
)'(
6.70
Δ×
=
μ
…………………………… …… … (25)
where (t×ΔP')
R
is obtained by extrapolating the horizontal
line to the vertical axis. In order for the conventional semilog
analysis and the TDS technique to yield the same value of k,
the following equation must be true:
R
Ptm )'(303.2
Δ
×
=
……………….……………… (26)
2. Skin Factor
The second radial flow line can also be used to calculate
the skin factor from
10
:
()
⎥
⎥
⎦
⎤
⎢
⎢
⎣
⎡
+
⎟
⎟
⎠
⎞
⎜
⎜
⎝
⎛
−
Δ×
Δ
=
+
43.7
)(
ln
'
)(
5.0
2
2
2
2
wmft
R
R
R
rc
kt
Pt
P
s
μφ
……… (27)
Where t
R2
is any convenient time during the system’s
radial flow regime (as indicated by the horizontal line on the
pressure derivative curve, Figure 2) and (ΔP)
R2
is the value of
ΔP on the pressure curve corresponding to t
R2
. If the test is too
short or the boundary is too close to the well to observe a well
defined second straight line, then the skin factor can be
estimated from the early-time horizontal straight line:
6 SPE 104056
()
⎥
⎥
⎦
⎤
⎢
⎢
⎣
⎡
+
⎟
⎟
⎠
⎞
⎜
⎜
⎝
⎛
−
Δ×
Δ
=
+
43.7
1
)(
ln
'
)(
5.0
2
1
1
1
ω
μφ
wmft
R
R
R
rc
kt
Pt
P
s
…… (28)
Where t
R1
is any convenient time during the early-time
radial flow regime (as indicated by the horizontal line on the
pressure derivative curve, Figure 2) and (ΔP)
R1
is the value of
ΔP on the pressure curve corresponding to t
R1
.
3. Interporosity Flow Coefficient
The interporosity flow parameter can also be obtained
from the loglog plot of the derivative function (txP’) versus
test time
4,5
by substituting the coordinates of the minimum
point of the trough, t
min
and (txP’)
min
:
()
min
min
2
'
)(5.42
t
Pt
qB
rch
o
wmft
Δ×
⎥
⎥
⎦
⎤
⎢
⎢
⎣
⎡
=
+
φ
λ
…………….… (29)
The advantage of Eq. 29 over Eq. 14 is that it is
independent of permeability and storage capacity ratio, and the
coordinates of the minimum points are easier to determine
than the inflection point on the semilog plot.
4. Storage Capacity Ratio
The coordinates of the minimum point of the trough can be
used to derive two equations to calculate accurately the
storage capacity ratio .
Pressure derivative Coordinate: Using the pressure
derivative coordinate of the minimum point and the radial
flow regime (horizontal) line, the following equation provides
a direct and accurate method for calculating :
⎟
⎟
⎠
⎞
⎜
⎜
⎝
⎛
Δ×
Δ×
−−
=
R
Pt
Pt
)'(
)'(
18684.0
min
10
ω
…… …………….…… (30)
Equation 30 is derived by observing that:
2
)()(
min
P
PtPt
R
δ
=
′
Δ×−
′
Δ× ………………… … (30a)
Combining Equations 30a and 26 yields:
()
⎥
⎦
⎤
⎢
⎣
⎡
′
Δ×
′
Δ×
−=
′
Δ×
′
Δ×−
′
Δ×
=
R
R
R
Pt
Pt
Pt
PtPt
m
P
)(
)(
18684.0
)(303.2
)()(2
min
min
δ
………….……… (30b)
Substituting Equation 30b into Equation 10 yields
Equation 30. Equation 30 assumes wellbore storage and
boundary effects do not influence the trough and the infinite
acting radial flow line is well defined.
In conventional analysis this ideal case displays two well
defined parallel lines with the inflection point equidistant of
those two lines, which means that the fractures are uniformly
distributed.
Minimum Time: Using the time coordinate of the minimum
point, a less direct but just as accurate value of the storage
capacity ratio can be obtained when wellbore storage is
present from the following equation:
minD
t
e
λ
ω
ω
−
=
…………………………… ………. (31)
Where the dimensionless time at the minimum point is
calculated from:
min
2
min
)(
0002637.0
t
rc
k
t
wmft
D
⎟
⎟
⎠
⎞
⎜
⎜
⎝
⎛
=
+
μφ
…………… …………. (32)
Solving explicitly for Eq. 31 yields
19
:
1
5452.6
)ln(
5688.3
9114.2
−
⎟
⎟
⎠
⎞
⎜
⎜
⎝
⎛
−−=
SS
NN
ω
…………………. (33)
Where the parameter N
S
is given by:
minD
t
S
eN
λ
−
=
……………………………………… (34)
Eq. 34 is obtained by assuming values of , from 0 to 0.5,
then values of
= N
S
were plotted against . The resulting
curve was curve-fitted. Note that Eq. 33 can also be used in
the semilog analysis since t
min
= t
inf
.
It is recommended that both methods be used for
comparison purposes. If the radial flow regime line on the
derivative curve is not well defined due to a combination of
inner and/or outer boundary effects or a short test, but the
minimum of the trough is well defined, then Eqs. 29 and 33
should be used to calculate, respectively, and .
EXAMPLE 3
Tiab Direct Synthesis technique is applied to Example 2.
Figure 5 is plotted with data from Table 2 and the
respective pressure derivative.
From Figure 5 the following data can be read:
P
R
= 274.51 psi t
R
= 156.51 psi
t
min
= 3.05 hours (t×P’)
min
= 1.3 psi
(t×P’)
R
= 13 psi t
e
=0.018 hr
P
e
= 13 psi
Wellbore storage coefficient is calculated by
10
:
psibbl
P
t
qB
C
e
/1060.7
13
018.0
24
)054.1)(125(
24
3−
×=
⎟
⎠
⎞
⎜
⎝
⎛
=
⎟
⎠
⎞
⎜
⎝
⎛
Δ
=
From Equation 25:
mdk 39.72
)13)(17(
)054.1)(72.1)(125(6.70
==
From Equation 27:
74.1
43.7
)3.0)(72.1)(104.21019.713.0(
)51.156)(39.72(
ln
13
51.274
5.0
286
=
⎥
⎥
⎦
⎤
⎢
⎢
⎣
⎡
+
⎟
⎟
⎠
⎞
⎜
⎜
⎝
⎛
×+××
−=
−−
s
s
SPE 104056 7
From Equation 29:
7
286
1002.2
05.3
3.1
)054.1)(125(
)3.0)(104.21019.713.0)(17(5.42
−
−−
×=
⎥
⎦
⎤
⎢
⎣
⎡
×+××
=
λ
λ
From Equation 33 the storage capacity ratio can be
calculated in the presence of wellbore storage:
024.0
924.0
5452.6
)924.0ln(
5688.3
9114.2
1
=
⎟
⎟
⎠
⎞
⎜
⎜
⎝
⎛
−−=
−
ω
Table 3 is a comparison of the TDS results with that of
conventional method.
FRACTURE POROSITY AND COMPRESSIBILTY
Once ω is estimated, the fracture porosity can be estimated
if matrix porosity, φ
m
, total matrix compressibility, c
tm
, and
total fracture compressibility, c
tf
, are known, as follows:
m
tf
tm
f
c
c
φ
ω
ω
φ
⎟
⎠
⎞
⎜
⎝
⎛
−
=
1
………………………… ……… (35)
Fracture compressibility may be different from matrix
compressibility by an order of magnitude. Naturally fractured
reservoirs in Kirkuk field (Iraq) and Asmari field (Iran) have
fracture compressibility ranging from 4x10
-4
to 4x10
-5
psi
-1
. In
Grozni field (Russia) c
tf
ranges from 7x10
-4
to 7x10
-5
. In all
these reservoirs c
tf
is 10 to 100 folds higher than c
tm
. Therefore
the practice of assuming c
tf
= c
tm
is not acceptable.
The fracture compressibility can be estimated from the
following expression
9
:
() ()
P
kk
P
kk
c
fiffif
tf
Δ
−
≈
Δ
−
=
3
/1/1
3/1
… ……………… (36)
=
fi
k
Fracture permeability at the initial reservoir pressure
i
p
=
f
k
Fracture permeability at the current average reservoir
pressure.
Combining Equations 35 and 36 yields
19
:
()
3/1
)/(1
1
fif
tmmf
kk
P
c
−
Δ
⎟
⎠
⎞
⎜
⎝
⎛
−
=
ω
ω
φφ
………………… (37)
In deep naturally fractured reservoirs, fractures and the
stress axis on the formation generally are vertically oriented.
Thus when the pressure drops due to reservoir depletion, the
fracture permeability reduces at a lower rate than one would
expect. In Type-2 naturally fractured reservoirs, where matrix
porosity is much greater than fracture porosity, as the reservoir
pressure drops the matrix porosity decreases in favor of
fracture porosity
9
. This not the case in Type-1 naturally
fractured reservoirs, particularly if the matrix porosity is very
low or negligible.
For fractured reservoirs and, indeed, all highly anisotropic
reservoirs, the geometric mean is currently considered the
most appropriate of the three most common averaging
techniques (arithmetic, harmonic and geometric). Therefore, a
representative average value of the effective permeability of a
naturally fractured reservoir may be obtained from the
geometric mean of k
max
and k
min
as illustrated in Figure 6.
minmax
kkk = ……………… …………………… (38)
where
k
max
= maximum permeability measured in the direction
parallel to the fracture plane (Figure 6), thus
k
max
≈ k
fracture
k
min
= minimum permeability measured in the direction
perpendicular to the fracture plane (Figure 6), thus
k
min
≈ k
matrix
Substituting k
f
and k
m
for, respectively, k
max
and k
min
,
Equation 38 becomes:
mf
kkk = ………………………………………… (39)
The fracture permeability can therefore be estimated from:
m
f
k
k
k
2
= …………………………………………… (40)
Where k
m
is the matrix permeability, which is measured
from representative cores and k is the mean permeability
obtained from pressure transient tests. Combining equations
36 and 40 yields:
(
)
P
kk
c
i
tf
Δ
−
=
3/2
/1
………………………………… (41)
Where
k
i
= average permeability obtained from a transient test run
when the reservoir pressure was at or near initial conditions
P
i
and
k = average permeability obtained from a transient test at
the current average reservoir pressure.
PPP
i
−=Δ
Combining Equations 41 and 35 yields
19
:
()
3/2
)/(1
1
i
tmmf
kk
P
c
−
Δ
⎟
⎠
⎞
⎜
⎝
⎛
−
=
ω
ω
φφ
……… … …… (42)
Matrix permeability is assumed to remain constant
between the two tests. Note that equations 37 and 42 are also
valid for calculating fracture porosity change between two
consecutive pressure transient tests, and therefore
21
PPP −=Δ . The time between the two tests must be long
enough for the fractures to deform significantly in order to
determine an accurate value of c
tf
. Table 5 shows pressure
transient analysis in Cupiaga field, a naturally fractured
reservoir in Colombia
22
. The reduction in permeability for
well 1 is about 13% and the change in pressure is 344 psi from
1996 to 1997. This type of data can be used in order to
estimate φ
f
from Eq. 42. Eq. 37 should yield a more accurate
value of fracture porosity than Eq. 42, as the latter assumes
Eq. 39 is always applicable.
Substituting the values of
ffm
andkk
φ
,,
into the
following equation should yield approximately the same value
of the effective permeability obtained from well testing
20
:
ffm
kkk
φ
+
≈
…………………… ………………… (43)
8 SPE 104056
Eq. 43 should only be used for verification purposes. The
fracture width or aperture may be estimated
20
from
t
f
f
k
w
ωφ
33
=
……………… …………………….…. (44)
where: fracture width = microns, permeability = mD,
porosity = fraction, and storage capacity = fraction.
EXAMPLE 4
Pressure tests in the first few wells located in a naturally
fractured reservoir yielded a similar average permeability of
the system of 82.5 mD. An interference test also yielded the
same average reservoir permeability, which implies that
fractures are uniformly distributed. The total storativity,
(φc
t
)
m+f
= 1x10
-5
psi
-1
was obtained from this interference test.
Only the porosity, permeability and compressibility of the
matrix could be determined from the recovered cores.
The pressure data for the well are given in Table 4. The
pressure drop from the initial reservoir pressure to the current
average reservoir pressure is 300 psi. The characteristics of the
rock, fluid and well are given below:
q = 3000 STB/D h = 25 ft
φ
m
= 10% r
w
= 0.4 ft
µ = 1 cp B=1.25 RB/STB.
c
tm
=1.35×10⁻⁵ psi
-1
k
m
=0.10 mD
1 - Using conventional semilog analysis and TDS
technique, calculate the current formation permeability,
storage capacity ratio, and fluid transfer coefficient
2 – Estimate the three fracture properties: permeability,
porosity and width.
Solution
1(a) – Conventional method
From Figure 7:
δP = 130 psi m=325 psi/cycle t
inf
=2.5 hrs
The average permeability of the formation is estimated
from the slope of the semilog straight line. Using Equation 7
yields:
()()()
()()
mDk 05.75
25325
125.130006.162
==
Fluid storage coefficient is estimated using Equation 10:
39.010
)325/130(
==
−
ω
The storage coefficient of 0.39 indicates that the fractures
occupy 39% of the total reservoir pore volume.
The inter-porosity fluid transfer coefficient is given by
Equation 14:
(
)
()()
5
25
1019.1
39.0
1
ln39.0
5.205.75
)4.0)(1(1013792
−
−
×=
⎟
⎟
⎠
⎞
⎜
⎜
⎝
⎛
⎟
⎠
⎞
⎜
⎝
⎛
×
=
λ
1(b) – TDS technique
From Figure 8, the following characteristic points are read:
Δt
min
= 2.5 hrs (t×ΔP’)
R
= 146 psi
(t×ΔP’)
min
= 70.5 psi
Using the TDS technique, the value of k is obtained from
Equation 25:
(
)
(
)
(
)
()( )
mDk 53.72
14625
25.1130006.70
==
The inter-porosity fluid transfer coefficient is given by
Equation 29:
5
25
1028.1
5.2
)5.70(
)25.1)(3000(
)4.0)(101)(25)(5.42(
−
−
×=
⎟
⎟
⎠
⎞
⎜
⎜
⎝
⎛
×
=
λ
Since the two parallel lines are well defined the storage
coefficient ω is calculated from Equation 30
35.010
146
5.70
18684.0
==
⎟
⎠
⎞
⎜
⎝
⎛
−−
ω
The conventional semilog analysis yields similar values of
k, and as the TDS technique. The main reason for this
match is that both parallel straight lines are well defined.
2 – Current properties of the fracture
(a) The fracture permeability is calculated from Equation.
40:
mD
k
k
k
m
f
606,52
10.0
53.72
22
===
The fracture permeability at initial reservoir pressure is:
mD
k
k
k
m
i
fi
062,68
10.0
5.82
2
2
===
(b) The fracture porosity
In fractured reservoirs with deformable fractures, the
fracture compressibility changes with declining pressure. The
fracture compressibility can be estimated from Equation 41:
(
)
14
3/2
102.5
300
062,68/606,521
−−
×=
−
= psic
tf
The compressibility ratio is:
5.38
1035.1
102.5
5
4
=
×
×
=
−
−
tm
tf
c
c
Thus, the fracture compressibility is more than 38.5 folds
higher than the matrix compressibility, or
tmtf
cc 5.38
=
.
The fracture porosity from Equation 42 is:
%14.000139.0
5.38
1.0
35.01
35.0
≈=
⎟
⎠
⎞
⎜
⎝
⎛
−
=
f
φ
The total porosity of this naturally fractured reservoir is:
1014.00014.010.0 =
+
=
+
=
fmt
φ
φ
φ
Substituting the values of
ffm
andkk
φ
,, into Equation
43:
mDkkk
ffm
7.73606,520014.01.0 =×
+
=
+
≈
φ
This value is approximately the same value of the effective
permeability obtained from well testing (72.53 mD). The
fracture width or aperture may be estimated from Equation 44:
mmmicronsw
f
212.0212
1014.035.033
606,52
==
××
=
SPE 104056 9
The fracture width is a useful parameter for identifying the
nature of fracturing in the reservoir.
Conclusions
1. The inflection point on the semilog plot of well pressure
versus test time and the corresponding minimum point on
the trough of the pressure derivative curve are unique
points that can be used to characterize a naturally
fractured reservoir.
2.
The interporosity flow parameter can be accurately
obtained from the conventional semilog analysis if the
inflection point is well defined and the new proposed
equation is utilized. The equation is valid for both
pressure drawdown and pressure buildup tests.
3.
Two new equations are introduced for accurately
calculating the storage capacity ratio from the coordinates
of the minimum point of the trough on the pressure
derivative curve.
4.
For a short test, in which the late-time straight line is not
observed, the storage capacity ratio and the interporosity
flow coefficient can both be calculated from the inflection
point.
5.
For a long test, in which the early-time straight line is not
observed, due to near-wellbore effects, the storage
capacity ratio can also be calculated from the inflection
point.
6.
A new equation is proposed for calculating fracture
porosity, as a function of reservoir compressibility.
7.
The practice of assuming the total compressibility of the
matrix (c
tm
) is equal to the total compressibility of the
fracture (c
tf
) should be avoided. From field observations,
c
tf
is several folds higher than c
tm
.
Nomenclature
B oil volumetric factor, rb/STB
c system compressibility, psi
-1
h formation thickness, ft
H
T
Horner time, dimensionless
k permeability, md
m semilog slope, psi/log cycle
P
ws
well shutin pressure, psi
P
wf
well flowing pressure, psi
q oil flow rate, BPD
r
w
wellbore radius, ft
s skin factor
t
p
producing time before shut-in, hrs
w
f
Fracture width in microns
Greek Symbols
δP vertical distance between the two semilog straight
lines, psi
α Geometry parameter, 1/L2
φ Porosity, dimensionless
ΔP
1inf
Pressure drop between the 1
st
semilog strigth line and
the inflection point, psi
ΔP
2inf
Pressure drop between the 2
nd
semilog strigth line and
the inflection point, psi
Δt shut-in time, hrs
λ Interporosity flow parameter, dimensionless
µ Viscosity, cp
ω Storage capacity ratio, dimensionless
Subscripts
i initial
o oil
D dimensionless
f fracture, fissure
m matrix
t total
inf inflection point
min minimum
1 1st semilog straight line
2 2nd semilog straight line
1hr 1 hour
References
1. Nelson, R.: “Geologic Analysis of Naturally Fractured
Reservoirs”. Gulf Professional Publishing, 2
nd
Edition. 2001
2. Ershaghi, I.: “Evaluation of Naturally Fractured Reservoirs”.
IHRDC, PE 509, 1995.
3. Warren, J.E. and Root, P.J.: “The Behavior of Naturally
Fractured Reservoirs”. Soc. Pet. Eng. J. (Sept. 1963): 245-255.
Trans. AIME, 228.
4. Engler, T. and Tiab, D.: “Analysis of Pressure and Pressure
Derivative without Type Curve Matching, 2. Naturally Fractured
Reservoirs”. Journal of Petr. Sci. and Eng. 15 (1996):127-138.
5. Engler, T. and Tiab, D.: “Analysis of Pressure and Pressure
Derivative without Type Curve Matching, 5. Horizontal Well
Tests in Naturally Fractured Reservoirs”. Journal of Petr. Sci.
and Eng. 15 (1996); 139-151.
6. Engler, T. and Tiab, D.: “Analysis of Pressure and Pressure
Derivative without Type Curve Matching - 6. Horizontal Well
Tests in Anisotropic Media”. Journal of Petroleum Science and
Engineering, Vol. 15 (Aug. 1996) N
0
. 2-4, 153-168.
7. Uldrich, D.O. and Ershaghi, I.: “A Method for Estimating the
Interporosity Flow Parameter in Naturally Fractured
Reservoirs”: Paper SPE 7142, Proceedings, 48
th
SPE-AIME
Annual California Regional Meeting held in San Francisco, CA,
Apr. 12-14, 1978.
8. Bourdet, D. and Gringarten. AC.: “Determination of fissured
volume and block size in fractured reservoirs by type-curve
analysis”. Paper SPE 9293. Soc. Pet. Eng., Annu. Tech. Conf.,
Dallas, TX, Sept. 21-24, 1980,
9. Saidi, M. A.: “Reservoir Engineering of Fractured Reservoirs”.
Total Edition Presse, 1987.
10. Tiab, D.: "Analysis of Pressure and Pressure Derivative without
Type-Curve Matching - 1. Skin and Wellbore Storage". Journal
of Petroleum Science and Engr., Vol. 12, No. 3 (January, 1995)
171-181.
11. Jongkittinarukorn, K. and Tiab, D.: “Analysis of Pressure and
Pressure Derivative without Type Curve Matching - 6. Vertical
Well in Multi-boundary Systems”. Proceedings, CIM 96-52, 47th
Annual Tech. Meeting, Calgary, Canada, June 10-12, 1996.
12. Jongkittinarukorn, K. and Tiab, D.: “Analysis of Pressure and
Pressure Derivatives without Type Curve Matching - 7.
Horizontal Well in a Closed Boundary Systems”, Proceedings,
CIM 96-53, 47th Annual Tech. Meeting, Calgary, Canada, June
10-12, 1996.
13. Tiab, D., Azzougen, A., F.H., Escobar, and S. Berumen:
“Analysis of Pressure Derivative Data of Finite-Conductivity
Fractures by the Tiab’s Direct Synthesis Technique”. Paper SPE
52201. Proceedings, SPE Mid-Continent Operations
Symposium, Oklahoma City, 28 – 31 March 1999; Proceedings
10 SPE 104056
SPE Latin American & Caribbean Petr. Engr. Conf., Caracas,
Venezuela, 21–23 April 1999, 17 pages.
14. Mongi, A. and Tiab, D.: “Application of Tiab’s Direct Synthesis
Technique to Multi-rate Tests”, SPE/AAPG 62607, Proceedings,
Western Regional Meeting, Bartlesville, California, 19-23 June
2000.
15. Benaouda, A. and Tiab, D.: “Application of Tiab’s Direct
Synthesis Technique to Gas Condensate Wells”. Proceedings,
SPE Permian Basin Conference, Texas, May 2001
16. Jokhio, S.A., Hadjaz, A. and Tiab, D.: “Pressure falloff Analysis
in Water Injection Wells Using the Tiab’s Direct Synthesis
Technique”. Paper SPE 70035, Proceedings, SPE Permian Basin
Conference, Midland, Texas, May 15-16, 2001.
17. Bensadok A. and Tiab, D.: “Interpretation of Pressure Behavior
of a Well between Two Intersecting Leaky Faults Using Tiab’s
Direct Synthesis (TDS) Technique”. CIP2004-123, Proceedings,
Canadian International Petroleum Conference, 7 – 10 June 2004
18. Chacon, A., Djebrouni, A. and Tiab, D.: “Determining the
Average Reservoir Pressure from Vertical and Horizontal Well
Test Analysis Using Tiab’s Direct Synthesis Technique”. Paper
SPE 88619, Proceedings, Asia Pacific Oil and Gas Conference
and Exhibition, Perth, Australia, Oct. 18-20, 2004.
19. Tiab, D. and E.C. Donaldson: “Petrophysics: theory and
practice of measuring reservoir rock and fluid transport
properties”. Gulf professional Publications, 2
nd
Edition, 2004.
20. Bona, N., Radaelli, F., Ortenzi, A., De Poli, A., Pedduzi, C. and
Giorgioni, M: “Integrated Core Analysis for Fractured
Reservoirs: Quantification of the Storage and Flow Capacity of
Matrix, Vugs, and Fractures”. SPERE, Aug. 2003, Vol.6,
pp.226-233.
21. Stewart G. Ascharsobbi F. “Well test interpretation for
Naturally Fractured Reservoirs”. Paper SPE 18173.
22. Giraldo L. A., Chen Her-Yuan, Teufel L. W. “ Field Case Study
of Geomachanical Impact of Pressure Depletion in the Low-
Permeability Cupiaga Gas-Condensate Reservoir”. SPE 60297.
SPE Rocky Mountain Regional/Low Permability Reservoirs
Symposium, Denve, CO, March 12-15, 200.
SI Metric Conversion Factors
bbl x 1.589873 E-01 = m
3
cp x 1.0
*
E-03 = Pa-s
ft x 3.048
*
E-01 = m
ft
2
x 9.290304 E-02 = m
2
psi x 6.894757 E+00 = kPa
*Conversion factor is excat.
Table 1. Pressure data for Example 1
Time
hours
Pressure
psi
P
psi
Horner Time
0.0000 211.20 0.00
0.0010 390.73 179.53 1200001.00
0.0023 404.32 193.12 521740.13
0.0040 413.00 201.80 300001.00
0.0062 419.73 208.53 193549.39
0.0090 425.39 214.19 133334.33
0.0128 430.36 219.16 93751.00
0.0176 434.81 223.61 68182.82
0.0239 438.82 227.62 50210.21
0.0320 442.43 231.23 37501.00
0.0426 445.66 234.46 28170.01
0.0564 448.48 237.28 21277.60
0.0743 450.87 239.67 16151.74
0.0976 452.84 241.64 12296.08
0.1279 454.36 243.16 9383.33
0.1673 455.46 244.26 7173.74
0.2190 456.20 245.00 5480.45
0.2850 456.65 245.45 4211.53
0.3720 456.90 245.70 3226.81
0.4840 457.03 245.83 2480.34
0.6300 457.11 245.91 1905.76
0.8200 457.18 245.98 1464.41
1.0670 457.27 246.07 1125.65
1.3890 457.39 246.19 864.93
1.8060 457.55 246.35 665.45
2.3500 457.75 246.55 511.64
3.0500 458.01 246.81 394.44
SPE 104056 11
Table 2 Pressure data for Example 2
Time
hours
Pressure
psi
Time
hours
Pressure
psi
0.0000 211.20 1.8060 456.85
0.0010 212.07 2.3500 457.47
0.0023 213.19 3.0500 457.80
0.0040 214.64 3.9700 458.15
0.0062 216.50 5.1600 458.58
0.0090 218.90 6.7100 459.14
0.0128 221.98 8.7300 459.84
0.0176 225.91 11.3500 460.73
0.0239 230.92 14.7600 461.85
0.0320 237.26 19.1800 463.23
0.0426 245.22 24.9400 464.92
0.0564 255.11 32.4200 466.95
0.0743 267.26 42.1500 469.35
0.0976 281.94 54.8000 472.11
0.1279 299.31 71.2400 475.21
0.1673 319.31 92.6100 478.57
0.2190 341.53 120.3900 482.11
0.2850 365.13 156.5100 485.71
0.3720 388.74 203.5000 489.29
0.4840 410.60 264.5000 492.77
0.6300 428.91 343.9000 496.09
0.8200 442.40 447.0000 499.23
1.0670 450.83 581.0000 502.15
1.3890 455.12 720.0000 504.36
Table 3. Results for examples 2 and 3
Parameter MDH TDS
k, md 72.25 72.39
s 1.69 1.74
λ
2.36×10
-7
2.02×10
-7
ω
0.025 0.024
5,700
5,800
5,900
6,000
6,100
6,200
6,300
6,400
6,500
101001,00010,000100,000
Shut-in Pressure, psia
Inflection point
δ
P
m
Δt
H-inf
(t
p
+
Δ
t)/
Δ
t
Δt
H
=
Horner time,
Figure 1- Semilog pressure behavior of a naturally fractured
reservoir
Table 4. Pressure data for Example 4
Time
hours
P
ws
psi
P
psi
(txΔ
P')
psi
0 4473.0
0.093 4373.4 99.60 84.473
0.177 4299.1 173.90 133.483
0.260 4246.1 226.90 146.776
0.343 4203.6 269.40 151.595
0.427 4173.8 299.20 157.618
0.510 4139.7 333.30 150.295
0.593 4118.5 354.50 141.355
0.677 4103.5 369.50 111.676
0.760 4086.4 386.60 99.694
0.927 4075.4 397.60 95.720
1.093 4060.3 412.70 87.234
1.260 4043.1 429.90 84.384
1.427 4032.2 440.80 76.719
2.427 3997.0 476.00 70.469
3.427 3971.3 501.70 77.268
4.427 3948.3 524.70 87.168
5.427 3931.6 541.40 95.595
6.427 3917.1 555.90 108.303
7.427 3898.4 574.60 122.336
9.427 3865.3 607.70 142.426
12.43 3824.2 648.80 137.651
14.43 3804.1 668.90 136.857
20.43 3758.7 714.30
10
100
1000
10 100 1000 10000
(
tx
Δ
P')
min
t
min
Minimum
point
Time, hr
Pressure and pressure derivative, psi
(
tx
Δ
P')
R2
(
tx
Δ
P')
R1
t
R2
(Δ
P)
R2
t
R1
(Δ
P)
R1
Δ
10
100
1000
10 100 1000 10000
(
tx
Δ
P')
min
t
min
Minimum
point
Time, hr
Pressure and pressure derivative, psi
(
tx
Δ
P')
R2
(
tx
Δ
P')
R1
t
R2
(Δ
P)
R2
t
R1
(Δ
P)
R1
Δ
Figure 2 –P and pressure derivative plot for a naturally fractured
reservoir
12 SPE 104056
380
400
420
440
460
480
500
520
0.001 0.01 0.1 1 10
Time, hr
Shut in pressure, psi
Δ
P
1inf
= 33 psi
m = 35.67 psi/cycle
Inflection point
t
inf
= 0.63 hr
t
EL1
= 0.012 hr
P
1hr
=497 psi
Figure 3 –Conventional MDH plot for Example 1
200
250
300
350
400
450
500
550
0.001 0.01 0.1 1 10 100 1000
Time, hr
Shut in pressure, psi
Inflection point
t
inf
= 3.05 hr
P
1hr
= 419 psi
ΔP
2inf
= 24 psi
m = 30 psi/cycle
t
SL2
= 55 hr
Figure 4 -Conventional MDH plot for Example 2
0.1
1
10
100
1000
0.001 0.01 0.1 1 10 100 1000
Time, hr
P and (tx
Δ
P'), psi
ΔP
R
= 274.51 psi
t
R
= 156.51 hr
t
min
= 3.05 hr
(t×ΔP')
min
= 1.3 psi
(t×ΔP')
R
= 13 psi
t
e
= 0.018 hr
(ΔP)
e
= 13 psi
Figure 5- Log-log plot for Example 3
W
f
L
h = h
f
k
min
k
max
W
Figure 6- Maximum and Minimum Permeability
3600
3700
3800
3900
4000
4100
4200
4300
4400
0.01 0.1 1 10 100
Time, hr
Pressure, psi
Inflection point
t
inf
= 2.5 hr
m = 325 psi/cycle
δP = 130 psi
Figure 7- Conventional MDH plot for Example 4
10
100
1000
0110100
Time, hours
Δ
P and (tx
Δ
P'), psi
Δ
P
R
= 669 psi
t
R
= 14.43 hr
t
min
= 2.5 hr
(t×
Δ
P')
min
= 70.5 psi
(t×
Δ
P')
R
= 146psi
Figure 8- Pressure Derivative plot for Example 4
SPE 104056 13
Table 5. Pressure Transient Analysis of Selected Cupiaga wells
22
Test Type
Date
P
*
BHFP
(psi)
Global
Skin
Particular
Types
of Skin
K (md)
h(ft)
Comments/Remarks
Well 1
Pre-Frac Test
1996
6004
∼3000
91.3 Mechanical
∼48
16.4
171
Homogenous reservoir model. The turbulence factor is quite large
due to non-darcy flow (high rates) combined with the condensate
banking
Well 1
Post-Frac Test
1996
6004
∼3200
38 Mechanical
∼18
16.4
171
Homogeneous reservoir model. Rate dependent Skin was observed.
The effects of the condensate banking are observed in the GOR
response, at higher drawdowns the GOR increased.
Well 1
Post-Frac Test
1997
5660
∼3410 ∼20
14.2
171
Homogeneous reservoir model. Some drainage area is still above
the dew point.
Well 1
Drainage area
Below dew-point
1998
5150 3000
∼5
4.3
171
Homogeneous reservoir model. Derivative curve indicates radial
flow with a low value of gas effective permeability out to a radius
of ∼800 ft followed by an increase in effective permeability further
out. This is interpreted as being due to liquid condensate drop-out.
Well 1
Injector PFO
1998
5050 5380
∼3 ∼Zero skin for
other
than non -Darcy
∼11.4
171
Homogeneous reservoir model. A small negative mechanical skin is
suggested possibly due to activation of fractures by injecting
pressure/temperature. The well is in an under-injecting situation.
Well 2
1995
6267
∼3100
Total
∼19
Total Mechanical
∼0
8.35
429
Three layer model.
Well 2
1998
4600 2772
∼1
Includes Turbulent
and Condensate
effects
0.6
993
Homogeneous reservoir model. Entire drainage area is below dew
point pressure. The explanation for the reduced skin is that due to
rate dependent relative permeability and pressure dependent
saturation, the condensate impact on relative permeability is less
close to the wellbore than deeper in the reservoir.
Well 2
Injector PFO
1999
5500? 6947
∼1(@100 ft)
2.9
993
(@100 ft)
Homogeneous reservoir model. P
*
is difficult to estimate because of
the variation of Kh with radius. Given that the pressure at 100 ft
radius is well above dew point, it is of some concern that Kh has
not been fully restored. At a radius of 350 ft the Kh reduces below
2000 md-ft.