Chlorine free extraction of cellulose from rice husk and whisker isolation
Bạn đang xem bản rút gọn của tài liệu. Xem và tải ngay bản đầy đủ của tài liệu tại đây (854.49 KB, 8 trang )
Carbohydrate
Polymers
87 (2012) 1131–
1138
Contents
lists
available
at
SciVerse
ScienceDirect
Carbohydrate
Polymers
jo
u
rn
al
hom
epa
ge:
www.elsevier.com/locate/carbpol
Chlorine-free
extraction
of
cellulose
from
rice
husk
and
whisker
isolation
Simone
M.L.
Rosa, Noor
Rehman, Maria
Inez
G.
de
Miranda, Sônia
M.B.
Nachtigall, Clara
I.D.
Bica
∗
Chemistry
Institute,
Federal
University
of
Rio
Grande
do
Sul,
PO
Box
15003,
ZIP
91501-970,
Porto
Alegre,
RS,
Brazil
a
r
t
i
c
l
e
i
n
f
o
Article
history:
Received
13
May
2011
Received
in
revised
form
1
August
2011
Accepted
24
August
2011
Available online 31 August 2011
Keywords:
Cellulose
whiskers
Rice
husk
Biomaterials
Microscopy
Peroxide
bleaching
Thermal
analysis
a
b
s
t
r
a
c
t
This
work
reports
the
isolation
of
cellulose
whiskers
from
rice
husk
(RH)
by
means
of
an
environ-
mental
friendly
process
for
cellulose
extraction
and
bleaching.
The
multistep
process
begins
with
the
removal
of
pectin,
cutin,
waxes
and
other
extractives
from
rice
husk,
then
an
alkaline
treatment
for
the
removal
of
hemicelluloses
and
lignin,
and
a
two-step
bleaching
with
hydrogen
peroxide/tetra-
acetylethylenediamine
(TAED),
followed
by
a
mixture
of
acetic
and
nitric
acids,
for
further
delignification
of
the
cellulose
pulp.
The
techniques
of
infrared
absorption
spectroscopy
(ATR-FTIR),
scanning
elec-
tron
microscopy
(SEM),
thermogravimetric
analysis
(TGA),
modulated
differential
scanning
calorimetry
(MDSC)
and
X-ray
diffraction
(XRD)
showed
that
the
overall
process
is
adequate
to
obtain
cellulose
with
high
purity
and
crystallinity.
This
cellulose
was
submitted
to
sulfuric
acid
hydrolysis
with
the
aim
to
iso-
late
the
whiskers.
They
showed
the
typical
elongated
rod-like
aspect
as
revealed
by
transmission
electron
microscopy
(TEM)
and
atomic
force
microscopy
(AFM).
© 2011 Elsevier Ltd. All rights reserved.
1.
Introduction
Rice
husk
(RH)
is
one
of
the
major
agricultural
residues
gen-
erated
as
a
byproduct
during
the
rice
milling
process.
The
Food
and
Agriculture
Organization
of
the
United
Nations
(FAO)
forecasts
that
the
global
rice
production
stands
at
around
466
million
tonnes
in
2010/2011
(FAO,
2010).
About
23%
of
this
amount
consists
of
RH
(Chandrasekhar,
Satyanarayana,
Pramada,
Raghavan,
&
Gupta,
2003).
The
Brazilian
rice
production
has
been
in
the
order
of
12
mil-
lion
tonne/year
and
Rio
Grande
do
Sul
(the
southernmost
state
of
Brazil)
is
responsible
for
60%
of
this
production
(IBGE,
2010).
Most
of
the
RH
produced
is
either
used
as
a
bedding
material
for
animals
and
discarded
in
land
fillings
or
simply
burned
in
the
fields
lead-
ing
to
air
and
soil
pollution.
The
expressive
content
of
about
20%
silica
in
RH
and,
after
burning,
more
than
90%
silica
in
RH
ash
have
stimulated
extensive
research
which
suggested
the
potential
use
of
RH
and
its
ash
as
sources
of
inorganic
chemicals
(Chandrasekhar
et
al.,
2003).
In
the
present
work
we
propose
the
use
of
RH
as
a
new
source
for
obtaining
cellulose
whiskers
and
we
employ
a
totally
chlorine-free
technique
(TCF)
to
extract
and
bleach
cellulose
from
RH.
The
isolation
of
highly
pure
cellulose
from
wheat
straw
(Sun,
Sun,
Su,
&
Sun,
2004)
and
barley
straw
(Sun,
Xu,
Sun,
Xiao,
&
Sun,
2005)
using
totally
chlorine-free
technologies
has
been
addressed
in
the
scientific
literature
but
not
yet
from
rice
husk.
It
is
well
known
that
the
main
components
of
plant
fibers
are
cellulose,
hemicelluloses
and
lignin.
Cellulose,
which
awards
the
∗
Corresponding
author.
Tel.:
+55
51
3308
7236;
fax:
+55
51
3308
7304.
address:
(C.I.D.
Bica).
mechanical
properties
of
these
materials,
is
ordered
in
microfib-
rils
enclosed
by
the
other
two
components,
hemicellulose
and
lignin
(Morán,
Alvarez,
Cyras,
&
Vazquez,
2008).
Cellulose
is
the
most
ubiquitous
and
abundant
natural
polymer
on
the
planet,
given
its
presence
in
plants
and
its
widespread
use
for
ropes,
sails,
paper,
timber
for
housing
and
many
other
applications.
By
far,
the
most
commercially
exploited
natural
resource
contain-
ing
cellulose
is
wood
(Eichhorn
et
al.,
2010)
but
cellulose
is
the
main
component
of
several
other
well
employed
natural
fibers
such
as
cotton,
flax,
hemp,
jute
and
sisal
(Morán
et
al.,
2008).
It
is
expected
that
the
supply
of
wood
at
a
reasonable
price
will
be
insufficient
in
the
future
and,
apart
from
the
natural
fibers
men-
tioned
above,
agricultural
byproducts
will
become
more
attractive
as
sources
of
cellulose
(Leitner,
Hinterstoisser,
Wastyn,
Keckes,
&
Gindl,
2007).
In
recent
years
there
has
been
a
remarkable
interest
in
cel-
lulose
fibers
of
nanometric
dimensions.
Cellulose
whiskers
and
microfibrils
are
examples
of
nanocellulose
and
result
from
differ-
ent
isolation
methods
leading
to
diverse
dimensions
and
aspect
ratios
(Siró
&
Plackett,
2010).
Cellulose
whiskers
are
elongated
crys-
talline
rod-like
nanoparticles
being
generally
isolated
by
means
of
acid
hydrolysis
which
removes
the
amorphous
domains
existing
in
cellulose
fibers.
Cellulose
microfibrils
in
turn
are
obtained
from
mechanical
treatment
being
long
and
flexible
nanoparticles
which
consist
of
alternating
crystalline
and
amorphous
strings
(Siqueira,
Bras,
&
Dufresne,
2009).
Cellulose
whiskers
have
been
isolated
from
different
vegetable
sources
such
as
cotton
and
eucalyptus
(Berg,
Capadona,
&
Weder,
2007;
Dong,
Revol,
&
Gray,
1998;
Hafraoui
et
al.,
2008)
and
from
animal
sources
such
as
tunicates
(Berg
et
al.,
2007;
Hafraoui
et
al.,
2008).
Considering
vegetable
origin,
there
0144-8617/$
–
see
front
matter ©
2011 Elsevier Ltd. All rights reserved.
doi:10.1016/j.carbpol.2011.08.084
1132 S.M.L.
Rosa
et
al.
/
Carbohydrate
Polymers
87 (2012) 1131–
1138
are
only
a
few
papers
which
describe
the
isolation
of
whiskers
from
agricultural
byproducts,
as
for
example
wheat
straw
(Herbert,
Cavaillé,
&
Dufresne,
1996),
pea
hull
fiber
(Chen,
Liu,
Chang,
Cao,
&
Anderson,
2009),
branch-barks
of
mulberry
(Li
et
al.,
2009)
and
coconut
husks
(Rosa
et
al.,
2010).
As
far
as
we
know,
the
isolation
of
cellulose
whiskers
from
rice
husk
sources
has
not
been
yet
described
in
the
literature
but
only
the
isolation
of
silicon
carbide
whiskers
from
RH
(Sujiroti
&
Leangsuwan,
2003)
and
of
cellulose
whiskers
from
rice
straws
(Orts
et
al.,
2005).
So,
the
fractionation
of
lignocellulosic
materials
of
rice
husks
into
its
constitutive
components
by
environmental
friendly
techniques
has
been
the
subject
of
our
work
with
the
objective
of
cellulose
whisker
isolation.
RH
and
intermediate
RH
products
of
the
multistep
extraction
procedure
were
characterized
through
scanning
electron
microscopy
(SEM),
thermogravimetry
(TGA)
and
attenuated
total
reflectance-infrared
absorption
spectroscopy
(ATR-FTIR).
The
purified
cellulose
was
characterized
by
modu-
lated
differential
scanning
calorimetry
(MDSC),
wide-angle
X-ray
diffraction
(WAXD)
as
well
as
TGA
and
ATR-FTIR.
The
whiskers
were
characterized
by
transmission
electron
microscopy
(TEM)
and
atomic
force
microscopy
(AFM).
The
properties
of
purified
cellu-
lose
isolated
from
rice
husk
were
compared
to
the
properties
of
commercial
microcrystalline
cellulose
(MCC).
2.
Experimental
2.1.
Materials
Rice
husk
was
supplied
by
Engenho
Meirebe
(Eldorado
do
Sul/RS,
Brazil).
Hexane
(Fmaia,
Brazil),
ethanol
(Fmaia,
Brazil),
sodium
hydroxide
(Labsynth,
Brazil),
hydrogen
perox-
ide
(CAQ
Química,
Brazil),
nitric
acid
(Fmaia,
Brazil),
acetic
acid
(CAQ
Química,
Brazil),
tetra-acetylethylenediamine
(TAED)
(Acros
Organics,
New
Jersey,
USA)
were
used
as
received.
All
solvents
and
reagents
were
of
analytical
grade.
Microcrystalline
cellulose
(MCC)
was
supplied
by
Quimsul.
2.2.
Procedures
2.2.1.
Isolation
of
cellulose
Rice
husks
were
previously
ground.
The
dried
RH
was
sequen-
tially
dewaxed
with
hexane/ethanol/water
in
a
Soxhlet
apparatus.
The
extractive
content
was
found
to
be
6.8%.
Delignification
was
done
at
121
◦
C,
in
autoclave
(Stermax
20EHD),
using
a
5%
aqueous
NaOH
with
a
1:30
straw
to
liquor
ratio
(g/mL)
for
30
min
being
this
step
based
on
a
procedure
described
by
Uesu,
Pineda,
and
Hechenleitner
(2000),
adapted
to
rice
husk.
The
dispersions
were
treated
with
ultrasound
for
30
min.
In
order
to
remove
the
remain-
ing
hemicelluloses
and
lignin,
the
resulting
pulp
was
bleached
following
a
procedure
described
by
Sun,
Sun,
Su,
et
al.
(2004):
the
pulp
was
treated
with
2%
H
2
O
2
and
0.2%
TAED
solution,
at
pH
11.8,
for
12
h,
at
48
◦
C.
The
liquor
to
pulp
ratio
was
25:1
(mL/g).
To
purify
the
cellulose
pulp,
5.0
mL
of
80%
(v/v)
acetic
acid
and
0.5
mL
of
concentrated
nitric
acid
(70%,
v/v)
were
added
to
150
mg
of
pulp,
the
mixture
was
then
placed
into
a
preheated
oil
bath
at
120
◦
C,
for
15
min
or
30
min.
Once
cooled,
the
supernatant
was
then
carefully
decanted
and
the
cellulose
was
washed
sequentially
with
95%
ethanol
(20
mL),
distilled
water
(20
mL),
and
again
95%
ethanol
(20
mL)
to
remove
extraction
breakdown
products
and
traces
of
nitric
acid.
Finally,
the
purified
cellulose
was
dried
in
an
oven
at
60
◦
C
until
constant
mass.
Departing
from
raw
rice
husks
(∼9
wt%
water),
the
total
yield
of
extracted
cellulose
was
28
wt%.
2.2.2.
Isolation
of
the
cellulose
whiskers
The
purified
cellulose
was
mixed
with
sulfuric
acid
64%
(w/w)
at
a
ratio
of
1:8.75
(g/mL)
as
described
by
Dong
et
al.
(1998),
at
temperature
of
25
◦
C.
The
hydrolysis
time
was
fixed
at
60
min.
The
reactions
were
stopped
by
pouring
the
mixture
into
a
large
amount
of
cold
water.
The
excess
of
sulfuric
acid
was
removed
by
centrifugation
(3000
rpm,
30
min),
using
an
ALC
centrifuge
PK
120,
followed
by
a
prolonged
dialysis
(regenerated
cellulose
membrane
Fisher,
cut-off
10,000–14,000
Da)
against
pure
water.
This
proce-
dure
ensured
that
all
ionic
materials
were
removed
except
the
H
3
O
+
counterions
associated
with
the
sulfate
groups
on
the
surface
of
the
whiskers
(Dong
et
al.,
1998).
The
whiskers
were
further
dispersed
by
an
ultrasonic
treatment
(Ultrasonic
equipment
Thornton,
Model
USC-1400).
Although
the
strong
nitric
and
sulfuric
acids
were
used
in
the
overall
procedure,
the
effluents
turned
to
be
dilute
and
were
easily
neutralized.
2.3.
Characterization
2.3.1.
Rice
husk
and
cellulose
Scanning
electron
micrographs
of
dried
RH,
extractive
free
and
alkaline
treated
RH
were
obtained
using
a
JEOL
®
microscope
JSM
6060
operating
at
20
kV.
The
test
specimens
were
attached
to
an
aluminum
stub
and
sputtered
with
gold
to
eliminate
the
electron
charging
effects.
WAXD
experiments
were
performed
using
a
Siemens
D-500
diffractometer.
Purified
RH
cellulose
(after
30
min
bleaching
and
also
called
as
RH
cellulose)
and
MCC
were
scanned
in
the
reflection
mode
using
an
incident
X-ray
of
CuK␣
with
wavelength
of
1.54
´
˚
A
at
a
step
width
of
0.05
◦
min
−1
from
2Â
=
0
to
40
◦
.
The
Segal
method
was
used
to
calculate
the
crystallinity
of
the
samples
(Thygesen,
Oddershede,
Lilholt,
Thomsen,
&
Stahl,
2005).
Eq.
(1)
was
used
to
calculate
the
sample
crystallinity
(X
CR
).
X
CR
=
I
200
−
I
AM
I
200
×
100%
(1)
where
I
200
is
the
height
of
the
200
peak,
which
represents
both
crystalline
and
amorphous
material
and
I
AM
is
the
lowest
height
between
the
200
and
110
peaks,
which
represents
amorphous
material
only.
In
our
study
we
performed
a
preliminary
experiment
in
a
muffle
furnace
under
air
atmosphere
to
determine
the
ash
content
of
rice
husk.
TGA
scans
were
carried
out
from
35
to
700
◦
C
at
a
heating
rate
of
10
◦
C
min
−1
and
under
inert
atmosphere
of
N
2
in
a
flux
of
50
mL
min
−1
(TA
Instruments
model
TGA
Q5000
IR).
Sample
weight
was
typically
kept
at
17
mg.
The
TGA
microbalance
has
a
precision
of
±0.1
g.
MDSC
was
performed
using
a
DSC
Q2000
differential
scan-
ning
calorimeter
from
TA
Instruments.
Sample
weight
was
kept
at
∼7
mg
using
hermetically
sealed
pans
with
a
pinhole
in
the
lid.
Two
procedures
were
made
using
purified
RH
cellulose
(after
30
min
bleaching)
in
MDSC.
In
the
first
one,
the
samples
were
analysed
as
obtained
after
bleaching
treatment,
equilibrated
at
35
◦
C
for
5
min
and
heated
up
to
395
◦
C
at
heating
rate
of
5
◦
C
min
−1
.
In
addition,
a
second
procedure
was
made
applying
a
ramp
of
30
◦
C
min
−1
from
room
temperature
to
150
◦
C
and
equilibrating
at
this
temperature
for
5
min
to
remove
adsorbed
water,
as
suggested
in
the
literature
(Cabrales
&
Abidi,
2010;
Picker
&
Hoag,
2002).
After
this
isothermal
condition,
samples
were
cooled
until
35
◦
C
and
a
second
scan
was
performed
at
5
◦
C
min
−1
up
to
395
◦
C.
The
MDSC
analyses
were
car-
ried
on
under
inert
atmosphere
of
N
2
in
a
flux
of
50
mL
min
−1
using
an
amplitude
of
temperature
modulation
of
±1
◦
C
and
a
period
modulation
of
60
s.
Structural
changes
between
MCC,
RH,
RH
intermediate
prod-
ucts
and
purified
RH
cellulose
were
revealed
by
using
ATR-FTIR
with
64
scans
and
a
resolution
of
2
cm
−1
,
in
a
Nicolet
6700
spectrophotometer.
S.M.L.
Rosa
et
al.
/
Carbohydrate
Polymers
87 (2012) 1131–
1138 1133
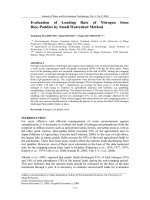
Fig.
1.
ATR-FTIR
spectra
for
RH,
RH
extractive-free,
alkaline
treated
RH
(RH
after
15
min
autoclave),
RH
cellulose
(after
30
min
bleaching)
and
commercial
cellulose
(MCC)
in
the
range
from
2000
to
800
cm
−1
.
2.3.2.
Cellulose
whiskers
For
the
TEM
images,
drops
of
RH
whisker
aqueous
suspensions
were
deposited
on
glow-discharged
carbon
coated
TEM
grids
and
the
excess
of
water
was
let
to
evaporate.
The
specimens
were
neg-
atively
stained
with
2%
uranyl
acetate
and
observed
using
a
JEOL
JEM
1200FxII
electron
microscope
operating
at
80
kV.
The
whisker
dimensions
were
determined
with
the
aid
of
the
Image
Tools
soft-
ware.
AFM
observations
were
carried
out
using
a
Molecular
Imag-
ing
Pico
Plus
microscope
operating
in
air
and
intermittent
contact
mode
with
a
Micromash
NC36
tip.
Drops
of
dilute
aqueous
suspen-
sions
of
RH
cellulose
whiskers
were
deposited
onto
freshly
cleaved
mica.
After
30
min,
the
excess
liquid
was
removed
and
the
remain-
ing
film
allowed
to
dry.
3.
Results
and
discussion
3.1.
Characterization
of
the
rice
husk
and
rice
husk
cellulose
3.1.1.
Spectroscopic
characterization
FTIR
spectroscopy
has
been
extensively
used
in
cellulose
research,
since
it
presents
a
relatively
easy
method
of
obtaining
direct
information
on
chemical
changes
that
occur
during
various
chemical
treatments
(Sun,
Sun,
Zhao,
&
Sun,
2004).
By
identifying
the
functional
groups
present,
FTIR
allows
to
know
about
the
chem-
ical
structure
of
each
compound.
In
this
work
FTIR
was
employed
with
the
aim
of
verifying
if
lignin
and
hemicelluloses
were
removed
from
the
extracted
cellulose.
In
this
work
FTIR
spectra
of
RH,
RH
free
of
extractives,
com-
mercial
cellulose
(MCC),
and
purified
RH
cellulose
were
obtained.
All
samples
presented
two
main
absorbance
regions.
The
first
one
at
high
wavenumbers
corresponds
to
the
range
2700–3500
cm
−1
(Fig.
1S,
Supplementary
material),
and
the
second
one
at
lower
wavenumbers,
to
the
range
800–1800
cm
−1
approximately.
The
lat-
ter
can
be
seen
in
Fig.
1.
The
broad
absorption
band
with
peaks,
depending
on
the
sample,
located
from
3330
to
3360
cm
−1
is
due
to
stretching
of
–OH
groups
and
that
one
near
2900
cm
−1
is
related
to
the
C–H
stretching
vibrations.
The
band
at
1640
cm
−1
could
be
assigned
to
the
C
C
stretching
of
aromatic
rings
of
lignin
but
it
is
also
present
in
the
spectrum
of
commercial
cellulose.
According
to
various
authors
(Morán
et
al.,
2008;
Sun,
Sun,
Su,
et
al.,
2004;
Zuluaga,
Putaux,
Restrepo,
Mondragon,
&
Ga
˜
nán,
2007),
this
band
relates
to
the
bending
mode
of
adsorbed
water.
All
samples
were
carefully
dried
before
the
ATR-
FTIR
spectra
were
taken,
but,
as
reported
in
the
literature,
it
is
difficult
to
completely
dry
cellulose
due
to
its
strong
interaction
with
water
(Morán
et
al.,
2008;
Szczesniak,
Rachocki,
&
Tritt-Goc,
2008).
All
materials
analysed
presented
this
absorption
band
but
specific
absorptions
can
also
be
seen
in
the
spectra.
The
absorp-
tion
band
at
1176
cm
−1
corresponds
to
C–O–C
asymmetrical
bridge
stretching.
As
pointed
out
by
Sun,
Sun,
Su,
et
al.
(2004),
a
strong
peak
at
1049
cm
−1
arises
from
C–O–C
pyranose
ring
skeletal
vibra-
tion.
In
Fig.
1
it
can
be
seen
that
this
peak
changes
its
form
in
the
RH
cellulose
as
far
as
it
appears
as
a
doublet.
In
comparison
to
the
spectrum
of
commercial
cellulose,
it
can
be
concluded
that
hemi-
celluloses
were
extensively
removed.
The
sharp
peak
at
910
cm
−1
is
characteristic
of
-glycosidic
linkages
between
the
sugar
units
(Sun,
Sun,
Su,
et
al.,
2004).
The
spectra
of
RH
and
RH
free
of
extrac-
tives
show
two
absorptions
characteristic
of
lignin:
a
weak
band
at
1510
cm
−1
(also
C
C
stretching
of
aromatic
ring)
and
a
broad
shoul-
der
at
1244
cm
−1
(C–O
stretching
of
the
ether
linkage)
which
are
absent
in
the
spectrum
of
RH
cellulose
as
well
as
that
of
commer-
cial
cellulose.
According
to
Viera
et
al.
(2007),
the
absence
of
these
bands
indicates
that
most
of
the
lignin
was
removed.
So
in
RH
cel-
lulose
the
extraction
procedures
removed
most
of
lignin
polymers
because
of
the
disappearance
of
the
lignin-associated
absorbances
at
1510
cm
−1
and
1244
cm
−1
.
In
the
spectrum
of
RH
cellulose
it
can
also
be
identified
a
peak
at
1725
cm
−1
(C
O
of
ketone)
which
proba-
bly
arises
from
partial
acetylation
of
RH
cellulose
during
the
second
bleaching
step
where
acetic
acid
is
employed
as
also
mentioned
by
other
authors
(Morán
et
al.,
2008;
Sun,
Sun,
Su,
et
al.,
2004;
Zuluaga
et
al.,
2007).
In
the
spectra
of
RH
and
RH
free
of
extrac-
tives
a
peak
at
1734
cm
−1
can
be
seen
which
can
also
be
assigned
to
C
O
of
ketone
but
due
to
hemicelluloses.
Fig.
1
also
shows
an
ATR-FTIR
spectrum
of
extractive-free
cellulose
pulp
obtained
after
15
min
of
alkaline
treatment,
in
autoclave,
and
before
the
bleaching
steps.
In
this
spectrum
there
is
not
any
absorbance
in
the
carbonyl
region.
3.1.2.
Scanning
electron
microscopy
(SEM)
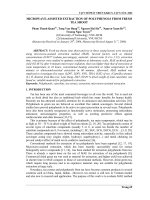
By
SEM
it
was
possible
to
detect
different
effects
on
the
RH
sur-
face
according
to
the
stages
of
pre-extraction
and
pulping,
as
shown
in
Fig.
2.
The
changes
in
the
outer
epidermis
show
the
chemical
attack
suffered
by
the
material
at
different
stages.
In
comparison
to
extractive-free
rice
husk
(Fig.
2a),
after
15
min
of
alkaline
treatment
in
autoclave,
it
can
be
seen
that
the
rice
husk
particles
changed
from
flat
to
rolled
shape
(Fig.
2b).
Fig.
2c
shows
the
surface
of
extractive-free
rice
husk
with
the
presence
of
sil-
ica
particles.
A
similar
aspect
of
RH
surface
was
also
reported
by
Chandrasekhar
et
al.
(2003).
Fig.
2d
shows
that
these
particles
were
removed
after
15
min
in
autoclave.
In
Fig.
2e
filaments
can
be
seen
on
the
outer
epidermis
in
the
regions
where
protuberances
were
removed
after
30
min
in
autoclave.
Fig.
2f
shows
that
after
1
h
in
autoclave
the
surface
did
not
change
significantly.
So
30
min
in
autoclave
was
chosen
as
the
optimum
time.
By
comparing
Fig.
2g
(15
min
in
autoclave)
and
Fig.
2h
(30
min
in
autoclave)
it
can
be
noticed
that
the
inner
epidermis
is
also
modified
when
the
auto-
clave
treatment
is
increased
to
30
min.
This
alkaline
treatment
in
autoclave
also
causes
a
reduction
of
the
average
size
of
RH
particles
(Fig.
2S,
Supplementary
material).
3.1.3.
Thermogravimetric
analysis
(TGA)
Fig.
3
shows
the
thermal
degradation
pattern
of
the
commer-
cial
cellulose
(MCC),
crude
RH,
and
RH
cellulose
(after
15
min
and
30
min
bleaching).
All
samples
showed
a
thermal
event
below
150
◦
C
corresponding
to
dehydration.
The
mass
loss
of
water
in
this
step
was
determined
from
45
◦
C
to
150
◦
C.
It
was
about
3.8
wt%
for
1134 S.M.L.
Rosa
et
al.
/
Carbohydrate
Polymers
87 (2012) 1131–
1138
Fig.
2.
SEM
micrographs
of
RH
after
various
stages
of
chemical
attack:
a,
b)
outer
epidermis
of
RH
extractive-free
(bars:
200
m
and
10
m,
respectively);
c,
d)
RH
outer
epidermis
after
15
min
in
autoclave
(100
m
and
10
m,
respectively);
e)
RH
outer
epidermis
after
30
min
in
autoclave
(bar:
10
m,
both);
f)
RH
outer
epidermis
after
60
min
in
autoclave
(bar:
10
m);
g)
RH
inner
epidermis
after
15
min
in
autoclave
(bar:
10
m);
h)
RH
inner
epidermis
after
30
min
in
autoclave
(bar:
10
m).
MCC,
9.0
wt%
for
crude
RH,
5.8
wt%
for
RH
cellulose
after
15
min
bleaching
and
5.7
wt%
for
RH
cellulose
after
30
min
bleaching.
The
effective
thermal
degradation
of
the
RH
constituents
begins
above
200
◦
C
and
refers
to
bond
cleavage
of
hemicellulose,
cellulose
and
lignin.
It
is
possible
to
verify
that
RH
cellulose
showed
higher
ther-
mal
stability
than
the
precursor
RH,
since
in
these
samples
the
components
that
start
to
degrade
at
lower
temperature
had
been
removed.
The
crude
RH
main
decomposition
peak
is
considerably
wider
than
those
of
the
other
samples
due
to
the
decomposition
of
hemicelluloses
and
lignin.
Commercial
cellulose
and
RH
cellulose
decomposed
in
a
single
step.
This
behavior
suggests
the
absence
of
hemicellulose
and
lignin
in
the
RH
cellulose
obtained.
The
DTG
curve
of
RH
cellulose
does
not
show
the
shoulder
close
to
the
cellu-
lose
peak
that
refers
to
the
hemicellulose.
This
is
in
accordance
with
the
FTIR
results
previously
shown.
The
maximum
rate
of
decompo-
sition
of
RH
cellulose
occurred
at
345
◦
C.
This
temperature
agrees
well
with
the
value
of
348
◦
C
found
by
Morán
et
al.
(2008)
for
the
Fig.
3.
DTGA
curves
for
commercial
cellulose
(MCC),
RH,
RH
cellulose
after
15
min
bleaching
and
RH
cellulose
(30
min
bleaching).
decomposition
peak
of
commercial
cellulose
and
355
◦
C
found
by
Yang,
Yan,
Chen,
Lee,
&
Zheng
(2007),
determined
at
same
heat-
ing
rate.
The
commercial
cellulose
showed
higher
T
max
than
the
RH
cellulose
isolated
in
this
step.
According
to
the
literature,
the
higher
the
decomposition
temperature
obtained
by
thermogravi-
metric
analysis
the
greater
the
crystallinity
of
cellulose
(Alemdar
&
Sain,
2008;
Chen
et
al.,
2011;
Uesu,
Pineda,
&
Hechenleitner,
2000).
However,
the
discussions
have
been
recently
improved
considering
other
effects
that
can
influence
the
temperature
peak
of
degrada-
tion:
presence
of
substances
bonded
to
microfibril
surfaces
(Vila,
Barneto,
Fillat,
Vidal,
&
Ariza,
2011),
crystal
size
of
cellulose
(Kim,
Eom,
&
Wada,
2010)
and
the
atmosphere
environment
used
(usu-
ally
nitrogen
or
air)
(Mamleev,
Bourbigot,
&
Yvon,
2007;
Vila
et
al.,
2011).
RH
presented
a
high
residual
mass
at
the
end
of
the
experi-
ment
(700
◦
C),
around
26%.
The
ash
content
of
rice
husk
determined
under
air
atmosphere
in
this
work
was
16
wt%
at
1000
◦
C.
The
result
agrees
perfectly
well
with
Zhao
et
al.
(2009).
Even
considering
that
the
analysis
was
performed
under
nitrogen
atmosphere,
this
was
an
especially
high
value
and
it
was
related
to
the
high
silica
con-
tent
of
RH
(Rosa,
Nachtigall,
&
Ferreira,
2009).
At
700
◦
C
residues
of
about
8%
for
commercial
cellulose,
15%
for
RH
cellulose
after
15
min
bleaching
and
11%
for
RH
cellulose
after
30
min
bleaching
can
be
determined
from
the
TGA
curves
(Fig.
3S,
Supplementary
material).
As
indeed
evidenced
by
the
X-ray
diffraction
study,
the
crystallinity
index
of
RH
cellulose
is
lower
than
that
of
the
commercial
cellulose.
Another
explanation
may
be
related
to
the
partial
acetylation
of
RH
cellulose
evidenced
by
the
presence
of
an
absorption
at
1725
cm
−1
in
the
ATR-FTIR
spectrum.
3.1.4.
Modulated
differential
scanning
calorimetry
(MDSC)
Modulated
differential
scanning
calorimetry
(MDSC)
permits
the
separation
of
the
total
heat
flow
signal
into
its
reverse
heat
flow
and
non-reverse
heat
flow
components.
The
separation
is
based
not
only
on
thermodynamic
reversibility
but
also
on
changes
occurring
when
a
sinusoidal
modulation
is
overlaid
on
a
conventional
linear
heating
rate
during
an
experiment.
In
this
sense,
MDSC
arises
as
an
exciting
way
to
increase
the
understanding
of
rice
husk
cellulose
thermal
properties.
The
effects
of
temperature
on
amorphous
and
crystalline
regions
of
rice
husk
cellulose
were
studied
by
MDSC.
S.M.L.
Rosa
et
al.
/
Carbohydrate
Polymers
87 (2012) 1131–
1138 1135
Fig.
4.
MDSC
curves
of
total
(1),
reverse
(2)
and
non-reverse
(3)
heat
flow
at
5
◦
C
min
−1
:
(a)
RH
cellulose
(30
min
bleaching),
under
first
procedure;
(b)
RH
cellulose
(30
min
bleaching),
under
second
procedure;
(c)
MCC,
under
first
procedure;
(d)
MCC,
under
second
procedure.
Considering
literature
using
DSC
technique,
as
reported
by
Morán
et
al.
(2008)
and
Yang
et
al.
(2007),
the
fusion
of
the
crystalline
fraction
of
some
types
of
cellulose
shows
a
narrow
endothermic
peak
close
to
330
◦
C.
This
transition
can
move
to
lower
temperatures
depending
on
factors
such
as
molecular
weight,
amount
of
amorphous
content,
crystallite
sizes,
etc.
Sometimes,
an
exothermic
peak
is
found
in
the
same
region,
which
has
been
related
to
a
degradation
process
(Morán
et
al.,
2008).
According
to
Mamleev
et
al.’s
studies
(2007),
a
depolymerization
by
transglyco-
sylation
occurs
at
310
◦
C
during
cellulose
pyrolysis.
As
both
events
can
be
superimposed,
they
cannot
be
easily
distinguished
in
many
cases.
Fig.
4a
shows
the
heat
flow
curves
of
RH
cellulose
analysed
by
MDSC.
Considering
total
and
non-reverse
heat
flow
curves,
they
show
two
main
events.
The
first
endothermic
peak
observed
below
150
◦
C
is
due
to
loss
of
water.
The
second
endothermic
transition
starts
around
270
◦
C
with
a
peak
at
320
◦
C
and
is
related
to
cel-
lulose
melting.
A
smooth
exothermic
transition
can
be
detected
near
340
◦
C.
This
event
has
its
onset
overlapped
with
the
end
of
the
endothermic
region
and
can
be
related
to
the
depolymerization
of
cellulose
as
supported
by
the
equivalent
peak
in
the
non-reverse
heating
curve.
Such
conclusion
is
also
corroborated
by
the
TGA
study
which
shows
a
maximum
of
weight
loss
for
RH
cellulose
in
the
same
temperature
region.
On
the
other
hand,
an
important
change
in
the
heat
capacity
of
the
medium
can
also
be
seen
between
300
◦
C
and
330
◦
C
in
the
reverse
heat
flow
curve.
This
indicates
a
change
in
chemical
composition
as
a
result
of
the
depolymerization
reac-
tion.
The
absence
of
an
endotherm
in
reversing
signal
indicates
that
this
thermal
event
is
a
kinetic
transformation.
By
visual
inspection
of
the
pan,
very
few
solid
residues
were
found
at
this
stage
and
charring
process
was
evident.
Fig.
4b
shows
the
MDSC
curves
of
RH
cellulose
submitted
to
the
second
procedure
described
in
the
experimental
section,
with
an
isothermal
step
to
eliminate
water.
As
expected,
it
was
not
found
any
peak
due
to
water
release.
A
well-defined
endothermic
tran-
sition
is
present
beyond
300
◦
C
which
is
similar
to
that
of
Fig.
4a
being
related
to
melting
and
volatilization
as
well.
However
the
small
exothermic
peak
following
this
transition
was
not
clearly
seen
in
the
total
and
non-reverse
curves.
The
thermograms
profiles
of
RH
cellulose
are
very
similar
to
those
of
MCC
which
are
shown
in
Fig.
4c
and
d.
In
comparison
to
MCC,
the
peak
maximum
of
the
endothermic
transition
detected
beyond
300
◦
C
occurred
at
lower
temperature
for
RH
cellulose
(as
assigned
by
arrows
T
RH
=
321
◦
C,
in
Fig.
4a
and
b,
and
T
MCC
=
344
◦
C
in
Fig.
4c
and
d)
independently
of
water
presence
as
it
was
observed
in
total
and
non-reverse
heating
curves.
In
this
study,
it
was
observed
that
all
samples
showed
well-
defined
endothermic
peaks
corresponding
to
the
fusion
of
its
crystalline
part,
as
shown
in
Fig.
4a–d.
However,
cellulose
sam-
ples
with
water
adsorbed
(Fig.
4a
and
c)
showed
more
clearly
the
exothermic
peaks
following
melting.
This
suggests
that
the
degra-
dation
mechanism
responsible
for
the
exothermic
peak
is
affected
by
the
presence
of
water.
3.1.5.
Wide
angle
X-ray
diffraction
(WAXD)
It
can
be
observed
in
Fig.
5
that
the
major
crystalline
peak
for
each
sample
occurred
at
around
2Â
=
22
◦
which
represents
the
cellulose
crystallographic
plane
(2
0
0).
The
crystallinity
index
of
1136 S.M.L.
Rosa
et
al.
/
Carbohydrate
Polymers
87 (2012) 1131–
1138
Fig.
5.
X-ray
diffraction
patterns
of
MCC
and
RH
cellulose
(30
min
bleaching).
RH
cellulose
(calculated
by
Segal
formula)
was
approximately
67%
while
that
of
MCC
was
estimated
as
79%.
For
comparison,
the
crys-
tallinity
index
of
other
samples,
as
reported
in
the
literature,
was
found
to
be
around
66%
for
potato
tuber
cellulose,
68%
for
rice
straw
cellulose
and
71%
for
wood
cellulose
(Abe
&
Yano,
2009).
It
can
be
concluded
that
the
procedure
employed
in
this
study
for
cel-
lulose
extraction
from
rice
husk
is
adequate
for
obtaining
samples
with
high
crystallinity.
It
was
reported
that
highly
crystalline
fibers
and
fibril
aggregates
could
be
more
effective
in
achieving
higher
reinforcement
for
composite
materials
(Cheng,
Wang,
Rials,
&
Lee,
2007).
In
addition
it
can
be
noticed
in
Fig.
5
that
RH
cellulose
can
be
classified
as
cellulose
I,
since
there
is
no
doublet
in
the
intensity
of
the
peak
at
ca.
2Â
=
22
◦
.
A
similar
finding
was
reported
by
Morán
et
al.
(2008)
for
sisal
cellulose
extracted
by
other
procedures.
3.2.
Characterization
of
cellulose
whiskers
Basically,
microscopy
has
been
the
preferred
technique
for
the
morphological
characterization
in
studies
involving
cellulose
whiskers.
In
this
study,
AFM
and
TEM
were
used
to
investigate
the
morphology
and
size
of
the
dispersed
structures.
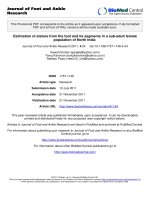
The
atomic
force
micrograph
in
Fig.
6
shows
the
sample
obtained
after
60
min
of
hydrolysis.
It
was
possible
to
see
the
isolated
cellu-
lose
fibrils
free
from
the
other
components
of
rice
husks.
Most
of
Fig.
6.
AFM
image
of
RH
cellulose
whiskers
obtained
after
60
min
of
acid
hydrolysis.
the
hydrogen
bonds
that
kept
the
whiskers
associated
were
prob-
ably
disrupted
after
this
procedure.
However,
some
aggregates
are
still
present.
By
TEM
(Fig.
7a
and
b),
structures
in
the
form
of
needles
rang-
ing
from
100
to
400
nm
in
length
and
6
to
14
nm
in
width
were
observed.
The
average
length
value
was
L
=
(143
±
64)nm
while
the
average
thickness
was
d
=
(8
±
2)nm.
Such
dimensions
are
compara-
ble
to
those
of
whiskers
originating
from
cotton
(Beck-Candanedo,
Roman,
&
Gray,
2005;
Bica,
Borsali,
Rochas,
&
Geissler,
2006;
Hafraoui
et
al.,
2008),
wood
(Beck-Candanedo
et
al.,
2005),
pea
hull
fiber
(Chen
et
al.,
2009)
and
coconut
husks
(Rosa
et
al.,
2010).
The
RH
whiskers
show
lengths
shorter
than
in
the
case
of
branch-barks
of
mulberry
(Li
et
al.,
2009)
but
RH
whiskers
are
much
thinner.
The
aspect
ratio
shows
an
average
value
near
18.
In
Fig.
6
some
RH
whiskers
appeared
more
aggregated
in
the
form
of
bundles
as
also
observed
by
Heux,
Chauve,
and
Bonini
(2000)
in
the
case
of
cotton
whiskers.
According
to
Hafraoui
et
al.
(2008),
such
nanostructures
can
be
composed
of
a
varying
number
of
parallel
subunits
of
cellu-
lose
chains.
The
high
aspect
ratio
of
the
cellulose
whiskers
obtained
from
rice
husk
indicates
that
these
structures
exhibit
promising
Fig.
7.
TEM
images
of
RH
cellulose
whiskers
(bars
correspond
to
100
nm).
S.M.L.
Rosa
et
al.
/
Carbohydrate
Polymers
87 (2012) 1131–
1138 1137
behavior
as
nanofillers
for
polymer
matrices,
providing
valorization
of
this
worldwide
produced
agricultural
waste.
4.
Conclusions
Residues
from
plants
are
interesting
alternatives
as
cellulose
sources
for
several
applications.
In
this
work
a
chlorine-free
pro-
cedure
for
the
isolation
of
cellulose
from
rice
husk
was
shown
to
be
very
efficient.
The
overall
process
does
not
produce
any
toxic
effluents.
On
the
basis
of
the
whole
cellulose
content
expected
for
rice
husk,
this
method
resulted
in
a
yield
around
74%.
TGA
anal-
ysis
performed
under
nitrogen
showed
high
residual
mass
for
RH
at
700
◦
C.
This
can
be
partially
attributed
to
the
high
silica
con-
tent
of
the
material.
In
our
study,
the
ash
content
of
RH
at
1000
◦
C
was
determined
to
be
16
wt%.
FTIR,
TGA
and
MDSC
analyses
agreed
well
with
respect
to
the
elimination
of
hemicellulose
and
lignin
from
rice
husk
after
the
purification
procedure
used
to
isolate
cel-
lulose.
WAXD
experiments
indicated
that
the
crystallinity
of
RH
cellulose
(67%)
was
lower
than
that
of
MCC
(79%).
Lower
crys-
tallinity
has
been
pointed
out
as
a
factor,
among
others,
that
can
lower
the
thermal
degradation
temperature.
The
decomposition
temperature
of
RH
cellulose
was
found
to
be
lower
than
commer-
cial
microcrystalline
cellulose.
Besides
water
elimination,
the
MDSC
analyses
showed
one
main
endothermic
event
for
cellulose
samples
(RH
cellulose
and
MCC),
which
was
related
to
the
melting
of
cellu-
lose
crystals.
The
TGA
and
MDSC
results
agree
well
with
respect
to
the
thermal
stability
of
rice
husk
cellulose
and
helped
to
improve
the
knowledge
on
the
complex
behavior
of
cellulose
degradation.
Cellulose
whiskers
were
successfully
obtained
by
sulfuric
acid
hydrolysis
of
the
rice
husk
cellulose.
According
to
TEM
and
AFM
images,
it
was
possible
to
isolate
needle-like
structures
of
cellu-
lose
whiskers,
with
sizes
varying
from
6
to
14
nm
in
width
and
100–400
nm
in
length.
The
average
values
of
length
and
thickness
of
these
whiskers
give
an
aspect
ratio
around
18.
Such
a
value
of
aspect
ratio
is
adequate
for
application
of
RH
whiskers
as
nanofillers
in
polymer
matrices.
In
this
way
the
use
of
rice
husk
as
a
novel
material
source
allows
to
obtain
new
particles
with
nanometric
dimensions
widening
the
supply
of
nanostructured
materials
usable
for
poly-
mer
nanocomposites.
Acknowledgements
The
authors
would
like
to
thank
Conselho
Nacional
de
Desen-
volvimento
Científico
e
Tecnológico
(CNPq)
for
grant
474278/2007-
7
and
fellowship
TWAS/CNPq;
Coordenac¸
ão
de
Aperfeic¸
oamento
de
Pessoal
de
Ensino
Superior
(CAPES)
and
Fundac¸
ão
de
Amparo
à
Pesquisa
do
Estado
do
Rio
Grande
do
Sul
(FAPERGS)
for
fellow-
ships
(also
CAPES/REUNI);
Centro
de
Microscopia
Eletrônica
of
the
Federal
University
of
Rio
Grande
do
Sul
(CME/UFRGS)
and
Ms.
M.
Queiroz
for
technical
assistance
during
the
TEM
and
SEM
anal-
yses;
Mr.
O.
Machado
(Instituto
de
Física/UFRGS)
for
performing
the
WAXD
measurements,
Dr.
J.
Vaghetti
(IQ/UFRGS)
for
technical
assistance
during
TGA
and
MDSC
analyses
and
Ms.
N.
Reis
for
help
in
the
first
experiments
of
this
project.
Appendix
A.
Supplementary
data
Supplementary
data
associated
with
this
article
can
be
found,
in
the
online
version,
at
doI:10.1016/j.carbpol.2011.08.084
References
Abe,
K.,
&
Yano,
H.
(2009).
Comparison
of
the
characteristics
of
cellulose
microfibril
aggregates
of
wood,
rice
straw
and
potato
tuber.
Cellulose,
16,
1017–1023.
Alemdar,
A.,
&
Sain,
M.
(2008).
Isolation
and
characterization
of
nanofibers
from
agricultural
residues
–
Wheat
straw
and
soy
hulls.
References
and
further
reading
may
be
available
for
this
article.
To
view
references
and
further
reading
you
must
purchase
this
article.
Bioresource
Technology,
99,
6554–6561.
Beck-Candanedo,
S.,
Roman,
M.,
&
Gray,
D.
G.
(2005).
Effect
of
reaction
conditions
on
the
properties
and
behavior
of
wood
cellulose
nanocrystal
suspensions.
Biomacromolecules,
6,
1048–1054.
Berg,
O.,
Capadona,
J.
R.,
&
Weder,
C.
(2007).
Preparation
of
homogeneous
disper-
sions
of
tunicate
cellulose
whiskers
in
organic
solvents.
Biomacromolecules,
8,
1353–1357.
Bica,
C.
I.
D.,
Borsali,
R.,
Rochas,
C.,
&
Geissler,
E.
(2006).
Dynamics
of
cel-
lulose
whiskers
spatially
trapped
in
agarose
hydrogels.
Macromolecules,
39,
3622–3627.
Cabrales,
L.,
&
Abidi,
N.
(2010).
On
the
thermal
degradation
of
cellulose
in
cotton
fibers.
Journal
of
Thermal
Analysis
&
Calorimetry,
102,
485–491.
Chandrasekhar,
S.,
Satyanarayana,
K.
G.,
Pramada,
P.
N.,
Raghavan,
P.,
&
Gupta,
T.
N.
(2003).
Processing,
properties
and
applications
of
reactive
silica
from
rice
husk
–An
overview.
Journal
of
Materials
Science,
38,
3159–3168.
Chen,
Y.,
Liu,
C.,
Chang,
P.
R.,
Cao,
X.,
&
Anderson,
D.
P.
(2009).
Bionanocomposites
based
on
pea
starch
and
cellulose
nanowhiskers
hydrolysed
from
pea
hull
fibre:
Effect
of
hydrolysis
time.
Carbohydrate
Polymers,
76,
607–615.
Chen,
W.,
Yu,
H.,
Liu,
Y.,
Chen,
P.,
Zhang,
M.,
&
Hai,
Y.
(2011).
Individualization
of
cellulose
nanofibers
from
wood
using
high-intensity
ultrasonic
combined
with
chemical
pretreatments.
Carbohydrate
Polymers,
83,
1804–1811.
Cheng,
Q.,
Wang,
S.,
Rials,
T.
G.,
&
Lee,
S H.
(2007).
Physical
and
mechanical
prop-
erties
of
polyvinyl
alcohol
and
polypropylene
composite
materials
reinforced
with
fibril
aggregates
isolated
from
regenerated
cellulose
fibers.
Cellulose,
14,
593–602.
Dong,
X.
M.,
Revol,
J F.,
&
Gray,
D.
G.
(1998).
Effect
of
microcrystallite
preparation
conditions
on
the
formation
of
colloid
crystals
of
cellulose.
Cellulose,
5,
19–32.
Eichhorn,
S.
J.,
Dufresne,
E.
A.,
Araguren,
E.
M.,
Marcovich,
E.
N.
E.,
Capadona,
E.
J.
R.,
Rowan,
E.
S.
J.,
et
al.
(2010).
Review:
Current
international
research
into
cellulose
nanofibres
and
nanocomposites.
Journal
of
Materials
Science,
45,
1–33.
FAO
(2010).
Global
cereal
supply
and
demand
brief.
Crop
prospects
&
food
situation
(no.
4
(Dec),
p.
5).
/>
Accessed
06.02.11.
Hafraoui,
S.,
Nishiyama,
Y.,
Putaux,
J L.,
Heux,
L.,
Dubreuil,
F.,
&
Rochas,
C.
(2008).
The
shape
and
size
distribution
of
crystalline
nanoparticles
prepared
by
acid
hydrolysis
of
native
cellulose.
Biomacromolecules,
9,
57–65.
Herbert,
W.,
Cavaillé,
J.
Y.,
&
Dufresne,
A.
(1996).
Thermoplastic
nanocomposites
filled
with
wheat
straw
cellulose
whiskers.
Part
I:
Processing
and
mechanical
behavior.
Polymer
Composites,
17,
604–611.
Heux,
L.,
Chauve,
G.,
&
Bonini,
C.
(2000).
Nonflocculating
and
chiral-nematic
self-
ordering
of
cellulose
microcrystals
suspensions
in
nonpolar
solvents.
Langmuir,
16,
8210–8212.
IBGE
(2010).
Grupo
de
Coordenac¸
ão
de
Estatísticas
Agropecuárias
(Dec
2010).
/>201012 12.shtm
Accessed
06.02.11.
Kim,
U.,
Eom,
S.
H.,
&
Wada,
M.
(2010).
Thermal
decomposition
of
native
cellulose:
Influence
on
crystalline
size.
Polymer
Degradation
and
Stability,
95,
778–781.
Leitner,
J.,
Hinterstoisser,
B.,
Wastyn,
M.,
Keckes,
J.,
&
Gindl,
W.
(2007).
Sugar
beet
cellulose
nanofibril-reinforced
composites.
Cellulose,
14,
419–425.
Li,
R.,
Fei,
J.,
Cai,
Y.,
Li,
Y.,
Feng,
J.,
&
Yao,
J.
(2009).
Cellulose
whiskers
extracted
from
mulberry
–
A
novel
biomass
production.
Carbohydrate
Polymers,
76,
94–99.
Mamleev,
V.,
Bourbigot,
S.,
&
Yvon,
J.
(2007).
Kinetic
analysis
of
the
thermal
decom-
position
of
cellulose:
The
main
step
of
mass
loss.
Journal
of
Analytical
and
Applied
Pyrolysis,
88,
151–165.
Morán,
J.
I.,
Alvarez,
V.
A.,
Cyras,
V.
P.,
&
Vazquez,
A.
(2008).
Extraction
of
cellulose
and
preparation
of
nanocellulose
from
sisal
fibers.
Cellulose,
15,
149–159.
Orts,
W.
J.,
Shey,
J.,
Imam,
S.
H.,
Glenn,
G.
M.,
Guttman,
M.
E.,
&
Revol,
J.
F.
(2005).
Appli-
cation
of
cellulose
microfibrils
in
polymer
nanocomposites.
Journal
of
Polymers
and
the
Environment,
13,
301–306.
Picker,
K.
M.,
&
Hoag,
S.
W.
(2002).
Characterization
of
the
thermal
properties
of
microcrystalline
cellulose
by
modulated
temperature
differential
scanning
calorimetry.
Journal
of
Pharmaceutical
Sciences,
91,
342–349.
Rosa,
S.
M.
L.,
Nachtigall,
S.
M.
B.,
&
Ferreira,
C.
A.
(2009).
Thermal
and
dynamic-
mechanical
characterization
of
rice-husk
filled
polypropylene
composites.
Macromolecular
Research,
17(1),
8–13.
Rosa,
M.
F.,
Medeiros,
E.
F.,
Malmonge,
J.
A.,
Gregorsky,
K.
S.,
Wood,
D.
F.,
Mat-
toso,
L.
H.
C.,
et
al.
(2010).
Cellulose
nanowhiskers
from
coconut
husk
fibers:
Effect
of
preparation
conditions
on
their
thermal
and
morphological
behavior.
Carbohydrate
Polymers,
81(1),
83–92.
Siqueira,
G.,
Bras,
J.,
&
Dufresne,
A.
(2009).
Cellulose
whiskers
versus
microfibrils:
Influence
of
the
nature
of
the
nanoparticle
and
its
surface
functionalization
on
the
thermal
and
mechanical
properties
of
nanocomposites.
Biomacromolecules,
10,
425–432.
Siró,
I.,
&
Plackett,
D.
(2010).
Microfibrillated
cellulose
and
new
nanocomposite
materials:
A
review.
Cellulose,
17,
459–494.
Sujiroti,
K.,
&
Leangsuwan,
P.
(2003).
Silicon
carbide
formation
from
pretreated
rice
husks.
Journal
of
Materials
Science,
38,
4739–4744.
Sun,
X.
F.,
Sun,
R.
C.,
Su,
Y.,
&
Sun,
J.
X.
(2004).
Comparative
study
of
crude
and
purified
cellulose
from
wheat
straw.
Journal
of
Agricultural
Food
Chemistry,
52,
839–847.
Sun,
J.
X.,
Sun,
X.
F.,
Zhao,
H.,
&
Sun,
R.
C.
(2004).
Isolation
and
characteriza-
tion
of
cellulose
from
sugarcane
bagasse.
Polymer
Degradation
&
Stability,
84,
331–339.
Sun,
J.
X.,
Xu,
F.,
Sun,
X F.,
Xiao,
B.,
&
Sun,
R.
C.
(2005).
Physico-chemical
and
thermal
characterization
of
cellulose
from
barley
straw.
Polymer
Degradation
&
Stability,
88,
521–531.
1138 S.M.L.
Rosa
et
al.
/
Carbohydrate
Polymers
87 (2012) 1131–
1138
Szczesniak,
L.,
Rachocki,
A.,
&
Tritt-Goc,
J.
(2008).
Glass
transition
temperature
and
thermal
decomposition
of
cellulose
powder.
Cellulose,
15,
445–451.
Thygesen,
A.,
Oddershede,
J.,
Lilholt,
H.,
Thomsen,
A.
B.,
&
Stahl,
K.
(2005).
On
the
determination
of
crystallinity
and
cellulose
content
in
plant
fibres.
Cellulose,
12,
563–576.
Uesu,
C.
N.
Y.,
Pineda,
E.
A.
G.,
&
Hechenleitner,
A.
A.
W.
(2000).
Microcrystalline
cellulose
from
soybean
husk:
Effects
of
solvent
treatments
on
its
properties
as
acetylsalicylic
acid
carrier.
International
Journal
of
Pharmaceutics,
206,
85–96.
Viera,
R.
G.
P.,
Rodrigues,
G.,
Assunc¸
ão,
R.
M.
N.,
Meireles,
C.
S.,
Vieira,
J.,
&
Oliveira,
G.
S.
(2007).
Synthesis
and
characterization
of
methylcellulose
from
sugarcane
bagasse
cellulose.
Carbohydrate
Polymers,
67,
182–189.
Vila,
C.,
Barneto,
A.
G.,
Fillat,
A.,
Vidal,
T.,
&
Ariza,
J.
(2011).
Use
of
thermogravi-
metric
analysis
to
monitor
the
effect
of
natural
laccase
mediators
on
flax
pulp.
Bioresource
Technology,
102,
6554–6561.
Yang,
H.,
Yan,
R.,
Chen,
H.,
Lee,
D.
H.,
&
Zheng,
C.
(2007).
Characteristics
of
hemicel-
lulose,
cellulose
and
lignin
pyrolysis.
Fuel,
86,
1781–1788.
Zhao,
Q.,
Zhang,
B.,
Quan,
H.,
Yamb,
R.
C.
M.,
Yuen,
R.
K.
K.,
&
Li,
R.
K.
Y.
(2009).
Flame
retardancy
of
rice
husk-filled
high-density
polyethylene
ecocomposites.
Composites
Science
and
Technology,
69,
2675–2681.
Zuluaga,
R.,
Putaux,
J L.,
Restrepo,
A.,
Mondragon,
I.,
&
Ga
˜
nán,
P.
(2007).
Cellu-
lose
microfibrils
from
banana
farming
residues:
Isolation
and
characterization.
Cellulose,
14,
585–592.