Evaluation of Loading Rate of Nitrogen from Rice-Paddies by Small Watershed Method
Bạn đang xem bản rút gọn của tài liệu. Xem và tải ngay bản đầy đủ của tài liệu tại đây (597.87 KB, 14 trang )
Journal of Water and Environment Technology, Vol. 6, No.2, 2008
Evaluation of Loading Rate of Nitrogen
Rice-Paddies by Small Watershed Method
from
Yoshitaka SUGIMOTO*, Yukio KOMAI**, Takao KUNIMATSU***
* Environmental Science Graduate School, Graduate School of the University of Shiga
Prefecture, 2500 Hassaka, Hikone, Shiga 522-8533, Japan
** Department of Environmental Technology, Faculty of Technology, Osaka Institute of
Technology, 5-16-1 Omiya, Asahi-ku, Osaka, 535-8585, Japan
*** School of Environmental Sciences, the University of Shiga Prefecture, 2500 Hassaka,
Hikone, Shiga 522-8533, Japan
ABSTRACT
Nitrogen concentrations of drainage, percolation and irrigation were monitored periodically once
a week at the experimental small rice-paddy watershed (EPW, 6.96 ha) for three years. Water
level of the draining ditch was recorded continuously at the end of EPW. During the cropping
period, load L of nitrogen through the drainage were evaluated from the concentrations C and the
flow rates Q by integration interval method. During the non-cropping period, L was calculated
from L(Q)-equations and Q. The L(Q)-equations were derived from the data measured during
storm-runoff events. Concentrations of total nitrogen (TN) of irrigation, drainage and percolation
were 0.403, 1.39 and 1.11 mg l-1, respectively, on average for three years. L of the drainage
changed in wide range in response to agricultural practices and rainfalls; e.g. puddling,
transplanting, fertilizing and plowing. The annual net-load of TN (unit load Ln) was 35.8±4.05
kg ha-1 y-1 on average for three years, of which the non-cropping period occupied 37 %. L for the
puddling and transplanting period was discharged 27% of Ln, and strongly affected by the
applied volume of irrigation. These results suggest that observations for only cropping periods or
for only one year are insufficient for evaluating the precise Ln to assess the effect of the nitrogen
discharged from paddy fields on lakes.
Keywords: nitrogen, rice paddy, load
INTRODUCTION
For more effective and efficient managements of water environments against
eutrophication, it is necessary to evaluate the loads of nitrogen and phosphorus from the
nonpoint or diffuse sources such as agricultural lands, forests, and urban areas as well as
the other point sources. Rice-paddy fields occupied 54% of the agricultural area in
Japan (Minister of Agriculture, Forestry and Fisheries, 2008). In the case of Lake Biwa,
the largest lake in Japan, paddy fields account for 92% of the total agricultural-fields in
the catchments. There have been many studies about the nutrient loads discharging from
rice paddies. However, most of them were estimated on the base of the data measured
only for the cropping season from April to October (Takamura et al., 1976, 1977, 1979;
Kubota et al., 1979; Udo et al., 2000; Kaneki R., 2003; Cho J. Y. et al., 2008).
Takeda et al. (1991) reported that paddy fields discharged 52% of total nitrogen (TN)
and 14% of total phosphorus (TP) of the annual loads during the non-cropping period.
This also indicates that the nutrient loads should be estimated on the base of the data
monitored through a year. It is necessary to estimate storm-runoff loads for evaluation
Address correspondence to Takao Kunimatsu, School of Environmental Sciences, the University of
Shiga Prefecture,
Email:
Received October 31, 2008, Accepted December 5, 2008.
- 113 -
Journal of Water and Environment Technology, Vol. 6, No.2, 2008
50°N
Russia
China
Japan
North Korea Sea
JAPAN
South Korea
40°N
Wakasa
Bay
30°N
Pacific Ocean
120°E
130°E
Lake
Biwa
140°E
Hikone
Kyoto
Shiga Pref.
(EPW)
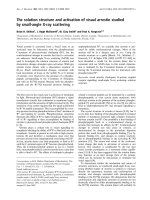
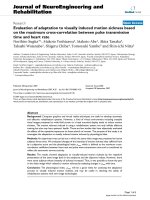
Fig. 1 - Experimental small watershed (EPW) and sampling sites. □: Site-A was the sampling site of
drainage, ●: experimental wells Pa1-Pa4, ∆: site measuring atmospheric deposition.
of the loads for the non-cropping periods, which are usually induced by rainfalls. Only
two studies, however, estimated the annual loads on the base of the data obtained by the
year-round monitoring (Takeda et al., 1991; Kondoh et al., 1992). In addition, the
pollutant loads may be affected by the yearly changes of hydrological conditions and
agricultural practices. Therefore, the monitoring should be continued all the year round
for more than several years.
In this study, material balance of TN was estimated from the results obtained from
continuous observations for three years at a small watershed of rice-paddies.
MATERIALS AND METHODS
Study site
The experimental small rice-paddy watershed (EPW) was shown in Fig. 1, which is in
agricultural areas in Hikone city located around the middle part of Honshu, main island
of Japan (Sugimoto et al., 2006). Area of EPW (35° 15' 01" N, 136°12' 43"E) is 6.96 ha
in rice-paddy areas, and consists of 29 small rice-paddy sections (0.1-0.7 ha). Irrigation
was pumped up from Lake Biwa (675 km2, 275×108 m3) and distributed to each section
via pipeline-pump systems. A drainage ditch (540 mm in width and 600 mm in depth)
runs through the middle of EPW from the upper end of EPW and do not collect any
drainage from the outside of EPW. The ditch flows at about 200 m downstream into
Ezura River. The watershed lies between 85.6 and 86.1 m from the sea level (T.P.) and
1.2-1.7 m from the water level of Lake Biwa (84.4 m T.P.). The type of the surface soil
of EPW is alluvial gray soil. Chemical properties of the paddy soil were summarized in
Table 1.
The rice plant, Koshihikari, had been cultivated on the all sections for three years since
2004 after crop rotation from wheat. In this region, young rice plants are usually
transplanted after plowing, fertilizing, flooding and puddling in mid-April to early-May.
- 114 -
Journal of Water and Environment Technology, Vol. 6, No.2, 2008
Table 1 - Chemical properties of soils of the experimental paddies.
depth
(cm)
0-20
20-40
pH (H2O)
5.77
5.60
EC
(µS cm-1)
85.6
86.8
T-C
(%)
2.42
2.09
T-N
(%)
0.241
0.203
Average values of four samples collected at Pa1-Pa4 (Fig. 1) on Oct. 3 and 9, 2003.
Nitrogen applied for a crop season was 83 kg ha-1 in chemical fertilizers in 2004. The
cultivation under EnFA began from 2005 to 2006. EnFA requires reducing the applying
amounts of the chemical fertilizers of nitrogen to less than half of the previous usage
amounts, which was allowed to supply with organic fertilizers. Then, the amounts of
nitrogen applied by chemical fertilizers were reduced to 36 kg ha-1 in 2005, and
supplied with additional application of 36 kg ha-1 in organic fertilizers. In 2006, the
amounts of nitrogen fertilizer were 78 kg ha-1, a half of which was organic fertilizers.
EnFA also requires preventing rice-paddies from muddy discharge during the puddling
and transplanting practices.
Rice paddies are flooded from mid-April through August with a drainage period for
about ten days from late June to early July. After harvest in mid-September, paddies are
dried up and plowed at the first time in late November and the second time in March.
Each practice usually continued for duration of about two weeks in EPW, owing to
convenience of more than ten tillers.
Hydrological measurement
Long-term water balance in paddy watersheds is usually expressed by the following
equation:
R + I = D + P + ET + ∆S
(1)
where R, I, D, and P are depths of rainfall, irrigation, drainage and percolation,
respectively, ET is depth of evapotranspiration, and ∆S is the change of flooding water
and ground water.
A gauge having a pressure sensor was installed on the bottom of the ditch at the end of
EPW (Site-A in Fig. 1), and sequentially recorded the water level of drainage at an
interval of 10 minute. Flow rates Q were calculated from the water levels by following
equation:
Q = ah b
(2)
where h is water level measured at Site-A, and a and b are coefficients obtained from
the logarithmic linear regression of the relationships between Q and h, measured during
storm-runoff observations, by the least-squares method. However, Q were not calculated
for some periods (usually 4-5 days) missing the data of the water levels due to
backwater from Ezura River caused from heavy rains (5 events for the experimental
years) as well as snow covers (5 events). Q was calculated for those periods as
following;
1) Irrigation period: calculated with Equation (1) by using I estimated from the
volumes of water supply through the pump station.
2) Non-irrigation period: estimated on the base of the correlation between rainfalls
and surface drainages obtained during periods not affected by the backwater events.
- 115 -
Journal of Water and Environment Technology, Vol. 6, No.2, 2008
Table 2 - Conditions carried out storm-runoff observations during non-cropping periods.
event
duration
rainfall
runoff
runoff
year
date
soil condition
No.
(days)
(mm)
(mm)
ratio
1
2
3
4
5
6
7
*1
2003
2003
2004
2004
2004
2004
2006
14 Oct.
03 Nov.
14 Jan.*1, 2
07 Mar. *2
30 Mar.
08 Oct.
26 Feb.
2
3
10
5
3
3
3
before plowing
before plowing
after plowing
after plowing
after plowing
before plowing
after plowing
25.0
17.5
68.5
33.0
33.5
70.5
28.0
19.3
06.6
61.6
17.7
11.7
65.0
13.2
0.77
0.38
0.90
0.54
0.35
0.92
0.47
Composite sample. *2 Snowmelt runoff.
The percolation rates in 2004, 2005, and 2006 were estimated to be 0.23, 0.59, and 0.67
mm d-1 by the water balance of Equation (1) during each non-cropping period. The
average value of 0.50 mm d-1 was applied to the cropping period. Because the irrigation
water was supplied through pipe line in the area, as mentioned above, we could not
measure directly the irrigation rate. Then, the irrigation rates were calculated weekly
from the water balance of Equation (1) on the assumption ∆S = 0. Daily precipitations
were obtained from Hikone Local Meteorological Observatory, located at 5 km
northeast EPW. ET was estimated by Thornthwaite method (Kayane I., 1980).
Water sampling
Water samples of drainage, percolation (around 60 cm below soil surface) and irrigation
were collected periodically once a week. The observations were started from August
2003 to September 2006. Drainages were taken up at Site-A. From mid April to late
May including the puddling and transplanting period, the drainage waters were collected
at every six hours for a day, and mixed together in proportion to flow rates at each
sampling time to make daily composite samples, except 2005 when the drainage waters
were collected once a day. Storm-runoff observations were carried out during seven
events shown in Table 2, and the drainages were collected at every hour. The samples
obtained during Event 3 were mixed in proportion to flow rates at each sampling time to
make one composite sample.
PVC-pipes (10 cm in diameter and 130 cm in length), having small hales at 10-20 cm
from capped bottom and covered by cloth, were buried at Pa1-4 (Fig. 1) by using an
earth auger. The water samples of percolation were collected from the experimental
wells, and residual waters were pumped out after sampling. The same volumes of the
four samples were mixed together and fi1trated through glass fiber filter in the
laboratory. Irrigation waters were collected from some irrigation valves installed on
each paddy section.
Atmospheric wet and dry depositions were collected monthly by two bulk deposit
samplers laid on an open space in the University of Shiga Prefecture (Fig. 1). One of
them was consisted of a 20-cm diameter PE-funnel and of 20-liter PE-reservoir to
analyze EC, pH and NO3-N. The other sampler was composed with a 30-cm diameter
funnel and the reservoir contained 2 ml of conc.-H2SO4 for measuring other components.
The water samples were collected after measuring water volumes.
Water chemistry
Total nitrogen (TN) was analyzed non-filtered samples, and the dissolved component
- 116 -
Journal of Water and Environment Technology, Vol. 6, No.2, 2008
Table 3 - Water balance in the experimental small paddy-field watershed (EPW)
year
2004
year
*1
2005
non-cropping
cropping*2
(PuTp)*3
year
2006
non-cropping*1
cropping*2
(PuTp)*3
year
non-cropping*1
cropping*2
(PuTp)*3
*1
*2
*3
input
duration
(days)
period
precipitation
366)
197)
169)
(47)
365)
196)
169)
(47)
365)
196)
169)
(47)
1538)
612)
926)
(319)
1515)
799)
716)
(119)
1731)
803)
928)
(181)
(mm)
output
irrigation
2586)
0)
2586)
(776)
1806)
0)
1806)
(454)
2136)
0)
2136)
(615)
drainage
percolation
evapotranspiration
3145)
405)
2740)
(959)
2294)
523)
1771)
(449)
2864)
529)
2335)
(675)
131)
46)
85)
(24)
201)
116)
85)
(24)
216)
131)
85)
(24)
849
161
688
(112)
826
160
666
(101)
788
143
645
((98)
Non-cropping period (01 Oct-14 Apr)
Cropping period (15 Apr-30 Sep)
Puddling and transplanting period (15 April-31 May)
(DN) and other dissolved materials were analyzed fi1trated samples (l-µm in pore-size
glass fiber filter with a 45 mm diameter). The concentration of particulate nitrogen (PN)
was obtained from the difference between the total concentration of the non-filtered
sample and that of the filtered one. The dissolved organic nitrogen (DON) was
calculated by subtracting nitrite nitrogen (NO2-N), ammonium nitrogen (NH4-N) and
nitrate nitrogen (NO3-N) from DN. Chemical analyses were carried out as follows; TN
and DN were assayed by alkaline potassium peroxodisulfate digestion (120°C, 1.5 atm.)
- UV absorbance (260 nm) method; nitrite nitrogen by the diazonation method;
ammonium nitrogen by the indophenol blue method; nitrate nitrogen by suppressed ion
chromatographic method (HPLC) using a CTO-10A attached to Shim-pac IC-A3
(Shimadzu, Kyoto Japan).
RESULTS
Water balance
Water balances of EPW were summarized in Table 3. The depth of the irrigation and
precipitation were 2176 (ranged from 1806 to 2586) and 857 (716-928) mm,
respectively, on average for the three cropping periods. The drainage and percolation
were 2282 (1771-2740) and 85 mm. The evapotranspiration was 666 (645-688) mm.
The total input was 3033 mm, 75% of which drained through the ditch to Ezura River.
For the non-cropping period, the drainage, percolation and evapotranspiration were 486
(405-529), 97 (46-131) and 155 (143-161) mm, respectively, on average for the three
years. The input precipitation was 738 (612-803) mm, 66% of which discharged as
storm-runoff.
In 2005 and 2006 under EnFA-cultivation, the amount of the irrigation during the
puddling and transplanting period (defined from 15th April to 31st May) were reduced
from 776 in 2004 to 454 and 615 mm, respectively, even though the precipitation
decreased from 319 mm to 119 and 181 mm. As the results, the muddy drainage were
reduced from 959 mm to 449 and 675 mm. The total amounts of the input for the
- 117 -
Journal of Water and Environment Technology, Vol. 6, No.2, 2008
80
Non-cropping
Rice
Non-cropping
Rice
Non-cropping
5
Rice
(a)
4
3
40
2
20
1
0
8
concentration (mg l-1)
60
cumulative drainage (m)
daily drainage (mm d -1)
100
0
(b)
6
4
2
0
2003
|
2004
|
2005
|
2006
|
Fig. 2 - Daily changes of concentrations of TN. (a) Daily and cumulative drainage from rice paddy
watershed (EPW).
: drainage rate,
: cumulative load. (b) Change of concentration.
:
drainage,
: percolation,
: irrigation. The data of drainage having error bars show the standard
deviations of the data during storm-runoff events.
cropping period decreased from 3512 in 2004 to 2522 and 3064 mm in 2005 and 2006,
and the drainage from 2740 mm to 1771 and 2335 mm.
Water chemistry of paddy fields
TN concentrations of drainage, percolation, and irrigation were shown in Fig. 2, in
which the average concentrations and standard deviations of the storm-runoff
observations were included. The volume-weighted average concentrations were
summarized in Table 4.
Long-term fluctuation The concentrations of the irrigation, pumped up from Lake
Biwa, were relatively stable, and the annual average concentrations were in narrow
range from 0.368-0.414 mg l-1. In contrast, the concentrations of the drainage increased
abruptly at the beginning of the puddling in every late-April, and reached the yearly
maximums of 7.56, 5.29 and 4.55 mg l-1 in 2004, 2005 and 2006, respectively. The
period of the high concentration continued for a longer time in 2004 than in 2005 and
2006. Then, the concentration decreased to around 1 mg l-1 in late-May, and reached
around 0.5 mg l-1 in August with some small peaks in July and June. The concentration
increased to around 2 mg l-1, just after the irrigation and following harvest in
mid-September. In the non-cropping period, the concentrations decreased gradually to
around 1 mg l-1 by March, accompanying with many sharp and high fluctuations caused
by rainfalls and plowing, and then increased after the second plowing in mid-March to
mid-April. The concentrations of the percolation changed in the similar manner as the
drainage, however the peaks in the puddling and transplanting period were not so high
as those of the drainage. The average concentrations of the drainage and percolation
- 118 -
Journal of Water and Environment Technology, Vol. 6, No.2, 2008
Table 4 - Average concentrations of TN
year
2004
2005
period
year
non-cropping
cropping
year
2006
non-cropping
cropping
year
av.
non-cropping
cropping
year
non-cropping
cropping
irrigation
0.409
0.409
0.414
0.414
0.368
0.368
0.403
0.403
drainage
1.780
2.140
1.720
1.230
1.250
1.210
1.150
1.720
0.928
1.390
1.710
1.290
(mg l-1)
percolation
1.210
1.230
1.200
1.000
0.843
1.20 0
1.120
1.090
1.16 0
1.110
1.050
1.190
were 1.39 and 1.11 mg l-1, respectively, in which there were not so large differences.
Storm-runoff In the non-cropping period from mid-September to mid-April, the ditch
intermittently flowed drainage on the effect of rainfalls. It is necessary to make clear the
characteristics of the storm-runoff load for quantitative estimation of the nutrient load
during the non-cropping period. Seven storm-runoff events were observed in the
non-cropping period (Table 2). The volume-weighted average concentrations of
nitrogen were summarized in Table 5.
Results obtained from Event 2 before plowing and Event 5 after plowing were shown in
Fig. 3. The precipitations were 17.5 and 33.5 mm in depth, respectively, and the runoff
ratios were similar with each other as to be 38 and 35%. In Event 2, the concentrations
of the all kinds of nitrogen components were maximum at the beginning of the drainage,
and regardless of flow rate changes, decreased rapidly and then gradually and steadily.
The main components were DON and PN throughout the event. The average
concentration of TN was 1.87 mg l-1, and DON and PN occupied 38 and 34% of TN.
Event 5 was one of storm-runoffs after the second plowing in late-March, and showed
the typical pattern distinguished clearly from those before the plowings. The
concentration of TN increased just at the beginning of the drainage, and reached the
maximum of 3.33 mg l-1 at around the drainage peak. Then, the concentrations
decreased, as the drainage decreased, except for slightly increasing NH4-N. The increase
of TN was caused mainly by the increase of NO3-N and DON. The average
concentration of TN was 2.18 mg l-1. NO3-N, DON and PN occupied 33, 30 and 25% of
TN.
The changing patterns of the storm-runoff events were clearly different between before
and after plowings. These results indicated that surface soils of paddy-fields were
disturbed by the plowing practices and exposed under oxidative conditions. The soil
conditions would stimulate the mineralization of organic nitrogen, as Kunimatsu et al.
(1991) indicated.
Storm-runoff loads
Separate L(Q) method
It is well known that loading rates of materials and flow rates
- 119 -
Journal of Water and Environment Technology, Vol. 6, No.2, 2008
4
6
0.1
8
0.0
concentration (mg l-1)
5
4
5
10
3
TN
2
DN
1
NO3-N
0
NH4-N
3
2
6
8
4
3
30
31
10
1
TN
DN
2
1
0
4
5
November (2003)
4
0.1
5
4
0
0.2
0.0
concentration (mg l-1)
3
drainage (m3 km2 s-1)
2
0.2
0.3
rainfall (mm h-1)
0
rainfall (mm h-1)
drainage (m3 km2 s-1)
0.3
NO3-N
NH4-N
30
31
1
M arch (2004) April
Fig. 3 - Changes of drainage and nitrogen concentrations during storm runoff events. Left: Event 2
(before- plowing period), right: Event 5 (after-plowing period).
of rivers are related with each other by so-called L(Q)-equations. As a hysteresis during
the increasing and decreasing period of flow rate should be considered, a set of two
L(Q)-equations (Separated L(Q)-equation) were derived as follows:
LIi = c I QidI (Qi − Qi −1 > 0 )
(3)
LDi = c D QidD (Qi − Qi −1 ≤ 0 )
(4)
where Li and Qi are loads and flow rates at time i measured during storm-runoffs, c and
d are coefficients of the logarithmic linear regression calculated by the least-squares
method, and subscripts of I and D represent each L(Q)-equation in the increasing period
and the decreasing period of drainages, respectively.
The detail measurement of flow rates and TN concentrations of the drainage were
carried out for the five rain events (Table 2), which included three events before
plowing (Event 1, 2, and 6) and two events after plowing (Event 5 and 7). The resulted
relationships between these parameters were shown in Fig. 4, and the coefficients of
L(Q)-equations were summarized in Table 6. After the plowing, the value of d increased
Table 5 - Average concentrations weighted with drainage volume
during storm-runoff observations in non-cropping periods.
event
No.
1
2
3*1, 2
4*2
5
6
7
soil condition
before plowing
before plowing
after plowing
after plowing
after plowing
before plowing
after plowing
average concentration (mg l-1)
NO2-N
0.0040
0.0035
0.0032
0.0042
0.0083
-
NO3-N
0.0947
0.2010
0.4900
0.4050
0.7100
-
*1 Composite sample. *2 Snowmelt runoff.
- 120 -
NH4-N
0.105
0.314
0.154
0.262
0.255
-
DON
1.190
0.707
0.520
0.562
0.658
-
PN
0.465
0.644
0.353
0.520
0.548
0.599
-
TN
1.86
1.87
1.52
1.75
2.18
1.33
3.20
Journal of Water and Environment Technology, Vol. 6, No.2, 2008
10-1
10-1
Before-plowing period
After-plowing period
10-2
10-3
10-3
10-4
10-4
10-5
load of TN (g ha l-1 s-1)
10-2
10-5
10-6
10-5
10-4
10-3
10-2
3
-1 -1
drainage (m ha s )
10-1
10-6 -5
10
10-4
10-3
10-2
drainage (m3 ha-1 s-1)
10-1
Fig. 4 - Relationships between the loads of TN and the drainage rates obtained from the storm-runoff
observations. ●: increasing period of drainage rate, ○: decreasing period of drainage rate,
:
regression line of increasing period,
: and decreasing period.
Table 6 - Constants of L(Q)-equations derived from relationships between rates
of load and drainage during the storm-runoff events
L = c Qd
soil condition
before plowing
after plowing
increasing phase
cI
dI
R2
01.29
0.943
0.980
25.7
1.31
0.992
cD
000.736
031.8
decreasing phase
dD
R2
0.897
0.986
1.36
0.997
from 0.943 to 1.31 on the increasing phase and from 0.897 to 1.36 on the decreasing
phase. These results indicated that the loading rate of TN was significantly affected by
plowing of paddy soils.
L(R) method L(R) method was developed in order to evaluate storm-runoff loads by
using precipitations in cases of limited data of concentrations and flow-rates
(Kunimatsu et al., 1991; Kunimatsu et al., 2006). L(R)-equations were derived from the
correlation between the storm-runoff load LSi and corresponding rainfall depth Ri
measured during the storm runoff event i.
f
LSi = e (Ri − r )
(5)
where e and f are the coefficients obtained from the logarithmic linear regression by the
least-square method, and r is the ineffective rainfall, which is estimated from
R-intercept of the following equation obtained by linear regression of the relationship
between Ri and the storm-runoff discharge Qsi.
Qsi = k ( Ri − r )
(6)
where k and r are the coefficients obtained from the regression.
It was shown that the load is significantly affected by plowing of paddy soils, so a set of
two L(R)-equations corresponding before and after plowing should be derived. However,
the three and two data corresponding before and after plowing, respectively, were not
- 121 -
Journal of Water and Environment Technology, Vol. 6, No.2, 2008
104
storm runoff load of TN (g ha-1 s-1)
104
Before-plowing period
After-plowing period
103
103
102
102
101
100
101
102
101
100
101
102
effective rainfall (R - r) (mm)
effective rainfall (R - r ) (mm)
Fig. 5 - Relationships between rainfalls R and storm-runoff loads L during non-cropping periods. ●:
observed data, ○: calculated values by Separated L(Q)-equations using hourly flow-rate data during
the selected storm events. R: rainfall depth, r: ineffective rainfall depth.
Table 7- Coefficients of L(R)-equations during non-cropping periods.
Li = e (Ri - r)f
soil condition
before plowing
after plowing
e
24.3
13.6
f
0.876
1.320
R2
0.926
0.901
sufficient in number of samples to drive statistically reliable L(R)-equations. The
observation of storm-runoff events is not so easy to carry out sufficient times of the
observation. Then, the samples of storm-runoff loads were supplemented with the
storm-runoff loads calculated by using L(Q)-equations and hourly flow-rates data
selected from automatically recorded water levels. The observed storm-runoff loads as
well as calculated loads were plotted against the depths of the effective rainfalls on Fig.
5, and the coefficients of e and f were summarized in Table 7. The coefficients of
determination exceeded 0.9.
Evaluation of yearly drainage loads
There are some methods for calculating pollutant loads of rivers. In this study, TN load
of drainage through the ditch was calculated by combining the interval-loads method
(ILM) and L(Q)-equation method as following.
Irrigation period (15th April – 31th August) The drainage load was calculated on the
base of ILM-equation as following:
n
L = ∑ Ci Qi (ti +1 − ti −1 ) / 2
(7)
i =1
where Ci and Qi were concentrations and flow-rates measured at Site-A at time ti. The
data were obtained at a daily interval from the puddling through transplanting, and then
weekly till harvest.
Non-irrigation period The different L(Q)-equations were used between before and
- 122 -
daily net-load (kg ha -1 d-1)
2.0
Non-cropping
Rice
Non-cropping
Rice
Non-cropping
Rice
50
1.6
40
1.2
30
0.8
20
0.4
10
0.0
0
-0.4
|
2003
2004
|
2005
|
2006
|
cumulative net-load (kg ha -1)
Journal of Water and Environment Technology, Vol. 6, No.2, 2008
-10
Fig. 6 - Daily and cumulative net-loads of TN.
after plowing (20th November in the case of EPW), as shown in Table 6. The daily load
Ld were calculated with Separated L(Q) method, as following:
Ld =
24
∑cQ
i =1
d
hi
(8)
where Qhi is hourly flow rate, c and d were coefficients different between the increasing
and decreasing periods of flow-rates. There were three cases in which the flow-rates
were not measured; e.g. 1) trouble of the level gouge, 2) backwaters caused by heavy
storms, and 3) snow-covers over the ditch. In these cases, there were not hourly flow
rates but daily precipitations, so the storm-runoff load was calculated with L(R) method.
DISCUSSION
Material balance of paddy-field
In the paddy-field watershed irrigating river water, TN in the river flows into the
watershed. The input of TN is the irrigation load LI. The watershed returns drainage and
percolation into the river through the ditch and underground. The outputs of TN are the
drainage load LD and the percolation load LP, respectively. The input and output balance
of TN, namely the net pollutant load Lnet of the paddy-field watershed to the river is
defined as following:
Lnet = (LD + LP ) − LI
(9)
In this study, LI and LP were calculated from the weekly data of Ci and Qi with ILM
method. In the case of percolation, Ci was not measured from the beginning to
November in 2003, so Lp of the period was calculated by using the average
concentration of the same period in the second year (2004). Qi was estimated to be 0.50
mm for the irrigation period and 0.23-0.67 mm for the other period, as mentioned above.
LD was evaluated by the procedure shown in the foregoing section.
The daily and cumulative net-loads of TN were shown in Fig. 6. Because the irrigation
pumped up from Lake Biwa contained very low concentration of TN (0.37-0.41 mg l-1
on annual average) (Table 4), the daily net-loads were positive values through the
cropping period, except for few small and short-term negative values. Fertilizing,
puddling and transplanting were continuously carried out from late April to mid May,
the net-load drastically increased and reached around 0.6 kg ha-1 d-1 in 2004 and 1.0 kg
ha-1 d-1 in 2006. So the cumulative load increased steeply in the period. The lower
- 123 -
Journal of Water and Environment Technology, Vol. 6, No.2, 2008
Table 8 - Nitrogen balance of the experimental small paddy-field watershed (EPW)
year
2004
2005
(EnFA)
2006
(EnFA)
av.
periods*1
year
non-cropping
cropping
(PuTp)
year
non-cropping
Cropping
(PuTp)
year
non-cropping
cropping
(PuTp)
year
non-cropping
duration
(days)
*2
*2
366)
197)
169)
(47)
365)
196)
169)
(47)
365)
196)
169)
(47)
fertilizer
83
83
(39)
72
72
(33)
78
78
(39)
input
R
(11.9
(5.22
(6.64
(1.55)
(13.0
(6.02
(7.00
(2.31)
(12.8
(6.08
(6.75
(1.63)
I
(9.09
(0.00
(9.09
(4.46)
(7.00
(0.00
(7.00
(2.62)
(7.56
(0.00
(7.56
(2.50)
output
D
P
(45.8
(1.68
(10.0
(0.52
(35.8
(1.15
(18.4)
(0.31)
(36.2
(2.00
(12.6
(0.98
(23.6
(1.02
(6.81)
(0.22)
(43.0
(2.49
(14.3
(1.50
(28.7
(0.99
(12.5)
(0.20)
365)
196)
78
-
(12.6
(5.77
(7.88
(0.00
(41.6
(12.3
(2.06
(1.00
(kg ha-1)
net-load*2
(D + P - I)
(38.4
(10.6
(27.9
(14.2)
(31.2
(13.5
(17.6
(4.40)
(37.9
(15.8
(22.1
(10.2)
(35.8
(13.3
78
cropping
169)
(6.80
(7.88
(29.4
(1.06
(22.5
(37)
(PuTp)
(47)
(1.83)
(3.20)
(12.6)
(0.24)
(9.61)
*1
Non-cropping period (01 Oct-14 Apr), cropping period (15 Apr-30 Sep) including the puddling and
transplanting period (PuTp: 15 Apr-31 May).
*2
R: atmospheric deposition, I: irrigation, D: drainage, P: percolation.
loading peak in 2005 suggested the effect of EnFA. The net-loads also showed two or
three peaks reaching 0.5-0.6 kg ha-1 d-1 from June to August, which seemed to be
caused by the applications of additional fertilizers.
The drainages flow through the ditch only at rainfalls in the non-cropping season, so
that the daily net-loads showed isolated peaks. The daily net-loads increased frequently
up to around 1.0 kg ha-1 d-1, which was almost the same level as that of the cropping
period.
Unit load of paddy fields
The material balance on the yearly base was summarized in Table 8. LR in the table is
the atmospheric deposition load, which is not included in Equation (9) but listed for
reference. LR was calculated from monthly data of Ci of the water sample reserved in the
deposit sampler and Qi of the volume by ILM.
The annual net-load (unit load) of TN was 35.8±4.05 kg ha-1 y-1 on the average of three
years. The net-load of the cropping period was 22.5 kg ha-1, which occupied 63% of the
annual net-load. During the puddling and transplanting period, 43% of the net-load of
the cropping period was discharged, which corresponded with 27% of the annual
net-load. The net-load of the non-cropping period was 13.3 kg ha-1, and occupied 37%
of the annual net-load.
The annual net load varied in relatively wide range from year to year. These of 2004
and 2006 were similar with each other, however, that of 2005 was apparently smaller
than the former two. The difference (min.-max.; 31.2-38.4 kg ha-1 y-1) mainly resulted
from the difference in the net-load during the cropping periods (17.6-27.9 kg ha-1),
- 124 -
Journal of Water and Environment Technology, Vol. 6, No.2, 2008
especially the puddling and transplanting periods (4.40-14.2 kg ha-1). There were not so
large yearly changes in the net-loads of the non-cropping periods (10.6-15.8 kg ha-1).
CONCLUSIONS
By combine of interval-loads method (ILM) and Separated L(Q)-equations method, the
unit load of TN for rice-paddy was evaluated on the base of the data obtained from the
experimental small rice-paddy watershed (6.96 ha) located in alluvial low lands around
Lake Biwa. The unit load (annual net-load) of TN were 35.8 kg ha-1 y-1 (CV: 11%) on
the average of three years. It became clear that the unit loads of TN fluctuated in
relatively wide range from year to year because of yearly changes in hydrological
conditions as well as agricultural practices. The net-load during the non-cropping period
occupied 37% of the total load, which was larger than the load of the puddling and
transplanting period (27%). Then, water management during the non-cropping periods
as well as the puddling and transplanting periods is important for control over the
eutrophication of lakes and inland seas. Some results suggested the effect of
Environmental-Friendly Agriculture.
REFERENCES
Cho J. Y., Son J. G., Choi J. K., Song C. H. and Chung B. Y. (2008). Surface and
subsurface losses of N and P from salt-affected rice paddy fields of Saemangeum
reclaimed land in South Korea., Paddy Water Environ., 6: 211-219.
Kaneki R. (2003). Reduction of effluent nitrogen and phosphorus from paddy fields.,
Paddy Water Environ., 1: 133-138.
Kayane I. (1980). Evapotranspiration. In: Hydrology, Taimeido, Tokyo, pp. 94-101. (in
Japanese)
Kondoh T., Misawa S. and Toyota M. (1992). Characteristics of Effluent Loads of
Nutrient Salts (N, P) from Paddy Fields Located in the Alluvial and Lower Area in
Hokuriku Dsictrict., Trans. Jpn. Soc. Irrig. Drain. Reclam. Eng., 159: 17-27. (in
Japanese with English abstract)
Kubota H., Tabuchi T., Takamura Y. and Suzuki S. (1979). Water and Material (N. P)
Balance in the Paddy Fields along Lake Kasumigaura., Trans. Jpn. Soc. Irrig. Drain.
Reclam. Eng., 84: 22-28. (in Japanese with English abstract)
Kunimatsu T., Rong L., Sudo M. and Takeda I. (1991). Runoff Loadings of Materials
Causing Water Pollution from a Paddy Field during a Non-planting Period., Trans.
Jpn. Soc. Irrig. Drain. Reclam. Eng., 170: 45-54. (in Japanese with English abstract)
Kunimatsu T., Otomori T., Osaka K. Hamabata E. and Komai Y. (2006). Evaluation of
nutrient loads from a mountain forest including storm runoff loads., Water Science
and Technology., 53(2): 79-81.
Statistics Department, Minister's Secretariat, Ministry of Agriculture, Forestry and
Fisheries. (2008). Total area and cultivated land area, Statistics of Cultivated Land
and Planted Area, Statistics and Information Department, Ministry of Agriculture,
Forestry and Fisheries.
Sugimoto Y., Kunimatsu T. Komai T. (2006). Change of Nutrient Loads of
Paddy-Fields Caused by Crop Rotation from Rice to Wheat., Proceedings of 5th
International Conference on Management of Paddy and Water Environment for
Sustainable Rice Production (II) in Tochigi, Japan on 10-11 Aug 2006, 02-03 in CD.
- 125 -
Journal of Water and Environment Technology, Vol. 6, No.2, 2008
Takamura Y., Tabuchi T., Suzuki S., Harigae Y., Ueno T. and Kubota H. (1976). The
Fates and Balance Sheets of Fertilizer Nitrogen and Phosphorus : Applied to a Rice
Paddy Field in the Kasumigaura Basin., Jpn. J. Soil Sci. Plant Nutr., 47 (9) :
398-405. (in Japanese)
Takamura Y., Tabuchi T., Harigae Y., Otsuki H., Suzuki S. and Kubota H. (1977).
Studies on Balance Sheets and Losses of Nitrogen and Phosphorus in the Actual
Paddy Field in the Shintone River Basin., Jpn. J. Soil Sci. Plant Nutr., 48 (9, 10) :
431-436. (in Japanese)
Takamura Y., Tabuchi T., Harigae Y., Nishimura N., Otsuki H., Kubota H., Suzuki S.
and Osaki K. (1979). Behaviour and Balance of Applied Nitrogen and Phosphorus
under Rice Field Conditions : (III) Balance and Losses of Nitrogen and Phosphorus
in the Well-drained Paddy Field in the Kasumigaura Lake Baisin., Jpn. J. Soil Sci.
Plant Nutr., 50 (3) : 211-216. (in Japanese)
Takeda I., Kunimatsu T., Kobayashi S. and Maruyama T. (1990). Storm Runoff
Loadings from a Paddy Field Area – Studies on pollution loadings from a paddy
field area ( I )., Trans. Jpn. Soc. Irrig. Drain. Reclam. Eng., 147: 79-85. (in Japanese
with English abstract)
Takeda I., Kunimatsu T., Kobayashi S. and Maruyama T. (1991). Pollutants Balance of
a Paddy Field Area and its Loadings in the Water System. – Studies on pollution
loadings from a paddy field area ( II )., Trans. Jpn. Soc. Irrig. Drain. Reclam. Eng.,
153: 63-72. (in Japanese with English abstract)
Udo A., Jiku F., Okubo T. and Nakamura M. (2000). Mass Balances of Water and
Nutrients in a Paddy Field., Jpn. Soc. Water Environ., 23 (5) : 298-304. (in Japanese
with English abstract)
- 126 -