Lecture 3: GIS Data Models
Bạn đang xem bản rút gọn của tài liệu. Xem và tải ngay bản đầy đủ của tài liệu tại đây (6.43 MB, 70 trang )
Lecture 3:
Lecture 3:
GIS Data Models
GIS Data Models
AIM:
AIM:
To introduce various GIS data models
To introduce various GIS data models
After this lecture you should be able to:
After this lecture you should be able to:
Describe the primary Vector data models
Describe the primary Vector data models
used in GIS and give examples
used in GIS and give examples
Describe raster data models and give
Describe raster data models and give
examples
examples
Describe TIN data models
Describe TIN data models
Explain “topology”
Explain “topology”
Describe the main file formats used in GIS
Describe the main file formats used in GIS
Graphic Features
Graphic Features
Objects which are shown on a map are
Objects which are shown on a map are
called graphic features or features.
called graphic features or features.
These features may be natural or man
These features may be natural or man
made objects.
made objects.
Digital representation of physical or man made
Digital representation of physical or man made
elements:
elements:
Graphic Features
Graphic Features
Vectors
Vectors
Points or Nodes
Points or Nodes
Lines or Arcs
Lines or Arcs
Polygons
Polygons
Raster Cells or Pixels
Raster Cells or Pixels
Images
Images
Digital Orthophotography
Digital Orthophotography
Geographic Data Types
Geographic Data Types
Images
Images
Vector
Vector
Raster (GRID)
Raster (GRID)
Attributes
Attributes
TIN (
TIN (
Triangulated Irregular Network
Triangulated Irregular Network
)
)
Annotation
Annotation
© Paul Bolstad, GIS Fundamentals
Geographic Data Types
Geographic Data Types
© Paul Bolstad, GIS Fundamentals
DIGITAL SPATIAL DATA
DIGITAL SPATIAL DATA
•
RASTER
•
VECTOR
•
Real World
Source: Defense Mapping School
National Imagery and Mapping Agency
Electronic Maps in Raster and
Electronic Maps in Raster and
Vector Formats
Vector Formats
Raster Data Sources
Raster Data Sources
Satellite
Imagery
Air Photos
Scanned Maps
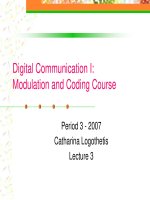
Digital Orthophotograph
Digital Orthophotograph
Image
Copyright 1993 Nassau County, NY
A scanned photograph that
has been mathematically
rectified to eliminate the
effects of displacement so
that its view always appears
as though it is perpendicular
to the ground.
Scanned
Scanned
Document
Document
A set of colored pixels
A set of colored pixels
representing chart
representing chart
information as a picture on
information as a picture on
computer screen
computer screen
Simply an array of pixels
Simply an array of pixels
arranged in rows and
arranged in rows and
columns
columns
Pixels are color coded, but
Pixels are color coded, but
do not represent features
do not represent features
explicitly
explicitly
Rasters can have value
Rasters can have value
attached
attached
Source: Defense Mapping School
National Imagery and Mapping Agency
Raster Maps (images)
Raster Maps (images)
The Appeal of Raster
Looks like a paper map
Looks like a paper map
Cheap and easy to produce (scan
Cheap and easy to produce (scan
existing paper chart)
existing paper chart)
Runs easily on PC
Runs easily on PC
World-wide availability w/updates
World-wide availability w/updates
available
available
Problems:
Problems:
Datum may or may not be WGS84
Datum may or may not be WGS84
Does not allow automated grounding
Does not allow automated grounding
avoidance or any other computer-
avoidance or any other computer-
aided analysis
aided analysis
Storage not as efficient
Storage not as efficient
Source: Defense Mapping School
National Imagery and Mapping Agency
Vector Data
Vector Data
Source: Defense Mapping School
National Imagery and Mapping Agency
An intelligent form of digital
An intelligent form of digital
geographic data where real world
geographic data where real world
objects are represented by points,
objects are represented by points,
lines and polygons. An objects
lines and polygons. An objects
representation is described by
representation is described by
attributes and coordinates.
attributes and coordinates.
Examples include:
Examples include:
Digitized Maps
Digitized Maps
GIS Data
GIS Data
In addition to
In addition to
G
G
eography,
eography,
GIS is also about
GIS is also about
I
I
nformation. A GIS marries
nformation. A GIS marries
the capabilities of computer
the capabilities of computer
mapping with database
mapping with database
management systems. So,
management systems. So,
a geospatial analyst can
a geospatial analyst can
“click” on a geographic
“click” on a geographic
feature and find out
feature and find out
information about it. Or,
information about it. Or,
they can query the database
they can query the database
to find out information about
to find out information about
all the geographic objects
all the geographic objects
that meet a specific criteria.
that meet a specific criteria.
Information about a
Information about a
geographic object is called
geographic object is called
an
an
attribute
attribute
.
.
Linking Attributes and
Linking Attributes and
Graphics
Graphics
Linking Attributes with Graphics
Linking Attributes with Graphics
In this example, the
In this example, the
user has issued a
user has issued a
query to select all
query to select all
the properties
the properties
whose classification
whose classification
is single family
is single family
residential (210),
residential (210),
and colored the
and colored the
selection red.
selection red.
Vector Data is Layered
Vector Data is Layered
Spatial Data Analysis
•
•
•
•
•
•
•
•
•
•
•
2
5
1
4
7
6
Lake
Features:
Line
Points:
Connected
Detached
Area
Text
•
Lake
Geographic data are separated
into themes, tiled for speed of
access and placed on CD-ROM
Network Analysis
30 30’ N
040 40’ E
30 30’ N
040 50’ E
Source: Defense Mapping School
National Imagery and Mapping Agency
Paradigm Shift
Paradigm Shift
May look “different” from a
May look “different” from a
paper map (software-
paper map (software-
dependent)
dependent)
Underlying database allows
Underlying database allows
queries and layer selection
queries and layer selection
Zooming reveals detail
Zooming reveals detail
Complex, expensive, and
Complex, expensive, and
time-consuming to produce
time-consuming to produce
Source: Defense Mapping School
National Imagery and Mapping Agency
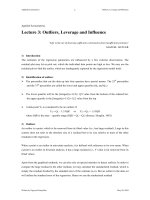
Raster and Vector Data Models
Raster and Vector Data Models
Vector Representation
X-AXIS
500
400
300
200
100
600
500
400
300
200
100
Y-AXIS
River
House
600
Trees
Trees
B
B
B B
B
B
B
B
G
G
BK
B
B
B
G
G
G
G
G
Raster Representation
1 2 3 4 5 6 7 8 9 10
1
2
3
4
5
6
7
8
9
10
Real World
G
G
Source: Defense Mapping School
National Imagery and Mapping Agency
A GIS in which graphic data is stored in the
A GIS in which graphic data is stored in the
form of discrete points, lines, or polygons.
form of discrete points, lines, or polygons.
Vector GIS
Vector GIS
© Paul Bolstad, GIS Fundamentals
Structure of Vector Data
Structure of Vector Data
There is a relationship between vector data types.
There is a relationship between vector data types.
Each data type is often dependent upon one
Each data type is often dependent upon one
another. When representing geographic data in
another. When representing geographic data in
vector format, data is typically stored as:
vector format, data is typically stored as:
Points
Points
: points are zero dimensional objects, and
: points are zero dimensional objects, and
represent geographic features such as wells,
represent geographic features such as wells,
sample locations, or trees.
sample locations, or trees.
Lines
Lines
: lines represent one dimensional objects, or
: lines represent one dimensional objects, or
linear features, such as road and stream
linear features, such as road and stream
centerlines. Lines are made up of a series of
centerlines. Lines are made up of a series of
interconnected points. A line typically starts and
interconnected points. A line typically starts and
end with a special point called a
end with a special point called a
node
node
, and the
, and the
points that make up the rest of a line are called
points that make up the rest of a line are called
vertices
vertices
.
.
Polygons/Area
Polygons/Area
: polygons represent two
: polygons represent two
dimensional objects such as the boundaries of a
dimensional objects such as the boundaries of a
field, or property, or the outline of a building or lake.
field, or property, or the outline of a building or lake.
Polygons are made up of a series of connected
Polygons are made up of a series of connected
lines where the starting point of a polygon is the
lines where the starting point of a polygon is the
same as the ending point.
same as the ending point.
Point
Line
Polygon
Points are zero dimensional objects
which have locations and attribute
information but are too small to be
represented as areas.
Points
Points
Points
Points
Soil Samples
Soil Samples
Type
Type
PH
PH
Contaminants
Contaminants
Utility Poles
Utility Poles
Owner
Owner
Height
Height
Attachments
Attachments
Spill Locations
Spill Locations
Accident Number
Accident Number
Type of Spill
Type of Spill
Extent
Extent
Parcel Centroids
Parcel Centroids
Section/Block/Lot No.
Section/Block/Lot No.
Address
Address
Owner
Owner
Assessment Data
Assessment Data