Nghiên cứu nồng độ beta2 microglobulin máu ở bệnh nhân suy thận mạn tính lọc máu chu kỳ (tt e)
Bạn đang xem bản rút gọn của tài liệu. Xem và tải ngay bản đầy đủ của tài liệu tại đây (339.63 KB, 25 trang )
1
FOREWORDS
1. The necessity of the topic
Chronic renal failure is a clinical and biochemical syndrome
progresses to chronic over several years, it is a result of fibrosis of
nephrons causing gradually decreasing glomerular filtration rate
(GFR) leading to increasing blood non-protein nitrogen likes urea,
creatinine. When the GFR < 10 mL/min, patients require kidney
replacement by dialysis or kidney transplant.
The patients with chronic renal failure make up a very large
proportion of the population, due to various causes, such as treament
difficult or expensive. Currently, there are 3 treatment methods for
end-stage renal failure:hemodialysis, peritoneal dialysis, kidney
transplant.According to statistics in 2012, there were 3,010,000 people
worldwide had been treated by kindney replacement method, increased
7% each year. Among these patients, there were about 2,358,000
people were treated by hemodialysis and peritoneal dialysis. 652,000
people were transplanted kidneys. In maintence hemodialysis patients,
when their life are prolonged, there is an increasing rate of
cardiovascular, neurological and musculoskeletal complications
leading to reduce life quality ; there are many causes of these
complications, the top cause is the dialysis method can not efficiently
filtrate some substances in serum, in particularly, substances with high
and average molecular weights. A representative is beta2-
microglobulin (β2M). When dialysis method does not have enough
effects, β2Mdeposites into some organs like skeletal system causing
pain, movement limitation, bone fractures ; into cardiovascular system
and digestive system causing other complications and leading to
increase the rate of hospitalized patients or deaths.
In Vietnam, there are some studies on blood β2M concentrations
in patients with renal failure on dialysis or not to assess the efficacy of
2
β2M filtration after the session, but there is not any study on the
relation between some factors can cause increaseβ2M concentration
and treatment methods. Therefore, we conducted this topic with 2
following objectives:
1. To investigate the serumbeta2-microglobulin concentration and its
relation to some indices in patients with chronic renal failure on
hemodialysis using low flux dialyzer.
2. To compare the results of beta2-microglobulin filtration using
3 methods: using membrane with low ultrafiltration coefficient alone,
using membrane with low ultrafiltration coefficient in combination
with membrane with high ultrafiltration coefficient and using
membrane with low ultrafiltration in combination with
hemodiafiltration online(HDF online).
2. New contributions of the topic
This is the first study in our country assessing the variation in
β2M concentrations and the relation between β2M concentration and
some features in patients with chronic renal failure on hemodialysis. In
addition, the study also assessed results of β2M filtration in some
blood dialysis method in order to offer the optimal treatment method
that reduces β2M concentration to void future complications caused by
β2M, and to enhance life quality of patients on hemodialysis.
3. Structure of the thesis:The thesis includes123pages. Forewords: 2
pages, overview: 33 pages, Subjects and methods of study: 23 pages,
Study results: 28 pages, Dicussion: 34 pages, Conclusions and
Recommendations : 3 pages. The thesis contains 51 tables, 10 charts, 1
diagram, 3 figure. The thesis reffered 145 references including 32
Vietnamese and 113 English references.
3
CHAPTER 1: OVERVIEW
1.1. Summary on chronic renal failure
Chronic renal failure is the final result of chronic renal - urinary
diseases causing decreasing ability of the kidney corresponding to the
nephrons of the kidney that have been damaged and irreversibly lost
function.
There are many causes of chronic renal failure, the most common
causes are glomerular diseases, renal tubulo-interstitial diseases, renal
vascular disease, congenital and genetic diseases…
1.2. Clinical expressions and laboratory data of chronic renal
failure
Kidney is the organ holding several essential roles like endocrine,
exocrines and regulatory roles then when the kidney is damaged, many
other organs in our body will be affected.
Renal failure is divided into 5 stages, because the disease progress
slowly then it is often diagnosed at later stages leading to difficult in
treatment.
To diagnose renal failure ta the realy stage, the most important
thing is based on its sub-clinical expressions… In treatment of renal
failure, beside cause treatment, the main treatment approach is
reservation treatment because damaged nephrons are unable to revocer
when they are damaged and become fibrosis.
1.3. Method for treatment of the end-stage renal failure patients
When the GFR< 10mL/min, the patient must be treated by kidney
replacement. Currently, there are 3 primary treatment methods as
follows:
- Kidney transplantation: accounted about 15%. This is the
optimal alternative treatment method but the source of kidneys is rare.
4
- Peritoneal dialysis : accounted about 16%, done at home, the
patient does not depend on the hospital and medical professionals but
it remains many complications and less effective than artificial kidney.
- Blood filtration outside the body(maintenance hemodialysis)
accounted 69%. This method is widely used because it is easy to implement
but the disadvantage is the patient depends on devices and hospital.
1.4. Replace the damaged kidney with maintenance
hemodialysis
Artificial kidney or maintenance hemodialysis can be done at home, at
the dialysis center or hospital. In Vietnam, currently hemodialysis is
done at hospital.
Hemodialysis includes following methods:
+ Intermittent hemodialysis : 3 times per week, 4 hours per time
(IHD) or hemodialysis at home with frequency of 6-7 times per week,
about 2 hour each time. In this method, many types of dialyzers can be
used - low ultrafiltration coefficient (Low flux) average ultrafiltration
coefficient (Midium flux) high ultrafiltration coefficient (High - flux).
+ Hemofiltration (HF): convective mechanism.
+ Hemodiafiltration(HDF): mechanism combining convection and
diffusion, HDF includes HDF online and HDF off -line.
Fluid compensation can be done before membrane, at middle of
membrane, after membrane or before and after membrane.
HDF method has more advantages since it applies both convecton
and diffusion mechanisms at the same time.
1.5. Beta2-microglobulin in chronic renal failure and
hemodialysispatients
β2M is a component ofmajor histocompatibility complex
molecules, which presents on all nucleated cells, and belongs to the
group of average molecular weight substances (11800 dalton).
5
β2M presents in blood with a concentration < 2mg/dl, and is
filtrated through glomerular.
Serumβ2M concentration increases depending on the reduction of
GFR. In patient on hemodialysis, the serumβ2M concentration can
increase> 30 folds as compared to healthy people. β2M increasing
leading to its deposition in some organs of the body causing Amylose
complication, in particularly in patient with more than 5 years
experiencing hemodialysis leading reduced life quality of the patient.
1.6. Studies on β2M in patients with renal failure
Abroad: there have been many studies on β2M in patients with renal
failure, patients on hemodialysis on pathophysiological mechanisms,
treatment methods and prevention methods.
In Vietnam: there have been some studies on variations of β2M
concentration in patients with renal failure on hemodialysis, but there is
not any study on the relation between β2M and disorders in patients at
end-stage chronic renal failure on hemodialysis and treatment methods
and prevention methods.
CHAPTER 2: SUBJECTS AND METHODS OF THE STUDY
2.1. Subjects of the study
374 subjects were divided into 2 groups:
+ Patient group: 326 patients on hemodialysis, control group: 48
healthy people with average age and sex ratio equal to patient group.
The topic was conducted at the Department of Hemodialysis,
Bach Mai Hospital from February 2008 to February 2011.
- Inclusion criteria:
+ Control group: Healthy adults, no history of renal-urinary
diseases, equal age and sex to the patient group, agreed to participate
in the study.
+ Patient group:End-stage chronic renal failure, during of
hemodialysis≥ 3 months, age ≥ 18,usinglow flux dialyzer, agreed to
participate in the study.
6
-Exclusion criteria:
Control group: Suffering from some chronic diseases such as
rheumatoid arthritis, chronic gastro-duodenum diseases…obesity,
drinking alcohol, pregnant women, nursing mothers.
Patient group: Patients with heart failure symptoms: frequent
dyspnea, chest pain, enlarged heart on X-ray image… Patients with
hepatic diseases: ascites, cirrhosis on image obtained from ultrasound
technique, collateral circulation. Patients with end-stage cancers, acute
diseases such as: infection, myocardial infarction, acute heart failure,
stroke… Patients with difficults in creating a way reaching the blood
vessel affecting the quality of hemodialysis. Patients suspected to have
external diseases or had been intervened by surgery within 1 moth.
Patients did not collaborate.
Inclusion criteria of intervention patients (using dialyzers : Low
flux, Low flux + High-flux, Low flux + HDF online).
Among 326 patients, selected 32 patients agreed to have
hemodialysisLow flux + HDF online (after the patients were explained
about advantages, disadvantages, and mandatory procedures that they
must comply).
294 patients were divided into small groups and randomly
selected 1 group with age, sex, during of hemodialysis, cause of renal
failure, β2 concentration equal to the HDF online group,in this group
46 patients were selected with Low flux + High flux.
Low flux group: among remaining patients, similarly to group 2,
64 patients were selected.
2.2. Methods of the study
- This is a cross-sectional descriptive study with control group in
combination with a follow up-intervention study.
- Patients were selected with clinically convenient sample size, the
intervention group was divided into 3 goups, selected the HDF online
intervention group, other groups were randomly selected and also took
7
into account equivalent factors.
2.2.1. Clinical examination and laboratory tests
- Each subject in both patient group and control group had a
record according to the study form.
- Subjects in both groups were obtained blood samples to test full
blood counts (FBC) and biochemical indices.
- Control group : fasting blood testing, quantified serum β2M.
- Patient group:
+ Cross-sectional study : obtained blood samples before blood
filtration session, at the first session in week: FBC, β2M, urea,
creatinine, albumin, CRP, uric, phosphorous, cholesterol, triglyceride,
HDL-C, LDL-C, HbAg, Anti-HCV.
+ Intervention study : tested before and after blood filtration (1st
dialyzer), before filtration : blood sampled by needlem after filtration :
blood sampled by slow flow method(FBCobtained before filtration,
biochemical testes before and after filtration: urea, creatinine, β2M,
Albumin, electrolytes, CRP.
2.2.2. Intervention regime
Group 1 (PN1: 64 patients): using lowflux dialyzer only.
Group 2 (PN2: 46 patients): using low flux dialyzer and 2 times
per months with high flux dialyzer.
Group 3 (PN3: 32 patients: usinglow flux dialyzer and 2 times per
month with HDF online.
The first time intervention is called the first time using dialyzer, in
which, group 1 used low flux dialyzer, group 2 used high flux dialyzer
and group 3 used HDF online.
2.2.3. Result assessment
- Cross-sectional study:
+ Assessed the variation of serumβ2M concentration in patients with
chronic renal failure on hemodialysis as compared to control group.
8
+ Assessed the relation between serum β2M concentration in
patients with chronic renal failure on hemodialysis and factors: age,
sex, dialysis time, BMI, serum CRP, serum phosphorous, serum urea,
serum creatinine, serum lipids…
- Intervention study:
+ Assessed the filtration results ofserum urea, creatinine, β2M in
methods using first-time-use dialyzer.
+ Assessed the reduction of serum β2M after 6 moths treatment with
each method.
2.2.4. Ethics
- Do not violate ethics in study.
- Tests and treament methods are done for the benefit of patients.
-Tests performed according to instructions in the recommendations.
- Respect opinions of the study subjects, subjects have right to refuse.
- Data is collected accurately, honesty and confidentially.
2.2.5. Data processing
Data was processed by biostatistics method using softwares Epi-
Info 3.5.1 and Epical 2000.
Mean values, standard deviation, percentage, compared 2 mean
values and percentages by t-test, compared many percentages by test
χ
2
, compared many mean values by Anova, calculated correlation
coefficient r.
CHAPTER 3: RESULTS OF THE STUDY
3.1. General characteristics of subjects of the study
Table 3.1: Comparison of age, sex between 2 groups
Group
Female Male Overall
n % n % n %
Control
n. % 21 43.8 27 56.2 48 100
Mean age
(Years)
34.7 ± 9.9 39.8 ± 9.0 37.56 ± 9.65
9
Patient
n. % 140 42.9 186 57.1 326 100
Mean age
(Years)
49.9 ± 13.4 42.3 ± 14.4 45.6 ± 14.5
p > 0.05
The difference between mean ages of control group to patient
group was not statistically significant, p> 0.05.
The ratios of male/female between 2 groups were equal.
Mean ages between two sex groups in both 2 groups were equal.
Table 3.2: Distribution of patients according to age, sex (n=326)
Age group
(year)
Female Male Overall
n % n % n %
≤ 30 14 10.0 47 25.3 61 18.7
31-40 23 16.4 45 24.2 68 20.9
41-50 27 19.3 39 21.0 66 20.2
51-60 44 31.4 35 18.8 79 24.2
>60 32 22.9 20 10.8 52 16.0
Plus 140 42.9 186 57.1 326 100.0
Distribution of patients was relatively even between age groups,
however, the group of patients ≤ 30 years old and> 60 years old had
smallest percent.
This study mainly included patients aged from 31 to 60 years
old (65.3%).
The ratio of male/female in each age groups were equal.
Table 3.3: Causes of chronic renal failure
Cause Number (n) Percent (%)
Chronic glomerulonephritis 230 70.6
Chronic Pyelonephritis 43 13.2
Diabetes 32 9.8
Others 21 6.4
Plus 326 100%
10
The percentages of patients according to causes in the stidy were
different.
Chronic renal failure caused by chronic glomerulonephritis
accounted the highest percentage (70.6%).
Table 3.4: Distribution of patients according to the hemodialysis
time (n=326)
Hemodialysis time (years) Number (n) Percent (%)
<1 14 4.3
1- <5 183 56.1
5- <10 107 32.8
≥10 22 6.7
Mean (
X
± SD) 4.71 ± 3.14 (years)
The group of patients with hemodialysis time above 1 year and
below 5 years accounted the highest percentage.
The group of patients with hemodialysis time below 1 years
accounted the smallest percentage.
Table 3.7: BMI characteristics of patients (n=326)
Degree Number (n) Percent (%)
Lacking weight 137 42.02
Normal 167 51.28
Overweight and obesity 22 6.7
Mean (
X
± SD) 19.2 ± 2.4 (13.3 – 29.0)
The percentage of patients with normal BMI accounted the
highest percentages, following by patients lacking of weight (thin).
Table 3.10: Percentage of patients with HBV, HCV (n=326)
Status Number (n) Percent (%)
Not infected 186 57.1
HBV (+) 28 8.6
HCV (+) 98 30.1
HBV and HCV (+) 14 4.2
The percentages of patients infected by hepatitis viruses were
relatively high in this study. There were 30.1% patients had HCV (+),
11
8.6% patients had HBV (+) and 4.2% patients had both HBV and
HCV (+).
3.2. Variation of serum beta2-microglobulin concentration in
patients of the study
Table 3.11: Variation of serum beta2 - microglobulin
concentration on patient group and control group
β2M (mg/l)
Subject
Min – Max
X
± SD
p
Patient (n=326) 16.9 - 129.2 64.7 ± 21.1
< 0.001
Control (n=48) 0.9 - 3.6 1.88 ± 0.68
The patient group had mean blood β2M concentration higher than control
group, the different was statistically significant with p < 0.001.
Table 3.14: Serum β2M concentration according to sex in patient
group (n=326)
Subject β2M (mg/L) p
Male (n=186) 64.0 ± 21.3
> 0.05
Female (n=140) 65.7 ± 21.0
Mean blood β2M concentrations in male and female subjects were
different but not statistically significant, p > 0.05.
Table 3.15:The relation betweenserum β2M concentration and age
(n=326)
β2M (mg/L)
Age (years old)
Min – Max
X
± SD
≤ 30 (n=61) 23.7-101.7 66.1 ± 20.1
31-40 (n=68) 21.4-109.3 64.5 ± 21.9
41-50 (n=66) 25.3-120.4 63.5 ± 21.6
51-60 (n=79) 16.9-129.2 68.4 ± 21.5
>60 (n=52) 20.8-96.8 59.6 ± 19.7
p ANOVA > 0.05
12
Mean values of β2M concentrations between age groups were not
significantly different, this proved that the β2M concentration does not
relate to age of the patient.
Table 3.16: Variation ofserum β2M concentration follwing
hemodialysis time (n=326)
β2M (mg/L)
Hemodialysis
time (years)
Min – Max
X
± SD
<1 (n=14) 23.7 – 70.4 38.2 ± 12.0
1- < 5 (n=183) 16.9-98.7 56.4 ± 18.8
5- <10 (n=107) 43.7-99.9 76.9 ± 12.0
≥10 (n=22) 52.2-129.2 92.4 ± 20.3
p ANOVA < 0.001
Mean β2M concentrations were different between groups of
patients with different hemodialysis times and increased when the
hemodialysis time increased.
Patients with hemodialysis time< 1 yearhad lowest mean β2M
concentration, patients with hemodialysis time above 10 years had highest
mean β2M concentration, the difference was statistically significant with
p < 0.001.
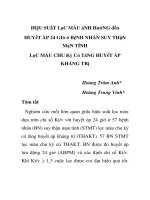
Chart 3.4: Correlation between serum β2M concentration and
hemodialysis time
Hemodialysis time (months)
Serum β2M concentration (mg/L)
13
β2M concentration positively significantly correlated with
hemodialysis time. The longer the hemodialysis time ism the higher
β2M concentration deposited.
Correlation coefficient between β2M concentration and
hemodialysis was r=0.64, p < 0.001.
Table 3.18: The relation between serum β2M concentration
and causes of chronic renal failure in patient group
β2M (mg/L)
Cause
Min – Max (
X
± SD)
Chronic glomerulonephritis
(n=230)
16.9-129.2 64.3 ± 21.5
Chronicpyelonephritis(n=43) 31.4-105.9 62.9 ± 19.1
Diabetes (n=32) 30.8-93.8 66.5 ± 19.4
Others (n=21) 40.2-77.6 66.8 ± 17.8
p ANOVA > 0.05
β2M concentration didn’t relate to causes of chronic renal
failure p > 0.05.
Table 3.19: The relation between serum β2M concentration and
condition of having hepatitis virus in patient group
β2M (mg/L)
Hepatitis virus infection
Min – Max (
X
± SD)
No (n=186) 16.9-93.4 57.2 ± 18.5
Yes (n=140) 29.7-129.2 74.7 ± 20.4
P < 0.001
β2M relates to hepatitis virus infection, mean β2M concentration
of patients with hepatitis virus was significantly higher than patients
without hepatitis virus, p< 0.001.
Table 3.20: Relation betweenserum β2M concentration and
conditions of HBV, HCV infections in patient group
β2M (mg/L)
Hepatitis virus
Min – Max (
X
± SD)
HBV (+). (n=28) 30.3-129.2 62.8 ± 23.5
HCV (+). (n=98) 29.7-120.4 77.6 ± 17.9
HBV + HCV (n=14) 39.4-117.6 78.9 ± 22.9
14
p ANOVA < 0.01
When comparing thethreegroups, β2Mlevelsrelatedstrainsof
hepatitisvirusinfection, the differencewas statistically
significant(p<0.01), whichis the highest
inHBV+HCVcoinfectionandthe lowestinthe grouponly infected with
HBV.
Table 3.21: The relation betweenserum β2M concentration and
urine stagnation(n=326)
β2M (mg/l)
Degree
Min – Max (
X
± SD)
No stagnation (n=263) 21.4-129.2 68.2 ± 19.8
Stagnation (n=63) 16.9-109.3 50.5 ± 20.6
P < 0.001
β2M relates to urine stagnation, patients with urine stagnation
had significantly lower β2M concentration as compared to patients
without urine stagnation, p< 0.001.
Table 3.23: Relation betweenserum β2M concentration and
anemia in patient group (n=326)
Anemic degree Number (n)
β2M (mg/L).
(
X
± SD)
Non 55 65.02 ± 19.77
Mild 171 65.17 ± 21.32
Average 82 63.38 ± 20.64
Serious 18 66.09 ± 26.79
Overall 326 64.7 ± 21.1
p ANOVA > 0.05
β2M does not relate to the condition of having or not having
anemia, and the degree of anemia, p > 0.05.
Table 3.24: Relation between serum β2M
concentration and dyslipidemia of each lipid
component in blood of patient group(n=326)
Symptom
β2M (mg/L)
(
X
± SD)
p
Hypercholesterolemia
No (n=235) 62.6 ± 19.7
<0.01
Yes (n=91) 70.2 ± 19.9
Hypertriglyceridemia
No (n=232) 62.7 ± 21.0 <0.01
15
Yes (n= 94) 69.8 ± 20.7
Reduced HDL-C
No (n=203) 60.5 ± 19.1
<0.001
Yes (n=123) 71.7 ± 22.7
Increased LDL-C
No (n=256) 63.2 ± 21.2
<0.01
Yes (n=70) 70.6 ± 19.9
β2M relates to dyslipidemiam patients with dyslipidemia had
β2M concentration significantly higher than patients without
dyslipidemia, p < 0.05.
Table 3.25: The relation between serum β2M concentration and
BMI of patient group (n=326)
BMI Number (n)
β2M (mg/L).
(
X
± SD)
Lacking of weight 137 63.83 ± 21.21
Normal 167 65.19 ± 20.43
Overweight, obesity 22 67.17 ± 26.27
p ANOVA > 0.05
β2M concentration tended to increase in overweight/obesity patients,
however β2M does not relate to thin or overweight/obesity, p> 0.05.
3.3. β2M filtration effect in patients used different filtration
methods and dialyzer with different ultrafiltration coefficients
Table 3.27: Characteristics of the sample before intervention
Characteristic PN1 PN2 PN3 p ANOVA
Hemodialysis time
(months)
80.6 ± 42.6 64.6 ± 44.0 78.8 ± 41.0 > 0.05
White blood cells
(g/L)
7.2 ± 1.3 7.3 ± 1.2 7.3 ± 1.4 > 0.05
Hemoglobin (g/L) 101.2 ± 16.9 99.2 ± 17.3 99.5 ± 15.1 > 0.05
Albumin (g/L) 38.2 ± 3.5 38.4 ± 5.0 39.7 ± 3.3 > 0.05
CRP (mg/dL) 0.61 ± 0.48 0.47 ± 0.37 0.68 ± 0.49 > 0.05
Urea (mmol/L) 29.2 ± 6.5 29.0 ± 7.1 29.2 ± 7.2 > 0.05
Creatinine (µmol/L) 830.7 ± 204.6 828.8 ± 217.1 831.7 ± 200.7 > 0.05
β2M (mg/l) 66.04 ± 26.7 64.8 ± 18.8 69.2 ± 18.9 > 0.05
16
K+ (mmol/l) 4.91 ± 0.55 4.86 ± 0.58 4.93 ± 0.56 > 0.05
Na+ (mmol/l) 135.4 ± 2.1 135.6 ± 2.2 135.6 ± 2.2 > 0.05
Ca++ (mmol/l) 1.90 ± 0.31 1.84 ± 0.29 1.86 ± 0.29 > 0.05
There weren’t statistically significant difference in indices of 3
groups used different methods and dialyzers, p > 0.05.
Table 3.30: Comparison of serum urea concentration in groups
after the 1
st
time use of dialyzer
Group
Urea
(mmol/L)
PN1
(n=64)
PN2
(n=46)
PN3
(n=32)
p ANOVA
Before
filtration
29.2 ± 6.5 29.0 ± 7.1 29.2 ± 7.2 > 0.05
After filtration
9.9 ± 2.6 8.9 ± 2.2 6.0 ± 1.3
1-3.2-3:
< 0.001
1-2: > 0.05
P < 0.001 < 0.001 < 0.001
After filtration, the urea concentration significantly decreased in
all groups, p< 0.001. Group 3 had highest urea-decreasing degree,
significantly different to groups 1 and 2, p < 0.001.
Table 3.31: Comparison of serum creatinine concentration in
groups after the 1
st
time use of dialyzer
Group
Creatinine
(µmol/L)
PN1
(n=64)
PN2
(n=46)
PN3
(n=32)
p
ANOVA
Before filtration 830.7 ± 204.6 828.8 ± 217.1 831.7 ± 200.7 > 0.05
After filtration
294.9 ± 105.0 272.5 ± 109.6 161.2 ± 65.6
1-3.2-3:
< 0.001
1-2: > 0.05
p < 0.001 < 0.001 < 0.001
17
After filtration, the creatinine concentration significantly
decreased in all groups, p< 0.001. Group 3 had highest creatinine-
decreasing degree, significantly different to groups 1 and 2, p < 0.001.
Table 3.35: Variation on while blood cells, Hemoglobin, albumin,
CRP and BMI after 6 months treatment
Index
PN1
(n=64)
PN2
(n=46)
PN3
(n=32)
pANOVA
White blood
cells (g/L)
Before treatmen 7.2 ± 1.3 7.3 ± 1.2 7.3 ± 1.4 > 0.05
After 6 months 7.1 ± 1.2 7.0 ± 1.1 7.1 ± 1.4 > 0.05
p > 0.05 > 0.05 > 0.05
Hemoglobi
n
(g/L)
Before treatmen 101.2 ± 16.9 99.2 ± 17.3 99.5 ± 15.1 > 0.05
After 6 months 104.2 ± 16.3 109.6±16.2 120.7 ± 14.3
1-3.2-3:
< 0.05
1-2: >0.05
p > 0.05 < 0.05 < 0.05
Albumin
(g/L)
Before treatmen 38.2 ± 3.5 38.4 ± 5.0 39.7 ± 3.3 > 0.05
After 6 months 38.5 ± 3.4 39.6 ± 4.6 39.0 ± 2.8 > 0.05
p > 0.05 > 0.05 > 0.05
CRP
(mg/dL)
Before treatmen 0.61 ± 0.48 0.47 ± 0.37 0.68 ± 0.49 > 0.05
After 6 months 0.59 ± 0.44 0.52 ± 0.34 0.55 ± 0.33 > 0.05
p > 0.05 > 0.05 > 0.05
BMI
Before treatmen 18.9 ± 2.6 19.6 ± 2.0 19.6 ± 2.4 > 0.05
After 6 months 19.2 ± 2.4 19.5 ± 2.1 21.1 ± 2.0
1-3.2-3:
< 0.05
1-2: > 0.05
p > 0.05 > 0.05 < 0.05
Hemoglobin concentration and BMI in group treated by
hemodiafiltrationwas higher than other groups after 6 moths treatment
and higher than such index before 6 months (p<0.05). There were not
significantly different on number of while blood cells, albumin
18
concentration and CRP concentration before and after 6 months
treatment between groups (p > 0.05).
Table 3.3. Comparison onserum β2M concentration effect in
groups after the 1
st
time use of dialyzer
β2M
(mg/L)
PN1
(n=64)
PN2
(n=46)
PN3
(n=32)
p
ANOVA
Before
filtration
66.04 ± 26.7 64.8 ± 18.8 69.2 ± 18.9 > 0.05
After
filtration
66.3 ± 26.2 47.8 ± 13.5
21.8± 9.8
< 0.001
p > 0.05 < 0.001 < 0.001
β2M before and after filtration session: Group 1 increased slowly, group 2
and 3 significantly decreased with p < 0.001, in particularly, group 3.
Table 3.41: Variation ofserum β2M concentration in 6 months
treatment
Time point
PN1
(n=64)
PN2
(n=46)
PN3
(n=32)
p ANOVA
Before filtration (T0) 66.04 ± 26.7 64.8 ± 18.8 69.2 ± 18.9 > 0.05
After 1 month 65.9 ± 26.4 57.8 ± 16.5 46.1 ± 11.8 < 0.05
After 2 months 66.5 ± 26.7 56.3 ± 16.3 44.4 ± 11.9 < 0.05
After 3 months (T3) 66.9 ± 26.6 54.9 ± 16.2 42.7 ± 12.2 < 0.05
After 4 months 67.6 ± 26.5 52.0 ± 15.6 40.8 ± 13.1 < 0.05
After 5 months 68.5 ± 27.0 48.7 ± 14.2 34.5 ± 11.8 < 0.01
After 6 months (T6) 68.5 ± 24.9 46.7 ± 12.8 32.4 ± 9.1 < 0.01
p > 0.05
T6 &T3.
T6&T0:
< 0.001
T6&T3.
T6&T0:
< 0.001
In patients used dialyzer with low ultrafiltration coefficient, the
β2Mconcentration gradully increased.
In patients used dialyzer with low ultrafiltration coefficient
combined with dialyzer with high ultrafiltration coefficient,
19
theβ2Mconcentration decreased, after 6 monthes the reduction was
significant p<0.001.
In patients used hemodiafiltration, β2Mquickly decreased, until
the 6th month the concentration was 32.4 mg/L, p< 0.001.
Among groups, there were significant reductions in each month
aboutβ2M,p< 0.05.
CHAPTER: DISCUSSION
4.1. Characteristics of the subjects of study
4.1.1. Age-sex
Average age of the study was 45.6 ± 14.5 in which average age of
males was 49.9 ± 13.4, female was 42.3 ± 14.5 (table 3.1). The rate of
male with chronic renal failure was higher than in female. These
results are consistent with results from local studies. However, the
average age of all patients on hemodialysis is much lower compared to
studies in developed countries. This is due to difference in disease
distribution, organization, preservation treatment in these countries are
better so that the time before hemodialysis of patients with renal
failure is prolonged.
4.1.2. Causes of chronic renal failure
We divided causes into 4 major groups, which arechronic
glomerulonephritis, chronicpyelonephritis,diabetes, and other causes.
In which, chronic renal failure caused by chronic glomerulonephritis
accounted the highest percentage (table 3.3) consistent to other local
studies. In developed countries, diabetes cause accounted a high
percentage.
4.1.3. Hemodialysis time
In this study, maintenance hemodialysis patients< 1 year
accounted the lowest percentage followed by ≥ 10 years. And most
them are from 5 - 10 years (table 3.4). In other studies worldwide,
maintenace hemodialysis patients 5 - 10 years also accounted a high
number.
4.1.4. BMI
20
In our study, thin, obese patients accounted high percentage wiht
most of patients were thin, Number of obese patients accounted a low
percentage (6.7%). In other studies in EU, obese patients accounted
the majority, causes of chronic renal failure in theses= countries
related to metabolic disordes, such as diabetes, goutte…
4.1.5. Hepatitis virus infection:the percentage of patients with
hepatitis on hemodialysis highly increased, because the infected with
HBV, HCV via blood rout,. In some developed countries, percentage
of hepatitis lower. This proposes that we should care about prevention
of hepatitis (vaccine, aseptic…).
4.2. Variation of serum beta2-microglobulin concentration and its
relation with some indices in chronic renal failure patients with
maintenance hemodialysis
4.2.1. Variation of β2M
β2M concentration absolutely increased in patient group, the
difference was statistically significant as compared to control group p
< 0.001. The result is consistent with other studies local and abroad.
(Table 3.11).
4.2.2. Relation to sex
Table 3.14: in patients on hemodialysis of our study, both male
and female had increased β2M. But the difference was not significant
with p > 0.05.
4.2.3. Relation to age:In different age groups, β2M concentrations
differed, elder group (61 - 60) had highest β2M concentration but no
sifnificant difference to other age groups, p > 0.05. This result was
consistent because renal failure can not filter β2M and not related to
age.
4.2.4. Relation to hemodialysis time
In this study, β2M concentration related tightly to hemodialysis
time. The longer hemodialysis time, the higher β2M concentration, the
difference between groups was significant with p < 0.001 (Table 3.16).
This is due to β2M produced every day, low ultrafiltration can not
clear β2M leading to deposition of β2M.
21
4.2.5. Relation to causes of chronic renal failure
There are 4 groups of causes of chronic renal failure,
β2Mconcentration in diabetic group is highest but not significantly
differebt to other groups. There is no report on this matter but based on
the pathogenic mechanism, this result is consistent (table 3.18).
4.2.6. Relation to hepatitis virus infection
β2M concentrations are significantly different between patients
with hepatitis, without hepatitis, with HBV, HCV or both HBV and
HCV. Therefore, diagnosis of hepatitis in patients on hemodialysis is a
need-to-care issue.
4.2.7. Relation to residual renal function
In patients remain residual renal function, β2M concentration is
lower than anuria group ; this results is consistent with other studies
worldwide, retaining residual renal function is an important issue in
patients with hemodialysis.
4.2.8. Relation to degree of anemia and BMI
In our study, anemia is common but we didn’t find the relation
between anemia and β2M concentration. We realized that
overweighted patients also had highest β2M concentration but there
were no difference between thin, normal, obese groups with p > 0.05.
4.2.11. Relation to dyslipidemia
In our study, like other authors worldwide, we found that there is
a relation between dyslipidemia and β2M with p < 0.001 following the
increasing degree of triglyceride, cholesterol, LDL-C and reduction
degree of HDL-C.
4.3. β2M filtration effect in patients used methods and dialyzers
with different ultrafiltration coefficients
4.3.1. General characteristics and filtration effects of groups
General characteristics: All 3 groups were similar in filtration
time, age, β2M concentration and other indices.
Urea, creatinine filtration effect on the first time use dialyzer :
good in all 3 goups. the difference between before and after filtration
was statistically significant with p < 0.001. But the effect was highest
22
in HDF online group.
Effect on regulation of some electrolytes.Electrokytes (Na
+
, K
+
,
Cl
-
) before and after filtration in all 3 groups were equivalent, effect on
electrolyte balancing in 3 groups were equal.
Variation of some indices after 6 months treatment: In 3 groups
after 6 months treatment, HDF online group improved anemia,
hypertension. Other indices like: albumin, CRP, white blood cells
were not different in 3 groups.
4.3.2. β2M filtration effect in groups
Filtration effect in the first time use : results of the study (table
3.38) show that in group 1, the β2M concentration slightly increased
after filtration, so this group was not efftectively filtered β2M ; in
group 2, the β2M concentrations before and after filtration were
significantly different with p < 0.01. The filtration effect was very high
in group 3. Thus, HDF online is the most effective method for
filtration of β2M as compared to 2 other groups.
Variation of β2M concentration after 6 months treatment.
After 6 months treatment, in the group used dialyzer with low
ultrafilatrion coefficient, the β2M concentration tended to increase. In
group used Low flux dialyzer comnined with High flux dialyzer, from
the 3rd month, the reduction on β2M concentration was significant
with p < 0.001. This reduction could be seen clearly in HDF online
group. Thus, if prevention treatment of increased blood β2M
concentration, patients with chronic renal failure on hemodialysis
should be applied this method to obtain the highest treatment effect.
CONCLUSIONS
Study on serumβ2 microglobulin concentrationin 326 patients on
hemodialysis using dialyzer with low ultrafiltration coefficient,
comparing to 48 healthy people in control group and assessing the
Beta2 microglobulin filtration effect in patients using methods and
23
dialyzers with different ultrafiltration coefficients. We have the
following conclusions:
1. Variation ofserum β2M concentration:
Increased serumβ2M is common in patients with chronic renal
failure on hemodialysis:
+ Mean value ofβ2M concentrations of patient group was higher
than control group (64.7 ± 21.1 mg/L vs 1.88 ± 0.68 mg/L). 100%
patients increasedβ2M.
+ β2M concentration positively correlated tightly with
hemodialysis time, CRP concentration, and correlated middely with
blood phosphorous and urea concentrations.
+ β2M concentration related to infection of HBV, HCV and this
concentration was higher in infected patients than non-infected
patients (74.7 ± 20.4 mg/L vs 57.2 ± 18.5 mg/L), in patients infected
both types of viruses the concentration was higher than patients
infected with one type of virus, higher in patients with HCV as
compared to patients with HBV.
+ β2M concentration in patients without urine stagnationwas higher
than in patients with urine stagnation (68.2 ± 19.8 mg/L vs 50.5 ± 20.6
mg/L).
+ β2M concentration related significantly to albumin level. In
patients with decreased albumin levels, β2M concentration higher than
in patients with normal albumin levels (69.32 ± 19.87 mg/L vs 60.89 ±
22.99 mg/L).
+ β2M related significantly to dyslipidemia. Mean value ofβ2M
concentrations increased in patients with increased cholesterol,
triglyceride, LDL-C or decreased HDL-C.
2. β2M filtration effect when using methods and dialyzers with
different ultrafiltration coefficients.
+ After the first time use, only mean serumβ2M concentrations in
patients used hemodiafiltration online and patients used dialyzer with
low ultrafiltration coefficient in combination with dialyzer with high
ultrafiltration coefficient significantly decreased as compared to before
24
filtration (69.2 ± 18.9 mg/L vs 21.8 ± 9.8 mg/L and 64.8 ± 18.8 mg/L
vs 47.8 ± 13.5 mg/L), p< 0.001. Average bloodβ2M concentration
after filter by Hemodiafiltration online was lower than the group used
dialyzer with low ultrafiltration coefficient in combination with
dialyzer with high ultrafiltration coefficient, p< 0.001.
+ Among 3 groups, clearance index of bloodβ2M after the first
time filtration in group combined with hemodiafiltration online was
highest, significantly different to group combined with using dialyzer
has high ultrafiltration coefficient and the group only used dialyzer has
low ultrafiltration coefficient (52.4 ± 6.8 mg/Lvs 32.5 ± 5.7 mg/Land
6.2 ± 4.2 mg/L), pANOVA < 0.001.
+Mean value of serumβ2M concentrations decreated after 6
months treatment when combined with Hemodiafiltration online and
when combined with dialyzer has high ultrafiltration coefficient (69.2 ±
18.9 mg/L and 32.4 ± 9.1 mg/L vs 64.8 ± 18.8 mg/L and 46.7 ± 12.8
mg/L). If used only dialyzer with low ultrafiltration coefficient then theβ2M
concentration tended to increase (66.04 ± 26.7 mg/L vs 68.5 ± 24.9 mg/L).
RECOMMENDATIONS
+ Patients on hemodialysis should be regularly tested serumβ2
microglobulin concentration and factors affecting β2M concentration
to provide basis for diagnosis, prognosis and treatment of chronic renal
failure in order to increase life quality of patients.
+ To control increased serum β2M concentration in patients on
hemodialysis, it should be applied the blood filtration method that
combines dialyzer with low ultrafiltration coefficient with
Hemodiafiltration online or with dialyzer with high ultrafilatration
coefficient.
+ There should be further studies with a larger number of patients
and longer duration on effect of increased serum β2M on some
25
diseases, syndromes and effectiveness of controlling blood β2M
concentration on these diseases and syndromes.