the condition of education in brief 2006
Bạn đang xem bản rút gọn của tài liệu. Xem và tải ngay bản đầy đủ của tài liệu tại đây (336.81 KB, 26 trang )
U.S. Department of Education
NCES 2006-072
This page intentionally left blank.
U.S. Department of Education
NCES 2006-072
The Condition
of Education 2006
in Brief
June 2006
Editor
Andrea Livingston
MPR Associates, Inc.
U.S. Department of Education
Margaret Spellings
Secretary
Institute of Education Sciences
Grover J. Whitehurst
Director
National Center for Education Statistics
Mark Schneider
Commissioner
Suggested Citation
Livingston, A. (2006). The Condition
of Education 2006 in Brief (NCES
2006-072). U.S. Department of Ed-
ucation. Washington, DC: National
Center for Education Statistics.
For additional information,
contact Michael Planty:
National Center for
Education Statistics
phone: 202-502-7312
e-mail:
To order this pub li ca tion or the
complete volume, write to
U.S. Department of Education
ED Pubs
P.O. Box 1398
Jessup, MD 20794–1398
call toll free 1-877-4ED-PUBS;
or order online at
.
The complete volume also
appears on the NCES website:
/>The National Center for Education Statistics (NCES) is the primary federal entity for collecting, analyzing, and reporting data
related to education in the United States and other nations. It fulfi lls a congressional mandate to collect, collate, analyze,
and report full and complete statistics on the condition of education in the United States; conduct and publish reports and
specialized analyses of the meaning and signifi cance of such statistics; assist state and local education agencies in improving
their statistical systems; and review and report on education activities in other countries.
NCES activities are designed to address high-priority education data needs; provide consistent, reliable, com plete, and ac-
curate indicators of ed u ca tion status and trends; and report timely, useful, and high-quality data to the U.S. De part ment of
Education, the Congress, the states, other education policymakers, prac ti tio ners, data users, and the general public. Unless
specifi cally noted, all information contained herein is in the public domain.
We strive to make our products available in a variety of formats and in language that is appropriate to a variety of audiences.
You, as our customer, are the best judge of our success in communicating information effectively. If you have any comments
or suggestions about this or any other U.S. Department of Education, National Center for Ed u ca tion Statistics, product or
report, we would like to hear from you. Please direct your comments to
National Center for Education Statistics
Institute of Education Sciences
U.S. Department of Education
1990 K Street NW
Washington, DC 20006–5651
June 2006
The NCES World Wide Web Home Page is .
The NCES World Wide Web Electronic Catalog is />What’s Inside
This publication contains a sample of the 50 indicators in The Condition of Education 2006. To order the entire printed
edition of The Condition free of charge, call ED PUBS (1-877-4ED-PUBS).
The indicators in this publication are numbered sequentially, rather than according to their numbers in the complete edition.
The Contents page offers a cross-reference between the two publications.
Since 1870, the federal government has gathered data about students, teachers, schools, and education fund ing. As man-
dated by Congress, the U.S. De part ment of Ed u ca tion’s National Center for Education Statistics (NCES) in the Institute of
Education Sciences annually publishes a sta tis ti cal report on the status and progress of ed u ca tion in the United States. The
Condition of Education in cludes data and analysis on a wide variety of issues. The 2006 edition contains a special analysis
and The Condition indicators are divided into fi ve sections:
•
Participation in Education
•
Learner Outcomes
•
Student Effort and Educational Progress
•
Contexts of Elementary and Secondary Education
•
Contexts of Postsecondary Education
The indicators in The Condition of Education use data from government and private sources. The complete publication
includes a special analysis on the performance of U.S. students and adults relative to their peers in other countries. The
publication also contains ad di tion al tables and notes related to each in di ca tor.
The Condition of Education 2006 in Brief and the complete edition are available on the NCES website ().
This page intentionally left blank.
Contents
Indicator 1 U.S. Performance on International Education Assessments (Table 10) 2
Indicator 2 Past and Projected Elementary and Secondary Public School Enrollments (Indicator 3) 3
Indicator 3 Trends in Private School Enrollments (Indicator 4) 4
Indicator 4 Racial/Ethnic Distribution of Public School Students (Indicator 5) 5
Indicator 5 Past and Projected Undergraduate Enrollments (Indicator 9) 6
Indicator 6 Reading Performance of Students in Grades 4 and 8 (Indicator 12) 7
Indicator 7 Mathematics Performance of Students in Grades 4 and 8 (Indicator 13) 8
Indicator 8 Science Performance of Students in Grades 4, 8, and 12 (Indicator 18) 9
Indicator 9 Trends in Adult Literacy (Indicator 19) 10
Indicator 10 Status Dropout Rates by Race/Ethnicity (Indicator 26) 11
Indicator 11 Public High School Graduation Rates by State (Indicator 28) 12
Indicator 12 Immediate Transition to College (Indicator 29) 13
Indicator 13 Educational Attainment (Indicator 31) 14
Indicator 14 Student/Teacher Ratios in Public Elementary and Secondary Schools (Indicator 35) 15
Indicator 15 Parental Choice of Schools (Indicator 36) 16
Indicator 16 School Violence and Safety (Indicator 39) 17
Indicator 17 Expenditures in Public Elementary and Secondary Schools by Expenditure Category (Indicator 42) 18
Indicator 18 Degrees and Fields of Study (Indicator 45) 19
Indicator 19 Federal Grants and Loans to Undergraduate Students (Indicator 50) 20
Special Analysis
Participation
in Education
Learner Outcomes
Student Effort and
Educational Progress
Contexts of Elementary
and Secondary Education
Contexts of
Postsecondary Education
Page 2 | The Condition of Education 2006 in Brief
Indicator 1
U.S. Performance on
International Education
Assessments
U.S. 4th-graders perform relatively well in reading literacy compared with their international peers, including
those in highly industrialized countries. At 4th grade, U.S. students perform relatively well in mathematics
and science, but may not be keeping pace with their international peers. They are showing improvement at
8th grade. However, when U.S. 15-year-olds are asked to apply what they have learned in mathematics and
science, they show less ability than most of their peers in other highly industrialized countries. U.S. adults
scored below four out of fi ve other countries in literacy and numeracy.
Based on the results of recent international assessments, measures of students’ and adults’ skills
and abilities in reading, mathematics, and science present a mixed picture.
1
Includes those countries with approved data appearing in
reports. Total excludes the United States.
SOURCE: International Association for the Evaluation of
Educational Achievement (IEA), Progress in International
Reading Literacy Study (PIRLS), 2001; Trends in International
Mathematics and Science Study (TIMSS), 2003; Statistics Canada
and Organization for Economic Cooperation and Development
(OECD), Adult Literacy and Lifeskills (ALL) Survey, 2003; OECD,
Program for International Student Assessment (PISA), 2003,
previously unpublished tabulation (October 2005).
Special Analysis
U.S. performance on international assessments of mathematics, science, and reading relative to other countries
Number of countries with
average score relative to the United States
Number of Signifi cantly Not signifi cantly Signifi cantly
Subject and grade or age countries
1
higher different lower
Reading
4th-graders (2001) 34 3 8 23
15-year-olds (2000) 30 3 20 7
Mathematics
4th-graders (2003) 24 11 0 13
8th-graders (2003) 44 9 10 25
15-year-olds (2003) 38 23 4 11
Science
4th-graders (2003) 24 3 5 16
8th-graders (2003) 44 7 5 32
15-year-olds (2003) 38 18 9 11
Adult literacy
Ages 16–65 (2003) 5 4 0 1
Adult numeracy
Ages 16–65 (2003) 5 4 0 1
The Condition of Education 2006 in Brief | Page 3
Participation in Education
Indicator 2
Past and Projected
Elementary and
Secondary Public
School Enrollments
Rising immigration since 1970 and the baby boom echo—a 25 percent increase in the number of annual
births that began in the mid-1970s and peaked in 1990—boosted public school enrollment in grades pre-
kindergarten (preK) through 12 from the latter part of the 1980s through the early 2000s. Public school
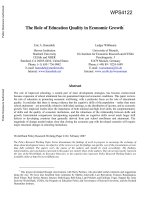
enrollment is projected to reach an estimated 48.7 million in 2005 and to increase each year to an all-time
high of 51.2 million in 2015. Enrollment in grades preK –8 is projected to decrease to 33.8 million in 2005
and then to increase to 36.4 million in 2015, while enrollment in grades 9–12 is projected to increase to
15.1 million in 2007 and then to decrease to 14.8 million in 2015.
Public elementary and secondary enrollment is projected to increase to 51 million in 2015.
SCHOOL ENROLLMENT: Public elementary and secondary school enrollment in prekindergarten through grade 12, by
grade level, with projections: Various years, fall 1965–2015
0
20,000
10,000
30,000
40,000
50,000
60,000
Enrollment (in thousands)
Projected
Grades 9–12
Grades preK–8
Total
Fall of year
20152010200520001995199019851980197519701965
48,560
33,925
14,634
NOTE: Includes kindergarten and most prekindergarten enroll-
ment. Data for years 2001 and 2002 were revised and may differ
from previously published fi gures.
SOURCE: U.S. Department of Education, National Center for
Education Statistics (NCES). (forthcoming). Digest of Education
Statistics, 2005 (NCES 2005-030), tables 37 and 40; Hussar,
W. (forthcoming). Projections of Education Statistics to 2015
(NCES 2006-084), table 1; Snyder, T., and Hoffman, C.M.
(1995). State Comparisons of Education Statistics: 1969–70 to
1993–94 (NCES 95-122), tables 10 and 11; and table ESE65,
retrieved January 10, 2006, from />AnnualReports/reports.asp?type=historicalTables. Data from
U.S. Department of Education, NCES, The NCES Common Core
of Data (CCD), “State Nonfi scal Survey of Public Elementary/
Secondary Education,” 1986–87 to 2003–04 and Statistics of
Public Elementary and Secondary School Systems, various years,
1965–66 to 1985–86.
Page 4 | The Condition of Education 2006 in Brief
Indicator 3
Trends in Private School
Enrollments
Between 1989–90 and 2001–02, private school enrollment in kindergarten through grade 12 increased from
4.8 to 5.3 million students but declined to 5.1 million students in 2003–04. The distribution of students across
types of private schools changed between 1989–90 and 2003–04. Though Roman Catholic schools continue
to have the largest share of total private school enrollment, the percentage decreased from 55 to 46 percent due
to the decline in the percentage of students enrolled in parochial schools.
1
However, there were increases in the
percentage of students enrolled in Conservative Christian schools, from 11 to 15 percent, and in the percentage
enrolled in nonsectarian private schools, from 13 to 18 percent.
The number of private school students in kindergarten through grade 12 increased from 1989–90
through 2001–02 and then declined in 2003–04, while the percentage fl uctuated at around 10 percent.
1
Parochial schools are Catholic schools run by a parish, not by a
diocese or independently.
2
Other religious schools have a religious orientation or purpose,
but are not Roman Catholic. Conservative Christian schools are
those with membership in at least one of four associations: Ac-
celerated Christian Education, American Association of Christian
Schools, Association of Christian Schools International, or Oral
Roberts University Education Fellowship. Affi liated schools are
those with membership in other religious school associations.
Unaffi liated schools are those that have a religious orientation
or purpose, but are not classifi ed as Conservative Christian or
affi liated.
3
Nonsectarian schools do not have a religious orientation
or purpose.
NOTE: Detail may not sum to totals because of rounding.
SOURCE: Broughman, S.P., and Swaim, N.L. (2006). Character-
istics of Private Schools in the United States: Results From the
2003–2004 Private School Universe Survey (NCES 2006-319),
table 7 and previously unpublished tabulation (September
2005). Data from U.S. Department of Education, National
Center for Education Statistics, Private School Universe Survey
(PSS), various years, 1989–90 through 2003–04.
Participation in Education
PRIVATE SCHOOL ENROLLMENT: Percentage distribution of private school students in kindergarten through grade 12,
by school type: 1989–90 and 2003–04
0
20
40
60
80
100
Percent
1989–90 2003–04
Non-
sectarian
3
Other religious
2
School type
Roman Catholic
UnaffiliatedAffiliatedConservative
Christian
TotalPrivateDiocesanParochialTotal
55
21
15
18
77
32
36
11
15
9
10
13
11
13
18
32
46
The Condition of Education 2006 in Brief | Page 5
Participation in Education
Indicator 4
Racial/Ethnic Distribution
of Public School Students
In 2004, 43 percent of public school students were considered to be part of a racial or ethnic minority
group, up from 22 percent in 1972. In comparison, the percentage of public school students who were White
decreased from 78 to 57 percent. The minority increase was largely due to the growth in the proportion
of students who were Hispanic, from 6 percent in 1972 to 19 percent in 2004. The proportion of students
who were Black or members of other minority groups increased less over this period than the proportion
who were Hispanic, and Hispanic enrollment surpassed that of Blacks for the fi rst time in 2002. In the West,
beginning in 2003, minority public school enrollment exceeded White enrollment.
The percentage of racial/ethnic minority students enrolled in the nation’s public schools increased
between 1972 and 2004, primarily due to growth in Hispanic enrollments.
# Rounds to zero.
1
Includes Asians/Pacifi c Islanders.
NOTE: Detail may not sum to totals because of rounding.
Black includes African American, Hispanic includes Latino,
and Pacifi c Islander includes Native Hawaiian. Race categories
exclude Hispanic origin unless specifi ed. Includes all public
school students enrolled in kindergarten through 12th grade.
Starting in 2003, the categories for race were changed on the
Current Population Survey (CPS), allowing respondents to select
more than one race. Respondents who selected more than one
race were placed in the “Other” category for the purposes of this
analysis. In 2004, some 2.4 percent of public school students
were more than one race.
SOURCE: U.S. Department of Commerce, Census Bureau, Current
Population Survey (CPS), October Supplement, 1972 and 2004,
previously unpublished tabulation (September 2005).
MINORITY ENROLLMENT: Percentage distribution of the race/ethnicity of public school students enrolled in kindergarten
through 12th grade, by region: Fall 1972 and 2004
0
20
40
60
80
100
Percent
Other
1
Hispanic
Black
White
2004197220041972200419722004197220041972
43
73
54
70
74
88
64
81
57
78
6
6
24
25
14
11
15
12
16
15
39
1517
5
7
2
14
6
19
6
12
6
5
1
5
#
7
1
7
1
WestSouth
Region
MidwestNortheastTotal
Page 6 | The Condition of Education 2006 in Brief
Indicator 5
Past and Projected
Undergraduate
Enrollments
Total undergraduate enrollment in degree-granting postsecondary institutions has generally increased over
the past three and a half decades and is projected to continue increasing through 2015, albeit at a slower
rate. These increases have been accompanied by changes in the proportion of students who are women.
Since 1978, the number of undergraduate women in degree-granting 2- and 4-year institutions has exceeded
the number of undergraduate men. Since 1970, women’s undergraduate enrollment has increased more
than twice as fast as men’s. From 2006 to 2015, both men’s and women’s undergraduate enrollments are
projected to increase, but at a slower rate than in the past 10 years. Women’s undergraduate enrollment is
projected to continue growing faster than men’s enrollment.
Women’s undergraduate enrollment has increased at a faster rate than men’s since 1970, and this
trend is expected to continue through 2015.
Participation in Education
NOTE: Projections are based on data through 2004 and middle
alternative assumptions concerning the economy. Data for 1999
were imputed using alternative procedures.
SOURCE: U.S. Department of Education, National Center for
Education Statistics (NCES). (forthcoming). Digest of Education
Statistics, 2005 (NCES 2006-030), tables 176 and 189 and
Hussar, W. (forthcoming). Projections of Education Statistics to
2015 (NCES 2006-084), table 19. Data from U.S. Department of
Education, NCES, Higher Education General Information Survey
(HEGIS), “Fall Enrollment in Colleges and Universities” surveys,
1970–1985, and 1986–2005 Integrated Postsecondary Educa-
tion Data System, “Fall Enrollment Survey” (IPEDS-EF:86–99)
and Spring 2001 through Spring 2005.
UNDERGRADUATE ENROLLMENT: Total undergraduate enrollment in degree-granting 2- and 4-year postsecondary
institutions, by sex, with projections: Fall 1970–2015
0
1,000
2,000
3,000
4,000
5,000
6,000
7,000
8,000
9,000
10,000
11,000
12,000
Enrollment (in thousands)
Female
Male
Year
2015201020052000199519901985198019751970
Projected
8,538
6,376
The Condition of Education 2006 in Brief | Page 7
Learner Outcomes
Indicator 6
Reading Performance
of Students in Grades
4 and 8
The National Assessment of Educational Progress (NAEP) has assessed the reading abilities of 4th-, 8th-,
and 12th-graders in both public and private schools since 1992.
1
Between 1992 and 2005, national aver-
age reading scores of 4th- and 8th-graders varied little, though both were 2 points higher in 2005 than in
1992. Reported on a scale of 0–500, the average score of 4th-graders increased from 217 in 1992 to 219
in 2005, while the average score of 8th-graders increased from 260 to 262. The percentage of 4th-graders
at or above Profi cient (indicating solid academic achievement) increased between 1992 and 2002 (from
29 to 31 percent) and has remained steady since then. Thirty-one percent of 8th-graders performed at or
above this level in 2005.
National average reading scores of 4th- and 8th-graders have varied little over time, though both
were 2 points higher in 2005 than in 1992.
1
The 2005 National Assessment of Educational Progress (NAEP)
assessment included a 12th-grade component, but these data
were not available at the time of this analysis.
2
Testing accommodations (e.g., extended time, small group
testing) for children with disabilities and limited-English-
profi cient students were not permitted.
NOTE: Beginning in 2002, the NAEP national sample was
obtained by aggregating the samples from each state, rather
than by obtaining an independently selected national sample.
As a consequence, the size of the national sample increased, and
smaller differences between years or between types of students
were found to be statistically signifi cant than would have been
detected in previous assessments.
SOURCE: Perie, M., Grigg, W.S., and Donahue, P.L. (2005). The
Nation’s Report Card: Reading 2005 (NCES 2006-451), fi gure
1. Data from U.S. Department of Education, National Center for
Education Statistics, National Assessment of Educational Prog-
ress (NAEP), various years, 1992–2005 Reading Assessments.
READING PERFORMANCE: Average reading scores for 4th-, 8th-, and 12th-graders: Various years, 1992–2005
225
250
275
300
325
Score
0
200
Year
1992 1994 1998 2000 2002 20052003
292
260
264
263
290
215
217
260
214
217
287
291
287
264
213
219
218
262
219
263
Accommodations
not permitted
2
Accommodations
permitted
Grade 12
1
Grade 8
Grade 4
Page 8 | The Condition of Education 2006 in Brief
Indicator 7
Mathematics
Performance of Students
in Grades 4 and 8
The National Assessment of Educational Progress (NAEP) has assessed the mathematics abilities of students
in grades 4, 8, and 12 in public and private schools since 1990.
1
In 2005, the national average mathematics
scores of 4th- and 8th-graders were higher than in all previous assessments. Reported on a 0–500 scale,
between 1990 and 2005, the average score of 4th-graders increased 25 points, from 213 to 238, and the
average score of 8th-graders increased 16 points, from 263 to 279. The percentage of students performing
at or above Profi cient (indicating solid academic performance) increased from 13 to 36 percent during this
period in grade 4 and from 15 to 30 percent in grade 8.
The mathematics performance of 4th- and 8th-graders improved steadily from 1990 to 2005. For
both grades, the average score in 2005 was higher than in all previous assessments.
Learner Outcomes
1
The 2005 National Assessment of Educational Progress (NAEP)
assessment included a 12th-grade component, but at the time
of this analysis, these data were not available.
2
Testing accommodations (e.g., extended time, small group
testing) for children with disabilities and limited-English-
profi cient students were not permitted.
NOTE: Beginning in 2003, the NAEP national sample was
obtained by aggregating the samples from each state, rather
than by obtaining an independently selected national sample.
As a consequence, the size of the national sample increased, and
smaller differences between years or between types of students
were found to be statistically signifi cant than would have been
detected in previous assessments.
SOURCE: Perie, M., Grigg, W.S., and Dion, G.S. (2005). The Nation’s
Report Card: Mathematics 2005 (NCES 2006-453), fi gure 1. Data
from U.S. Department of Education, National Center for Educa-
tion Statistics, National Assessment of Educational Progress
(NAEP), various years, 1990–2005 Mathematics Assessments.
MATHEMATICS PERFORMANCE: Average mathematics scores for 4th-, 8th-, and 12th-graders: Various years, 1990–2005
225
250
275
300
325
Score
0
200
Year
1990 1992 1996 2000 20052003
294
263
272
302
224
224
270
268
220
213
299
304
301
273
226
235
279
238
278
Accommodations
not permitted
2
Accommodations
permitted
Grade 12
1
Grade 8
Grade 4
The Condition of Education 2006 in Brief | Page 9
Learner Outcomes
Indicator 8
Science Performance
of Students in Grades
4, 8, and 12
The National Assessment of Educational Progress (NAEP) has assessed the science abilities of 4th-, 8th-, and
12th-graders in both public and private schools since 1996, using a separate 0–300 scale for each grade. Be-
tween 1996 and 2005, the national average 4th-grade science score increased from 147 to 151; there was no
measurable change in the 8th-grade score; and the 12th-grade score decreased from 150 to 147. The percentages
of 4th- and 8th-graders performing at or above Profi cient (indicating solid academic achievement) were not
measurably different from 1996 to 2005, while the percentage of 12th-graders at or above this level decreased.
In 2005, 29 percent of 4th- and 8th-graders and 18 percent of 12th-graders were at or above Profi cient.
In 2005, the average science score of students was higher than in previous assessment years at
grade 4, was not measurably different at grade 8, and was lower at grade 12 than in 1996.
1
Testing accommodations (e.g., extended time, small group
testing) for children with disabilities and limited-English-
profi cient students were not permitted on the 1996 science
assessment.
SOURCE: Grigg, W., Lauko, M., and Brockway, D. (2006). The
Nation’s Report Card: Science 2005 (NCES 2006-466), fi gure
1. Data from U.S. Department of Education, National Center
for Education Statistics, National Assessment of Educational
Progress (NAEP), 1996, 2000, and 2005 Science Assessments.
SCIENCE PERFORMANCE: Percentage of students performing at or above Basic and at or above Profi cient in science, by
grade: 1996, 2000, and 2005
0
20
40
60
80
100
Percent
At or above Basic At or above Proficient
63
28
63
27
68
29
60
29
59
30
59
29
57
21
52
18
54
18
200520001996
1
200520001996
1
20052000
Grade 12Grade 8Grade 4
1996
1
Page 10 | The Condition of Education 2006 in Brief
Indicator 9
Trends in Adult Literacy
The National Assessment of Adult Literacy (NAAL) assessed adults age 16 or older in three types of literacy
1
(prose, document, and quantitative) in 1992 and 2003. The average prose and document literacy scores of
U.S. adults were not measurably different in 2003 from 1992, but the average quantitative literacy score
increased 8 points between these years. Adults’ educational attainment was positively related to all three types
of literacy: those with a bachelor’s degree or higher outperformed their peers in 1992 and 2003. Between
these years, average prose literacy decreased at each level of educational attainment, and document literacy
decreased among those with at least some college education or a bachelor’s degree or higher.
While the quantitative literacy of adults improved from 1992 to 2003, the prose and document
literacy of adults was not measurably different between these two years.
Learner Outcomes
1
Literacy is defi ned as “using printed and written information to
function in society, to achieve one’s goals, and to develop one’s
knowledge and potential.”
2
Included in this category are those still enrolled in high school.
NOTE: Prose literacy is the knowledge and skills needed to
perform prose tasks (i.e., to search, comprehend, and use
information from continuous texts, such as paragraphs from
stories); document literacy is the knowledge and skills needed
to perform document tasks (i.e., to search, comprehend, and use
information from noncontinuous texts in various formats, such
as bills or prescription labels); and quantitative literacy is the
knowledge and skills required to perform quantitative tasks (i.e.,
to identify and perform computations, either alone or sequen-
tially, using numbers embedded in printed materials). Results are
reported in terms of average scores on a 0–500 scale.
SOURCE: Kutner, M., Greenberg, E., and Baer, J. (2005). A First
Look at the Literacy of America’s Adults in the 21st Century (NCES
2006-470), fi gure 1. Data from U.S. Department of Education,
National Center for Education Statistics (NCES), 2003 National
Assessment of Adult Literacy (NAAL).
ADULT LITERACY PERFORMANCE: Average prose, document, and quantitative literacy scores of adults age 16 or older, by
educational attainment: 2003
0
50
150
250
100
200
300
500
Score
Literacy type
217
275
219
258
282
307
283
221
268
296
327
288
261
320
271
Bachelor’s degree
or higher
Some collegeHigh school diploma
or equivalent
Less than
high school
2
Total
QuantitativeDocumentProse
The Condition of Education 2006 in Brief | Page 11
Student Effort and Educational Progress
Indicator 10
Status Dropout Rates
by Race/Ethnicity
The status dropout rate represents the percentage of an age group that is not enrolled in school and has not
earned a high school credential (i.e., diploma or equivalent, such as a General Educational Development
[GED] certifi cate). According to this measure, 10 percent of 16- to 24-year-olds were out of school without
a high school credential in 2004. The status dropout rate declined for this age group between 1972 and
2004, including the more recent period since 1990. Status dropout rates and changes in these rates over
time differ by race/ethnicity. Since 1972, status dropout rates for White, Black, and Hispanic young adults
have declined, with rates remaining lowest for Whites and highest for Hispanics.
Status dropout rates for Whites, Blacks, and Hispanics ages 16–24 have declined since 1972;
nonetheless, in 2004, rates remained lowest for Whites and highest for Hispanics.
NOTE: The status dropout rate reported in this indicator is one of a
number of rates used to report high school dropout and comple-
tion behavior in the United States. Due to small sample sizes,
American Indians/Alaska Natives and Asians/Pacifi c Islanders
are included in the total but are not shown separately. Starting
in 2003, totals for 2003 and 2004 include respondents indicating
more than one race, but these respondents are not shown sepa-
rately. The variable nature of the Hispanic status dropout rates
refl ects, in part, the historically small sample size of Hispanics.
Black includes African American and Hispanic includes Latino.
Race categories exclude Hispanic origin unless specifi ed. Some
estimates are revised from previous publications.
SOURCE: Laird, J., DeBell, M., and Chapman, C. (forthcoming).
Dropout Rates in the United States: 2004 (NCES 2006-085),
table 8. Data from U.S. Department of Commerce, Census
Bureau, Current Population Survey (CPS), October Supplement,
1972–2004.
STATUS DROPOUTS: Dropout rates of 16- through 24-year-olds, by race/ethnicity: October 1972–2004
0
10
20
30
40
50
Percent
Year
Hispanic
Black
White
Total
20041972 1976 1980 1984 1988 1992 1996 2000
Page 12 | The Condition of Education 2006 in Brief
Indicator 11
Public High School
Graduation Rates
by State
The averaged freshman graduation rate—a measure of the percentage of the incoming freshman class that
graduates 4 years later—can be used as a measure of the percentage of public high school students who
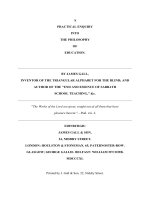
graduate on time. Among all public high school students in the class of 2002–03, the averaged freshman
graduation rate was 73.9 percent, from a low of 59.6 percent in the District of Columbia to a high of 87.0
in New Jersey. The overall averaged freshman graduation rate among public school students increased from
71.7 percent for the class of 2000–01 to 73.9 percent for the class of 2002–03. Between the two years, there
was an increase in the graduation rate in 43 states.
The 2002–03 public high school graduation rate for the averaged freshman class 4 years earlier
was 73.9 percent.
Student Effort and Educational Progress
NOTE: The averaged freshman graduation rate is the number of
graduates divided by the estimated count of freshmen 4 years
earlier. The estimated count of freshmen is calculated by sum-
ming 10th-grade enrollment 2 years before the graduation year,
9th-grade enrollment 3 years before the graduation year, and
8th-grade enrollment 4 years before the graduation year and
dividing this amount by 3. Enrollment counts include a propor-
tional distribution of students not enrolled in a specifi c grade.
SOURCE: Seastrom, M., Hoffman, L., Chapman, C., and Stillwell, R.
(2005). The Averaged Freshman Graduation Rate for Public High
Schools from the Common Core of Data: School Years 2001–02
and 2002–03 (NCES 2006-601), tables 2 and 3 and previously
unpublished tabulation (September 2005). Data from U.S. De-
partment of Education, National Center for Education Statistics,
Common Core of Data (CCD), “State Nonfi scal Data File: School
Years 1996–97 through 2003–04.”
HIGH SCHOOL COMPLETION: Averaged freshman graduation rate for public high school students, by state: 2002–03
80.0 percent or more (14)
75.0–79.9 percent (16)
70.0–74.9 percent (10)
Less than 70.0 percent (11)
The Condition of Education 2006 in Brief | Page 13
Student Effort and Educational Progress
Indicator 12
Immediate Transition
to College
Between 1972 and 2004, the rate at which high school completers
1
enrolled in college in the fall immediately
after high school increased from 49 to 67 percent. About half of White high school completers immediately
enrolled in college between 1972 and 1978, and 69 percent had done so by 2004. The rate for Blacks was
stable between 1972 and 1977, but then decreased until 1983, widening the Black-White gap. Thereafter,
the rate for Blacks increased through 2004, narrowing the gap between the two groups. For Hispanics, the
annual rate has fl uctuated over time, resulting in a nearly fl at trend between 1972 and 2002, before increas-
ing to 62 percent by 2004. The Hispanic-White gap widened between 1979 and 1997.
The immediate college enrollment rate has increased since 1972. Between 1998 and 2001, the
Black-White gap narrowed, while the Hispanic-White gap widened between 1979 and 1997.
COLLEGE ENROLLMENT RATES: Actual and trend rates of high school completers who were enrolled in college the October
immediately after completing high school, by race/ethnicity: 1972–2004
1
Refers to those who completed 12 years of school for survey
years 1972–1991 and to those who earned a high school di-
ploma or equivalent (e.g., a General Educational Development
[GED] certifi cate) for years since 1992.
NOTE: Includes those ages 16–24 completing high school in a
given year. Actual rates are annual estimates; trend rates show
the linear trend of these annual values over the time period
shown. The Current Population Survey (CPS) questions used to
obtain educational attainment were changed in 1992. In 1994,
the survey methodology for the CPS was changed and weights
were adjusted. Black includes African American and Hispanic
includes Latino. Race categories exclude Hispanic origin unless
specifi ed. The erratic nature of the Hispanic rate refl ects, in part,
the small sample size of Hispanics.
SOURCE: U.S. Department of Commerce, Census Bureau, Current
Population Survey (CPS), October Supplement, 1972–2004, pre-
viously unpublished tabulation for 2004 (November 2005).
0
20
40
60
80
100
Percent
White vs.Black White vs.Hispanic
Actual
Trend
Rates
Year
1972 1976 1980 1984 1988 1992 1996 2000 2004 1972 1976 1980 1984 1988 1992 1996 2000 2004
WhiteWhite
Black Hispanic
Page 14 | The Condition of Education 2006 in Brief
Indicator 13
Educational Attainment
In most of the years between 1971 and 2005, the rate at which 25- to 29-year-olds completed a bachelor’s
degree or higher was roughly half the rate at which they completed at least some college education. The
percentage in this age group who had completed a bachelor’s degree or higher increased from 17 to 29
percent between 1971 and 2005, while the percentage who had completed at least some college education
increased from 34 to 57 percent. Although the percentage who completed a bachelor’s degree or higher
increased for White, Black, and Hispanic 25- to 29-year-olds, the gaps between Whites and Blacks and
between Whites and Hispanics have widened over time.
The percentages of 25- to 29-year-olds who have completed a bachelor’s degree or higher have
increased since 1971, but racial/ethnic differences in levels of educational attainment remain.
Student Effort and Educational Progress
BACHELOR’S DEGREE OR HIGHER: Percentage of 25- to 29-year-olds who completed a bachelor’s degree or higher, by
race/ethnicity: March 1971–2005
0
20
40
60
80
100
Percent
Year
1971 1974 1977 1980 1983 1986 1989 1992 1995 1998 2001 2005
Hispanic
Black
White
Total
1
1
Included in the totals but not shown separately are those from
other racial/ethnic categories.
NOTE: Prior to 1992, “high school completers” meant those who
completed 12 years of schooling and “some college” meant com-
pleting 1 or more years of college; beginning in 1992, the terms
meant those who received a high school diploma or equivalency
certifi cate and those who completed any college at all, respec-
tively. In 1994, the survey instrument for the Current Population
Survey (CPS) was changed and weights were adjusted. Some
estimates are revised from previous publications. Black includes
African American and Hispanic includes Latino. Race categories
exclude Hispanic origin unless specifi ed.
SOURCE: U.S. Department of Commerce, Census Bureau, Current
Population Survey (CPS), Annual Social and Economic Study
Supplement, 1971–2005, previously unpublished tabulation
(November 2005).
The Condition of Education 2006 in Brief | Page 15
Contexts of Elementary and Secondary Education
Indicator 14
Student/Teacher Ratios
in Public Elementary
and Secondary Schools
The ratio of students to teachers, frequently used as a proxy measure for class size,
1
declined from 17.6 stu-
dents per teacher in 1990 to 16.5 in 2003 for regular
2
public elementary, secondary, and combined schools.
Likewise, the student/teacher ratio for regular public elementary schools declined during this period. In
contrast, student/teacher ratios for all regular public secondary schools increased between 1990 and 1995
and then declined in 2003. In every year from 1990 to 2003, the student/teacher ratios tended to be higher
in public schools with larger enrollments than in public schools with smaller enrollments. For example,
in 2003, regular elementary schools with over 1,500 students enrolled 6.9 more students per teacher, on
average, than regular elementary schools with enrollments under 300.
Student/teacher ratios tend to be higher in public schools with larger enrollments than in public
schools with smaller enrollments.
STUDENT/TEACHER RATIO: Student/teacher ratios in regular public elementary and secondary schools, by level and
enrollment of school: Fall 1990–2003
1
Student/teacher ratios do not provide a direct measure of
class size because they are based on the amount of time
in full-time equivalents that all teachers in a school spend
instructing students. These teachers include classroom teach-
ers; prekindergarten teachers in some elementary schools; art,
music, and physical education teachers; and teachers who do
not teach regular classes every period of the day.
2
Regular schools include all schools except special education
schools, vocational schools, and alternative schools.
NOTE: The student/teacher ratio is determined by dividing the
total number of full-time-equivalent teachers into the total
enrollment. This analysis excludes schools that did not report
both enrollment and teacher data.
SOURCE: U.S. Department of Education, National Center for Edu-
cation Statistics, The NCES Common Core of Data (CCD), “Public
Elementary/Secondary School Universe Survey,” 1990–91
through 2003–04, previously unpublished tabulations (July
and August 2005).
0
5
10
15
20
25
2003199819941990
Students
per teacher
Enrollment
Elementary Secondary
Year
2003199819941990
1,500ormore
1,000–1,499
500–999
300–499
Under 300
Page 16 | The Condition of Education 2006 in Brief
Indicator 15
Parental Choice
of Schools
The percentage of students in grades 1–12 attending a “chosen” public school
1
increased from 11 to 15
percent between 1993 and 2003, while the percentage attending assigned public schools decreased from 80
to 74 percent. During this period, the percentages of students attending private schools also increased (0.9
percentage points for private church-related schools and 0.8 percentage points for private not church-related
schools). When asked whether they could send their child to a chosen public school, the parents of 51 percent
of students reported having such a choice in 2003.
2
The parents of 24 percent of students reported that they
moved to their current neighborhood so that their children could attend their current school.
The percentage of children whose parents enrolled them in chosen public schools increased
between 1993 and 2003.
Contexts of Elementary and Secondary Education
DIFFERENCES IN PARENTAL CHOICE: Percentage distribution of students in grades 1–12, by type of school: 1993 and
2003
Percentage
point Percent
Type of school 1993 2003 difference change
Public, assigned 79.9 73.9 -6.0 -7.5
Public, chosen 11.0 15.4 4.4 40.0
Private, church-related 7.5 8.4 0.9 12.0
Private, not church-related 1.6 2.4 0.8 50.0
0 20406080100
Private, not church-related
Private, church-relatedPublic,chosenPublic,assigned
Percent
2003
1993
73.9 15.4 8.4 2.4
79.9 11.0 7.5 1.6
1
A public school other than their assigned public school.
2
In some school districts, the child is assigned to a specifi c
school; in others, the parents can choose the school their child
will attend. Parents may also be able to choose a school from
outside the home district. Estimates in this indicator are based
on parents’ responses and parents may or may not know
whether such choice is available.
NOTE: Includes homeschooled students enrolled in public or
private schools for 9 or more hours per week. Detail may not
sum to totals because of rounding.
SOURCE: U.S. Department of Education, National Center for Edu-
cation Statistics, School Readiness Survey of the 1993 National
Household Education Surveys (NHES) Program, School Safety
and Discipline Survey of the 1993 NHES, and Parent and Family
Involvement in Education Survey of the 2003 NHES, previously
unpublished tabulations (May 2004).
The Condition of Education 2006 in Brief | Page 17
Contexts of Elementary and Secondary Education
Indicator 16
School Violence
and Safety
From 1992 through 2003, the rate of nonfatal crime against students at school
1
declined by 53 percent
for theft (from 95 to 45 crimes per 1,000 students) and by 42 percent for all violent crime (from 48 to 28
crimes per 1,000 students). During this period, the rates for these crimes also decreased when students were
away from school. In each year observed, the rates for serious violent crime were lower when students were
at school than away from school. In 2003, a greater percentage of high school-age students (ages 15–18)
than middle school-age students (ages 12–14) were victims of crime away from school, but no measurable
difference was found between these two groups in their rates of crime at school.
There was a general decline in the rate at which students ages 12–18 were victims of theft and
violent crime at school from 1992 through 2003.
TRENDS IN VICTIMIZATION: Rate of nonfatal crime against students ages 12–18 at school or on the way to or from school
per 1,000 students, by type of crime: 1992–2003
1
“At school” includes inside the school building, on school
property, or on the way to and from school.
NOTE: Nonfatal crime includes theft and all violent crime; all vio-
lent crime includes serious violent crimes (rape, sexual assault,
robbery, and aggravated assault) and simple assault.
SOURCE: DeVoe, J.F., Peter, K., Noonan, M., Snyder, T.D., and Baum,
K. (2005). Indicators of School Crime and Safety: 2005 (NCES
2006-001/NCJ 210697), table 2.1. Data from U.S. Department
of Justice, Bureau of Justice Statistics, School Crime Supple-
ment (SCS) to the National Crime Victimization Survey (NCVS),
1992–2003.
Rate (per 1,000 students)
40
80
20
0
60
100
Year
Theft
All violent crime
Serious violent crime
20022001 2003200019991998199719961995199419931992
Page 18 | The Condition of Education 2006 in Brief
Indicator 17
Expenditures in Public
Elementary and
Secondary Schools by
Expenditure Category
Between 1989–90 and 2002–03, total expenditures per student in fall enrollment in public elementary and
secondary schools rose 25 percent in constant dollars, from $7,692 to $9,644. This rate of increase was
not evenly distributed among the fi ve major categories of expenditures. Spending on capital outlay and
interest increased the most between these years (64 percent), while instructional expenditures increased
23 percent and spending on administration and on operation and maintenance each increased 7 percent.
In 2002–03, more than half of the $9,644 spent on students in public schools went toward instructional
expenditures such as teacher salaries and benefi ts, followed by other items,
1
capital expenditures, operation
and maintenance, and administration.
Expenditures per student rose 25 percent in constant dollars from 1989–90 to 2002–03, with
capital expenditures increasing the fastest.
Contexts of Elementary and Secondary Education
EXPENDITURES BY CATEGORY: Percentage distribution of total expenditures in public elementary and secondary schools,
by expenditure category: 1989–90 and 2002–03
1
Other expenditures include funds for student support, instruc-
tional staff, student transportation, other support services, food
services, and enterprise operations, all of which are components
of current expenditures. Also included in other expenditures are
funds for adult education, community colleges, private school
programs funded by local and state education agencies, and
community services.
NOTE: Detail may not sum to totals because of rounding.
Expenditures have been adjusted for the effects of infl ation
using the Consumer Price Index (CPI) and are in constant
2003–04 dollars.
SOURCE: U.S. Department of Education, National Center for
Education Statistics, The NCES Common Core of Data (CCD),
“National Public Education Financial Survey,” 1989–90 to
2002–03, previously unpublished tabulation (July 2005).
0
20
40
60
80
100
Percent
1989–90 2002–03
Other
1
Capital outlay
and interest
Operation and
maintenance
Expenditure category
AdministrationInstruction
53
52
8
7
10
8
10
13
19
20
The Condition of Education 2006 in Brief | Page 19
Contexts of Postsecondary Education
Indicator 18
Degrees and Fields
of Study
The number of bachelor’s degrees awarded from academic years 1989–90 through 2003–04 increased from
1.05 million to 1.40 million (33 percent). Growth in the number of bachelor’s degrees awarded was greater
during the second half of this period than during the fi rst half. Each year, more bachelor’s degrees were
awarded in business than in any other fi eld. Although there was a 24 percent increase in the number of
bachelor’s degrees awarded in business, the rate of increase was slower than the rate for bachelor’s degrees
overall. Three of the next fi ve largest fi elds in 2003–04 also experienced increases in the number of bachelor’s
degrees awarded, with visual and performing arts experiencing the greatest increase (93 percent).
The number of bachelor’s degrees awarded increased by 33 percent between 1989–90 and
2003–04.
SOURCE: U.S. Department of Education, National Center for
Education Statistics (NCES). (forthcoming). Digest of Education
Statistics, 2005 (NCES 2006-030), table 250, and previously un-
published tabulation (July 2005). Data from U.S. Department
of Education, NCES, 1989–90 through 2003–04 Integrated
Postsecondary Education Data System, “Completions Survey”
(IPEDS-C:89–99) and Fall 2000 through Fall 2004.
BACHELOR’S DEGREES: Number of bachelor’s degrees, by fi eld of study: 1989–90 through 2003–04
0
50,000
100,000
150,000
200,000
250,000
300,000
350,000
Visual and
performing arts
Engineering
and engineering
technologies
Psychology
Education
Social sciences
and history
Business
1989–90 1991–92 1993–94 1995–96 1997–98 1999–2000 2001–02 2003–04
Number of degrees
Year