control of cracking in concrete structures
Bạn đang xem bản rút gọn của tài liệu. Xem và tải ngay bản đầy đủ của tài liệu tại đây (770.61 KB, 46 trang )
ACI 224R-01 supersedes ACI 224R-90 and became effective May 16, 2001.
Copyright
2001, American Concrete Institute.
All rights reserved including rights of reproduction and use in any form or by any
means, including the making of copies by any photo process, or by electronic or
mechanical device, printed, written, or oral, or recording for sound or visual reproduc-
tion or for use in any knowledge or retrieval system or device, unless permission in
writing is obtained from the copyright proprietors.
ACI Committee Reports, Guides, Standard Practices,
and Commentaries are intended for guidance in planning,
designing, executing, and inspecting construction. This
document is intended for the use of individuals who are
competent to evaluate the significance and limitations of
its content and recommendations and who will accept re-
sponsibility for the application of the material it contains.
The American Concrete Institute disclaims any and all re-
sponsibility for the stated principles. The Institute shall
not be liable for any loss or damage arising therefrom.
Reference to this document shall not be made in con-
tract documents. If items found in this document are de-
sired by the Architect/Engineer to be a part of the contract
documents, they shall be restated in mandatory language
for incorporation by the Architect/Engineer.
224R-1
Control of Cracking in Concrete Structures
ACI 224R-01
The principal causes of cracking and recommended crack-control proce-
dures are presented. The current state of knowledge in microcracking and
fracture of concrete is reviewed. The control of cracking due to drying
shrinkage and crack control in flexural members, overlays, and mass con-
crete construction are covered in detail. Long-term effects on cracking are
considered and crack-control procedures used in construction are pre-
sented. Information is presented to assist in the development of practical
and effective crack-control programs for concrete structures. Extensive ref-
erences are provided.
Keywords: aggregates; anchorage (structural); bridge decks; cement-
aggregate reactions; concrete construction; concrete pavements; concrete
slabs; cooling; corrosion; crack propagation; cracking (fracturing); crack
width and spacing; drying shrinkage; shrinkage-compensating concrete;
heat of hydration; mass concrete; microcracking; polymer-modified concrete;
prestressed concrete; reinforced concrete; restraint; shrinkage; temperature;
tensile stresses; thermal expansion; volume change.
CONTENTS
Chapter 1—Introduction, p. 224R-2
Chapter 2—Crack mechanisms in concrete,
p. 224R-2
2.1—Introduction
2.2—Compressive microcracking
2.3—Fracture
Chapter 3—Control of cracking due to drying
shrinkage, p. 224R-11
3.1—Introduction
3.2—Cause of cracking due to drying shrinkage
3.3—Drying shrinkage
3.4—Factors controlling drying shrinkage of concrete
3.5—Control of shrinkage cracking
3.6—Shrinkage-compensating concrete
Chapter 4—Control of cracking in flexural
members, p. 224R-17
4.1—Introduction
4.2—Crack-control equations for reinforced concrete beams
4.3—Crack control in two-way slabs and plates
4.4—Tolerable crack widths versus exposure conditions in
reinforced concrete
4.5—Flexural cracking in prestressed concrete
4.6—Anchorage-zone cracking in prestressed concrete
4.7—Crack control in deep beams
4.8—Tension cracking
Reported by ACI Committee 224
Mohamed Abou-Zeid David W. Fowler
*
Edward G. Nawy
*
John H. Allen Grant T. Halvorsen Randall W. Poston
*
James P. Barlow Will Hansen
*
Royce J. Rhoads
Merle E. Brander
*
M. Nadim Hassoun Andrew Scanlon
Kathy Carlson Harvey Haynes
*
Ernest K. Schrader
*
David Darwin
*
Paul Hedli Wimal Suaris
*
Fouad H. Fouad
*
Tony C. Liu Zenon A. Zielinski
Florian Barth
Chairman
Robert J. Frosch
*
Secretary
*
Members of ACI 224 who assisted in revisions to this report.
224R-2 ACI COMMITTEE REPORT
Chapter 5—Long-term effects on cracking,
p. 224R-24
5.1—Introduction
5.2—Effects of long-term loading
5.3—Environmental effects
5.4—Aggregate and other effects
5.5—Use of polymers in improving cracking characteristics
Chapter 6—Control of cracking in overlays,
p. 224R-25
6.1—Introduction
6.2—Fiber-reinforced concrete (FRC) overlays
6.3—Latex- and epoxy-modified concrete overlays
6.4—Polymer-impregnated concrete (PIC) systems
6.5—Epoxy and other polymer concrete overlays
Chapter 7—Control of cracking in mass concrete,
p. 224R-28
7.1—Introduction
7.2—Methods of crack control
7.3—Design
7.4—Construction
7.5—Operation
Chapter 8—Control of cracking by proper
construction practices, p. 224R-34
8.1—Introduction
8.2—Restraint
8.3—Shrinkage
8.4—Settlement
8.5—Construction
8.6—Specifications to minimize drying shrinkage
8.7—Conclusion
Chapter 9—References, p. 224R-39
9.1—Referenced standards and reports
9.2—Cited references
9.3—Other references
CHAPTER 1—INTRODUCTION
Cracks in concrete structures can indicate major structural
problems and detract from the appearance of monolithic
construction. There are many specific causes of cracking.
This report presents the principal causes of cracking and a
detailed discussion of crack-control procedures. The report
consists of eight chapters designed to help the engineer and
the contractor in developing crack-control measures.
This report is an update of previous committee reports
(ACI Committee 224 1972, 1980, 1990). ACI Bibliogra-
phy No. 9 supplemented the original ACI 224R (1971). The
Committee has also prepared reports on the causes, evaluation,
and repair of cracking, ACI 224.1R; cracking of concrete in di-
rect tension, ACI 224.2R; and joints in concrete construction,
ACI 224.3R.
In this revision of the report, Chapter 2 on crack mechanisms
has been revised extensively to reflect the interest and attention
given to aspects of fracture mechanics of concrete during the
1980s. Chapter 3 on drying shrinkage has been rewritten.
Chapter 4 has been revised to include updated information
on crack-width predictive equations, cracking in partially
prestressed members, anchorage zone cracking, and flexural
cracking in deep flexural members. Chapter 6 on concrete
overlays has been reorganized and revised in modest detail
to account for updated information on fiber reinforcement
and on polymer-modified concrete. Chapter 7 on mass
concrete has been revised to consider structural consequences
more extensively.
CHAPTER 2—CRACK MECHANISMS IN
CONCRETE
2.1—Introduction
Cracking plays an important role in concrete’s response to
load in both tension and compression. The earliest studies of
the microscopic behavior of concrete involved the response
of concrete to compressive stress. That early work showed
that the stress-strain response of concrete is closely associated
with the formation of microcracks, that is, cracks that form at
coarse-aggregate boundaries (bond cracks) and propagate
through the surrounding mortar (mortar cracks) (Hsu, Slate,
Sturman, and Winter 1963; Shah and Winter 1966; Slate and
Matheus 1967; Shah and Chandra 1970; Shah and Slate
1968; Meyers, Slate, and Winter 1969; Darwin and Slate
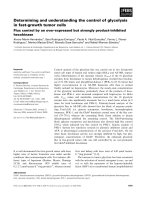
1970), as shown in Fig. 2.1.
During early microcracking studies, concrete was considered
to be made up of two linear, elastic brittle materials; cement
paste and aggregate; and microcracks were considered to be
the major cause of concrete’s nonlinear stress-strain behavior
in compression (Hsu, Slate, Sturman, and Winter 1963; Shah
and Winter 1966). This picture began to change in the
1970s. Cement paste is a nonlinear softening material, as
is the mortar constituent of concrete. The compressive non-
linearity of concrete is highly dependent upon the response
of these two materials (Spooner 1972; Spooner and Dougill
1975; Spooner, Pomeroy, and Dougill 1976; Maher and Dar-
win 1977; Cook and Chindaprasirt 1980; Maher and Darwin
1982) and less dependent upon bond and mortar microcracking
than originally thought. Research indicates, however, that a sig-
nificant portion of the nonlinear deformation of cement paste
and mortar results from the formation of microcracks that
are several orders of magnitude smaller than those observed in
the original studies (Attiogbe and Darwin 1987, 1988). These
smaller microcracks have a surface density that is two to
three orders of magnitude higher than the density of bond
and mortar microcracks in concrete at the same compres-
sive strain, and their discovery represents a significant
step towards understanding the behavior of concrete and
its constituent materials in compression.
The effect of macroscopic cracks on the performance and
failure characteristics of concrete has also received considerable
attention. For many years, concrete has been considered a brittle
material in tension. Many attempts have been made to use
principles of fracture mechanics to model the fracture of
concrete containing macroscopic cracks.
The field of fracture mechanics was developed by Griffith
(1920) to explain the failure of brittle materials. Linear elastic
fracture mechanics (LEFM) predicts the rapid propagation of a
microcrack through a homogeneous, isotropic, linear-elastic
material. The theory uses the stress-intensity factor K that
CONTROL OF CRACKING IN CONCRETE STRUCTURES 224R-3
represents the stress field ahead of a sharp crack in a struc-
tural member which is a function of the crack geometry and
stress. K is further designated with subscripts, I, II, and III,
depending upon the nature of the deformation at the crack
tip. For a crack at which the deformation is perpendicular to
the crack plane, K is designated as K
I
, and failure occurs
when K
I
reaches a critical value K
Ic
, known as the critical
stress-intensity factor. K
Ic
is a measure of the fracture tough-
ness of the material, which is simply a measure of the resis-
tance to crack propagation. Often the region around the crack
tip undergoes nonlinear deformation, such as yielding in
metals, as the crack grows. This region is referred to as the
plastic zone in metals, or more generally as the fracture process
zone. To properly measure K
Ic
for a material, the test specimen
should be large enough so that the fracture process zone is
small compared with the specimen dimensions. For LEFM
to be applicable, the value of K
Ic
must be a material property,
independent of the specimen geometry (as are other material
properties, such as yield strength or compressive strength).
Initial attempts to measure K
Ic
in concrete were unsuccessful
because K
Ic
depended on the size and geometry of the test
specimens (Wittmann 1986). As a result of the heterogeneity
inherent in cement paste, mortar, and concrete, these materials
exhibit a significant fracture-process zone and the critical
load is preceded by a substantial amount of slow crack growth.
This precritical crack growth has been studied experimentally
by several researchers (John and Shah 1986; Swartz and Go
1984; Bascoul, Kharchi, and Maso 1987; Maji and Shah
1987; Castro-Montero, Shah, and Miller 1990). This research
has provided an improved understanding of the fracture process
zone and has led to the development of more rational fracture
criteria for concrete.
This chapter is divided into two sections. The first section
on compressive microcracking presents the current knowledge
of the response of concrete and its constituent materials under
compressive loading and the role played by the various types
of microcracks in this process. The second section discusses
the applicability of both linear and nonlinear fracture mechanics
models to concrete. A more comprehensive treatment of the
fracture of concrete can be found in ACI 446.1R.
2.2—Compressive microcracking
During early microcracking research, a picture devel-
oped that closely linked the formation and propagation of
microcracks to the load-deformation behavior of concrete.
Before loading, volume changes in cement paste cause inter-
facial cracks to form at the mortar-coarse aggregate bound-
ary (Hsu 1963; Slate and Matheus 1967). Under short-term
compressive loads, no additional cracks form until the load
reaches about 30% of the compressive strength of the con-
crete (Hsu, Slate, Sturman, and Winter 1963). Above this
value, additional bond cracks are initiated throughout the
matrix. Bond cracking increases until the load reaches about
70% of the compressive strength, at which time the microc-
racks begin to propagate through the mortar. Mortar crack-
ing continues at an accelerated rate, forming continuous
cracks parallel to the direction of compressive load, until the
concrete is no longer able to sustain the load. The onset of
mortar cracking is related to the sustained, or long-term,
compressive strength. Derucher (1978) obtained a somewhat
different picture of the microscopic behavior of concrete
using the scanning electron microscope (SEM). He subjected
dried concrete specimens to eccentric compressive loading
within the SEM. He observed that microcracks that exist
Fig. 2.1—Cracking maps and stress-strain curves for concrete loaded in uniaxial compression
(Shah and Slate 1968).
224R-4 ACI COMMITTEE REPORT
before loading are in the form of bond cracks, with exten-
sions into the surrounding mortar perpendicular to the bond
cracks. Under increasing compression, these bond cracks
widen but do not propagate at loads as low as 15% of the
strength. At about 20% of ultimate, the bond cracks begin to
propagate, and at about 30%, they begin to bridge between
one another. The bridging is almost complete at 45% of the
compressive strength. At 75% of ultimate, mortar cracks
start to join one another and continue to do so until failure.
In general, microcracking that occurs before loading has little
effect on the strength of compressive strength of the concrete.
In studies of high-strength concrete, Carrasquillo, Slate,
and Nilson (1981) concluded that it was more appropriate to
classify cracks as simple (bond or mortar) and combined
(bond and mortar) and that the formation of combined
cracks consisting of more than one mortar crack signaled
unstable crack growth. They observed that the higher the
concrete strength, the higher the strain (relative to the strain at
peak stress) at which this unstable crack growth is observed.
They observed less total cracking in high-strength concrete
than normal-strength concrete at all stages of loading.
Work by Meyers, Slate, and Winter (1969), Shah and
Chandra (1970), and Ngab, Slate, and Nilson (1981) demon-
strated that microcracks increase under sustained and cyclic
loading. Their work indicated that the total amount of micro-
cracking is a function of the total compressive strain in the
concrete and is independent of the method in which the strain
is applied. Suaris and Fernando (1987) also showed that the
failure of concrete under constant amplitude cyclic loading
is closely connected with microcrack growth. Sturman, Shah,
and Winter (1965) found that the total degree of microcracking
is decreased and the total strain capacity in compression is
increased when concrete is subjected to a strain gradient.
Since the early work established the existence of bond and
mortar microcracks, it has been popular to attribute most, if
not all, of the nonlinearity of concrete to the formation of
these microscopic cracks (Hsu, Slate, Sturman, and Winter
1963; Shah and Winter 1966; Testa and Stubbs 1977; Car-
rasquillo, Slate, and Nixon 1981). A cause and effect rela-
tionship, however, has never been established (Darwin
1978). Studies by Spooner (1972), Spooner and Dougill
(1975), Spooner, Pomeroy, and Dougill (1976), and Maher
and Darwin (1982) indicate that the degree of microcracking
can be taken as an indication of the level of damage rather
than as the controlling factor in the concrete’s behavior.
Experimental work by Spooner (1972), Spooner and Dougill
(1975), Spooner, Pomeroy, and Dougill (1976), and Martin,
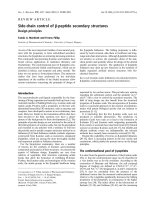
Darwin, and Terry (1991) indicates that the nonlinear compres-
sive behavior of concrete is strongly influenced by the nonlinear
behavior of cement paste. As illustrated in Fig. 2.2, cement
paste under compression is not an elastic, brittle material as
stated in the past, but a nonlinear material with a relatively high
strain capacity. The nonlinear behavior of cement paste can be
tied to damage sustained by the paste, even at very low stresses.
Using a cyclic loading procedure, Spooner (1972), Spoon-
er and Dougill (1975), and Spooner, Pomeroy, and Dougill
(1976) demonstrated that both paste and concrete undergo mea-
surable damage at strains (0.0004) at which an increase in bond
and mortar microcracking cannot be detected. The level of
damage can be detected at low loads by using an energy
method and by a change in the initial modulus of elasticity
for each load cycle. The process of damage is continuous up
to failure.
The physical nature of damage that occurs in cement paste,
like that in concrete, appears to be related to cracking. This
point was first made by Spooner, Pomeroy, and Dougill
(1976) based on volumetric strain measurements and then by
Fig. 2.2—Stress-strain curves for cement paste, mortar, and concrete; w/c = 0.5 (Martin,
Darwin, and Terry 1991).
CONTROL OF CRACKING IN CONCRETE STRUCTURES 224R-5
Yoshimoto et al. (1972) and Yoshimoto, Ogino, and
Kawakami (1976) who reported the formation of “hair-
shaped” and “void-shaped” cracks in paste under flexure and
compressive loading. The relationship between nonlinear
deformation and cracking in cement paste is now firmly es-
tablished by the work of Attiogbe and Darwin (1987, 1988).
Studies of the stress-strain behavior of concrete under cyclic
compressive load (Karsan and Jirsa 1969; Shah and Chandra
1970) indicated the concrete undergoes rapid deterioration
once the peak stress exceeds 70% of the short-term compres-
sive strength of the concrete. In their study of cyclic creep,
Neville and Hirst (1978) found that heat is generated even
when specimens are cycled below this level. They attributed
the heat to sliding at the interfacial boundary. The work of
Neville and Hirst, along with the work of Spooner, suggests
that it can be possible that the heat measured is due to some
microscopic sliding within the paste.
Several studies have attempted to establish the importance
of interfacial bond strength on the behavior of concrete in
compression. Two studies seemed to indicate a very large
effect, thus emphasizing the importance of interfacial
strength on concrete behavior in compression (Shah and
Chandra 1970; Nepper-Christensen and Nielsen 1969).
These studies used relatively thick, soft coatings on coarse
aggregate to reduce the bond strength. Because these soft
coatings isolated the aggregate from the surrounding mortar,
the effect was more like inducing a large number of voids in
the concrete matrix.
Two other studies (Darwin and Slate 1970; Perry and
Gillott 1977) that did not isolate the coarse aggregate from
the mortar indicated that interfacial strength plays only a minor
role in controlling the compressive stress-strain behavior of
concrete. Darwin and Slate (1970) used a thin coating of
polystyrene on natural coarse aggregate. They found that a
large reduction in interfacial bond strength causes no change
in the initial stiffness of concrete under short-term compressive
loads and results in about a 10% reduction in the compressive
strength, compared with similar concrete made with aggregate
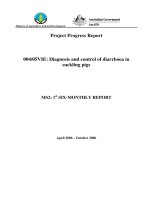
with normal interfacial strength (Fig. 2.3). Darwin and Slate
also monitored microcracking. In every case, however, the
average amount of mortar cracking was slightly greater for
specimens made with coated aggregate. This small yet
consistent difference may explain the differences in the
stress-strain curves. Perry and Gillott (1977) used glass
spheres with different degrees of surface roughness as coarse
aggregate. Their results also indicate that reducing the inter-
facial strength of the aggregate decreases the compressive
strength by about 10%.
Work by Carino (1977), using polymer-impregnated
concrete, corroborated these last two studies. Carino
found that polymer impregnation did not increase the inter-
facial bond strength but did increase the compressive
strength of concrete. He attributed the increase in strength to
the polymer’s effect on mortar strength, therefore downgrading
the importance of interfacial bond.
The importance of mortar in controlling the stress-strain
behavior of concrete is illustrated by the finite-element work
of Buyukozturk (1970) and Maher and Darwin (1976, 1977).
Buyukozturk (1970) used a finite-element representation of
a physical model of concrete. The model treated mortar (in
compression) and aggregate (in compression and tension) as
linear elastic materials while allowing cracks to form in the
mortar and at mortar aggregate boundaries. Buyukozturk
simulated the overall crack patterns under uniaxial loading.
His finite-element model, however, could not duplicate the
full nonlinear behavior of the physical model using the for-
mation of interfacial bond cracks and mortar cracks as the
only nonlinear effects. Maher and Darwin (1976, 1977) have
shown that a very close representation of the actual stress-
strain behavior can be obtained using a nonlinear representation
for the mortar constituent of the physical model.
Fig 2.3—Stress-strain curves as influenced by coating aggregates (Darwin and Slate
1970).
224R-6 ACI COMMITTEE REPORT
Maher and Darwin also studied the behavior of the mortar
constituent of concrete under monotonic and cyclic com-
pression (1982). Degradation in mortar was shown to be a
continuous process and a function of both total strain and
load history. The study indicated that residual strain as well
as the change in the initial modulus of elasticity are good
measures of structural change within the material. Accumu-
lations of residual strain were obtained for values of maxi-
mum strain as low as 0.00027. The work showed that the
maximum strain alone does not control the degradation of
mortar in compression and that the total strain range (both
loading and unloading) adds to the degradation in stiffness
and accumulation of residual strain. Their work concludes as
was previously observed (Meyers, Slate, and Winter 1969;
Shah and Chandra 1970; Ngab, Slate, and Nilson 1981) that
bond and mortar microcracking in concrete is a function of
the compressive strain in the concrete and is independent of
the method in which the strain is applied. Because the maxi-
mum strain does not appear to completely control degrada-
tion, factors other than bond and mortar cracks can dominate
the degradation of concrete during cyclic loading.
Martin, Darwin, and Terry (1991) studied the behavior of
paste, mortar, and concrete under cyclic and short-term sus-
tained compression. They found a great similarity in the be-
havior of concrete and its mortar constituent although the
bond and mortar microcracking found in concrete were not
observed in the mortar specimens. Of the three materials stud-
ied, cement paste has the greatest strain capacity and strength,
followed by mortar and concrete (Fig. 2.2).
To understand the compressive response of the cement
paste and mortar constituents of concrete, Attiogbe and
Darwin (1987, 1988) used the SEM to study submicro-
scopic cracking under uniaxial compression (Fig. 2.4). Ma-
terials with water-cement ratios (w/c) of 0.3, 0.5, and 0.7
were subjected to monotonic, cyclic, and short-term sustained
loading. Their observations showed that most cracks in
cement paste range in width from 0.2 to 0.7
µm (8 to 28 × 10
-5
in.) and in length from 10 to over 200 µm (4 to over 80 × 10
-4
in.).
Tests on mortar showed that nonloaded specimens had about
40% of the crack density of the corresponding cement
paste specimens. As the applied strain was increased,
however, the crack density increased more rapidly in the
mortar, eventually surpassing the value obtained in the cement
paste. While sand particles can reduce crack density due
to volume changes in cement paste, these results indicate
that they act as stress raisers when load is applied. This
increase in crack density under applied loading may explain
the reduction in ultimate strain capacity exhibited in Fig. 2.2
(Martin, Darwin, and Terry 1991) for mortar, compared with
cement paste at the same w/c.
Using analytical procedures, Attiogbe and Darwin (1988)
established that a significant portion of the nonlinear strain
in cement paste and mortar can be attributed to the microcracks
within the cement paste.
Overall, the damage to cement paste in compression seems
to play a dominant role in controlling the primary stress-
strain behavior of concrete under compression. In normal-
weight concrete, aggregate particles act as stress risers,
increasing the initial stiffness and decreasing the strength
of the paste and controlling the compressive strength of the
concrete. An understanding of concrete behavior in compres-
sion, thus, requires an understanding of both the behavior of ce-
ment paste in compression and the interaction of cement
paste with aggregate particles.
2.3—Fracture
2.3.1 Applicability of linear elastic fracture mechanics—
The fracture toughness of a brittle material, which is charac-
terized by a critical stress-intensity factor K
Ic
can be mea-
sured by using a single-edge notched beam subjected to a
monotonically increasing load. The load is applied so that a
constant rate of crack-mouth-opening displacement (CMOD)
is maintained. If the load-CMOD curve is linear, LEFM can
be used to calculate K
Ic
based on the measured maximum load
and the length of the crack just before failure (ASTM E 399).
K
Ic
is used in the design of metal structures to prevent brittle
failure where fatigue crack growth is expected to occur. For
LEFM to be applicable, however, the value of K
Ic
should
be a material property independent of the specimen geometry.
When K
Ic
was calculated for concrete, as described previ-
ously, significant effects of the size and geometry of the test
specimen were observed by many investigators (Kaplan
1961; Naus and Lott 1969; Higgins and Bailey 1976). The
data presented in Fig. 2.5 (Higgins and Bailey 1976) shows
that K
Ic
increases with the specimen depth. Such results led
many to question the applicability of LEFM to concrete.
Results obtained from single-edge notched beams were also
analyzed by several investigators to determine if concrete dis-
plays any notch sensitivity. Notch sensitivity can be expressed
as the ratio of net stress at the crack tip to the modulus of rup-
ture of an unnotched specimen. Data on the notch sensitivity
of hardened cement paste, mortar, and concrete are shown in
Fig. 2.6 (Higgins and Bailey 1976; Kesler, Naus, and Lott
1972; Shah and McGarry 1971; Gjørv, Sorenson, and Arneson
1977; Hillemeier and Hilsdorf 1977). The specimens showing
no notch sensitivity are likely the result of deficiencies in the
Fig 2.4—Crack through calcium silicate-hydrate and calcium
hydroxide in cement paste (Attiogbe and Darwin 1987).
CONTROL OF CRACKING IN CONCRETE STRUCTURES 224R-7
test methods, as explained by Gjørv et al. (1977). The results
indicate, however, that both mortar and concrete display less
notch sensitivity than hardened cement paste. It is widely
accepted today that this lower notch sensitivity for the relatively
more heterogeneous materials, particularly concrete, is due to
the fact that LEFM is inapplicable for laboratory-size
specimens of these materials (Gjørv et al. 1977; Wittmann
1986). It is also widely accepted (Linsbauer et al. 1989a,
1989b), however, that LEFM is a valid tool for analyzing
large concrete structures, such as dams, where the heteroge-
neities and the fracture process zone are small compared
with the structure dimensions.
2.3.2 Nonlinear fracture models for concrete—The inap-
plicability of LEFM to laboratory-size concrete specimens is
the result of the heterogeneity inherent in the concrete. This
heterogeneity results in a relatively large fracture process
zone that results in a substantial amount of crack growth
(crack extension) preceding the critical (maximum) load and
Fig. 2.5—Size effect on stress-intensity factor (based on data from Higgins and Bailey 1976).
Fig. 2.6—Effect of relative notch depth on notch sensitivity (based on data from Higgins
and Bailey 1976; Kesler, Naus, and Lott 1972; Shah and McGarry 1971; Gjørv, Soren-
son, and Arneson 1977; Hillemeier and Hilsdorf 1977).
224R-8 ACI COMMITTEE REPORT
is responsible for the strong dependence of K
Ic
on the size
and geometry of test specimens. Precritical crack growth
(crack extension) for a notched beam test is shown in Fig. 2.7,
where the crack growth ahead of the notch was continuously
monitored using a specially developed brittle crack gage (John
and Shah 1986).
The fracture process zone in concrete is substantially dif-
ferent from the plastic zone in metals. For metals, the plastic
zone is defined as a zone where the material has yielded
ahead of the crack. LEFM is based on the assumption that the
plastic zone is substantially smaller than the dimensions of
the test specimen. Laboratory-size specimens satisfy this cri-
terion for metals. For concrete, Ba
ž
ant (1979) stated that the
fracture process zone has a negligible effect if the cross-
sectional dimensions of a member is at least 100 times the
maximum aggregate size, which would lead to prohibitive
size requirements. For instance, concrete with 19 mm (3/4 in.)
aggregates would require a beam with a depth of at least of 2 m
(6 ft). In view of these specimen size requirements, when
LEFM is not applicable for many of the fracture tests that
have been conducted on concrete. Therefore, if laboratory-size
specimens are used to evaluate the fracture toughness of
Fig. 2.7—Precritical crack growth (John and Shah 1986).
Fig. 2.8—Normalized peak stress versus crack width in unaxial tension (Gopalratnam and
Shah 1986).
CONTROL OF CRACKING IN CONCRETE STRUCTURES 224R-9
concrete, it is imperative that the effect of the process zone
is considered.
Figure 2.8 shows the results of a uniaxial tensile test
conducted by Gopalaratnam and Shah (1986). The average
(surface) crack opening displacements during this test
were measured microscopically. The peak of the curve,
shown in Fig. 2.8 at zero displacement, is assumed to be
equal to the tensile strength of the concrete, and the area un-
der the curve is considered to be the fracture energy of the
concrete G
f
.
Hillerborg, Modeer, and Petersson (1976) developed the
fictitious crack model, which has been used for finite ele-
ment analysis of concrete fracture. Figure 2.9(a) illustrates
the basic concept of the approach. For a beam in flexure, the
left-hand portion of Fig. 2.9(a) shows the variation in stress
along the crack path, reaching a peak at the fictitious crack
tip, where the stress is equal to (the tensile strength of the
concrete), and the CTOD is zero. Moving to the left of the
peak, the stress drops as the crack opens, with the real crack
ending at the point where the stress across the crack has
dropped to zero. To the right, the stress drops in advance of
the crack. The material between the real and fictitious crack
tip transmits tensile stress as defined by a (softening) stress-
crack opening displacement curve, such as Fig. 2.8 and the
right-hand portion of Fig. 2.9(a). If the shape of this soften-
ing curve is assumed to be fixed, then the fracture of the con-
crete is completely characterized by and G
f
.
Ba
ž
ant and Oh (1983) developed a crack band model to
account for the fracture process zone in concrete in a
smeared manner through the introduction of a strain-softening
constitutive relation. In this model, the crack front has a width
of W
c
that is equal to the width of a single finite element (Fig.
2.9[b]). The crack band model is designed to produce a response
f
t
′
f
t
′
in a finite element model that essentially matches the results of
the fictitious crack model. In the crack band model, the crack
is represented by an equivalent change in material properties
within an element. In Fig. 2.9(b), the figure on the left-hand side
is analogous to the figure on the left-hand side of Fig. 2.9(a),
showing a variation in stress along the crack front as a function
of location. The right-hand portion of Fig. 2.9(b) shows the
stress-strain curve that defines the behavior of an element as
the crack grows. The rising portion of the stress-strain curve
is used to simulate a slowly opening crack. The product of the
strain ε
f
shown in Fig. 2.9(b) and the width of the finite ele-
ment W
c
is equal the crack opening displacement δ
c
shown in
Fig. 2.9(a). When used in conjunction with the two material
properties used for the fictitious crack model, G
f
and , the
two procedures produce nearly identical results (Leibengood,
Darwin, and Dodds 1986).
2.3.3 Nonlinear fracture models based on adaptation of
LEFM—Several investigators have proposed the use of an
effective crack length a
e
to account for the fracture process
zone (Catalano and Ingraffea 1982; Nallathambi and Karih-
aloo 1986; Refai and Swartz 1987). The effective crack
length is obtained from the reduction in stiffness at the peak
load in a three-point bend test. The effective crack depends on
the maximum grain size of the aggregate and on the geometry
of the specimen. The term a
e
is obtained by comparing the
compliance of the test specimen with compliances obtained
from a series of prenotched beams. When K
Ic
is calculated
using the effective crack length, a size-independent value is
f
t
′
(a)
Fig 2.9—(a) Fictitious crack model; and (b) crack band
model.
(b)
Fig. 2.10—(a) Effective Griffith crack; and (b) typical plot
of load versus CMOD (Jenq and Shah 1987).
(a)
(b)
224R-10 ACI COMMITTEE REPORT
obtained. Refai and Swartz (1987) developed empirical
equations that relate effective crack length with specimen
geometry and material properties.
Jenq and Shah (1987) proposed a method to determine the
effective crack length, which is then used to calculate a crit-
ical stress-intensity factor K
s
Ic
and a critical crack tip opening
displacement (CTOD). Figure 2.10 illustrates the effective
crack-length concept. The effective crack length concept it-
self is the sum of a measurable crack, visible on the side of a
specimen, plus the additional crack length represented by the
fracture process zone. The effective crack length is evaluated
using the unloading compliance measurement C
u
of the
load-CMOD curve at the point of maximum load, as shown
in Fig. 2.10(b). Jeng and Shah found that the effective crack
length calculated from compliance measurements is the
same as that obtained using LEFM and assuming that CTOD
has a critical value, which was found to be independent of the
size and geometry of the beams tested and may be considered
to be a valid fracture parameter.
2.3.4 Size effect of fracture—The effect of structural size
on the fracture of concrete is perhaps the most compelling
reason for using fracture mechanics (ACI 446.1R).
For blunt fracture (as occurs in a crack with a diffuse fracture
process zone in materials such as concrete), the total potential-
energy release caused by fracture in a given structure depends
on the length of the fracture and the area traversed by the frac-
ture process zone so that the size of the fracture process zone is
constant and independent of the size of the structure. Dimen-
sional analysis then shows that the structural size effect
for geometrically similar specimens or structures is governed
by the simple relation (Ba
žant, Kim, and Pfeiffer 1986)
(2-1)
where
σ
Ν
= P/bd = nominal stress at failure;
σ
N
Bf
t
′
1 dd⁄
o
+()
=
P = maximum load (that is, failure load);
b = thickness;
d = characteristic dimension of the specimen or structure;
= direct tensile strength; and
B, d
o
= empirical constants, d
o
being a certain multiple of the
maximum size of inhomogeneities in the material d
a
.
The value of B and the ratio of d
o
/d
a
depends only on the
shape of the structure, not on its size. Figure 2.11 shows
the relationship between nominal stress at failure and size.
If the structure is very small, the second term in parenthe-
ses, d/d
o
of Eq. (2-1), is negligible compared with 1, and
σ
Ν
=
Β
is the failure condition that represents the strength
criterion and corresponds to the horizontal line in Fig. 2.11.
If the structure is very large, 1 is negligible compared with d/d
o
and σ
Ν
= constant / . This is the typical size effect in LEFM;
it corresponds to the inclined straight line in Fig. 2.11.
According to Eq. (2-1), the size effect in blunt fracture
represents a gradual transition from the strength criterion to
the energy criterion of LEFM.
The size-effect law has been used by Ba
žant and Sun
(1987); Ba
ž
ant and Sener (1988); and Ba
ž
ant, Sener, and
Pratt (1988) to predict the size effects for shear, torsion, and
bond pullout testing of concrete.
2.3.5 Effect of material properties on fracture—Certain
material properties, especially w/cm, play an important role
in controlling the compressive strength and durability of
concrete. The effect of these material properties on the
fracture of concrete are not certain; however, some studies
have specifically addressed this question. Early work by
Naus and Lott (1969) indicated that the fracture toughness of
cement paste and mortar increases with decreasing w/cm, but
w/cm has little effect on the fracture toughness of concrete.
Naus and Lott found that K
Ic
increases with age and decreases
with increasing air content for paste, mortar, and concrete. The
fracture toughness of mortar increases with increasing sand
content, and the fracture toughness of concrete increases
with an increase in the maximum size of the coarse aggre-
gate. Gettu, Ba
žant, and Karr (1990), in a study of the frac-
ture properties of high-strength concrete, made a number of
observations that match those obtained in the earlier work.
They observed that the fracture toughness and fracture energy
obtained with high-strength concrete is not much higher than
that for lower-strength concrete, and any increase that occurs
is at a rate less than in proportion to the square root of
compressive strength. The work by Gettu, Ba
ž
ant, and
Karr (1990) was carried out with mixtures that maintained
a constant maximum-size aggregate. When the results of
their work are combined with the typical procedure of using
smaller maximum-size aggregate for high-strength concrete,
it becomes clear that improvements in compressive strength,
obtained with the use of increased cement contents, mineral
admixtures, high-range water-reducers, and with the ac-
companying reduction in total aggregate volume, will not
increase fracture toughness. The result is that structural
members made with high-strength concrete will exhibit a
lower-than-expected capacity when the member strength
depends on the concrete tensile strength, and the design is
based on . Specific examples are flexural cracking,
f
t
′
f
t
′
d
f
c
′
Fig. 2.11—Size-effect law (Bažant, Kim, and Pfeiffer 1986).
CONTROL OF CRACKING IN CONCRETE STRUCTURES 224R-11
shear strength, and bond strength between concrete and
reinforcing steel. The impact of using high-strength concrete on
these load-carrying mechanisms needs additional study.
CHAPTER 3—CONTROL OF CRACKING DUE TO
DRYING SHRINKAGE
3.1—Introduction
Drying shrinkage of concrete is the reduction in volume
caused by the loss of water. Drying shrinkage can be defined
as the time-dependent linear strain at constant temperature
measured on an unloaded specimen that is allowed to dry.
From a structural point of view, there is no need to separate
drying shrinkage from other kinds of phenomena, such as
carbonation shrinkage and autogenous shrinkage. A typical
value for the final shrinkage strain of concrete in structures
is 600
× 10
-6
. Because the concrete tensile-strain capacity
can be 150
× 10
-6
or less, cracking will result if the shrinkage
is restrained in a concrete member. There is a high degree of
uncertainty in predicting shrinkage of concrete structures,
however, because this property varies considerably with
many parameters, including concrete composition, source of
aggregate, ambient relative humidity, specimen geometry,
and more specifically, the ratio of the exposed surface to the
volume of the structural element. Further, the slow development
of shrinkage over time makes it difficult to obtain an accurate
prediction for a given concrete from short-term laboratory
measurements. As a result, a coefficient variation of 20% or
more can be expected in predicting long-term shrinkage.
Before true moisture equilibrium has been reached within
a member cross section, internal shrinkage restraint occurs
because of moisture gradients. Consequently, self-equilibrating
internal stresses are present with tension on the surface and
compression in the interior. This stress condition can cause
cracking if not relieved by creep.
Shrinkage and creep are often responsible for excessive
deflections and curvature, losses in prestress, and redistribu-
tion of internal stresses and reactions in statically indetermi-
nate members. If not controlled, drying shrinkage can lead to
serviceability problems, such as excessive deflections, and
durability problems, such as freeze-thaw deterioration and
corrosion at cracks.
Good design and construction practices can minimize
the amount of cracking and eliminate or control the visible
large cracks by minimizing the restraint using adequate
reinforcement and contraction joints. Further information
can be found in ACI 209R. Cracking due to drying shrinkage
can never be eliminated in most structures. This chapter cov-
ers cracking of hardened concrete due to drying shrinkage,
factors influencing shrinkage, control of cracking, and the
use of expansive cements to minimize cracking. Construc-
tion practices and specifications to minimize drying shrink-
age are covered in Chapter 8.
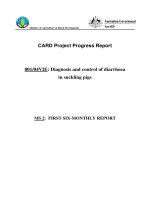
3.2—Cause of cracking due to drying shrinkage
The contraction (due to drying shrinkage) of a concrete
component within a structure is always subject to some
degree of restraint from either the foundation, another
part of the structure, or the reinforcing steel embedded in the
concrete. The combination of shrinkage and restraint devel-
ops tensile stresses within the concrete. Due to the inherent low
tensile strength of concrete, cracking will often occur (Fig. 3.1).
Additional restraint arises from nonuniform shrinkage.
Because drying occurs nonuniformly from the surface towards
the concrete core, shrinkage will create internal tensile stresses
near the surface and compression in the core. Differential
shrinkage can result in warping and surface cracks. The surface
cracks can, with time, penetrate deeper into the concrete
member as the interior portion is subject to additional
shrinkage.
As illustrated in Fig. 3.2, the tensile stress induced by
restraining drying shrinkage is reduced with time due to
creep or stress relaxation. Cracks develop only when the net
tensile stress reaches the tensile strength of concrete. The creep
relief decreases with age, however, so that the cracking ten-
dency becomes greater with increased time.
3.3—Drying shrinkage
When concrete dries, it contracts or shrinks. When it is
wetted, it expands. The expansion does not occur to the same
extent as shrinkage. These volume changes, along with
changes in moisture content, are an inherent characteristic of
hydraulic-cement concrete. The change in moisture content
of cement paste causes concrete to shrink or swell. Aggre-
gate reduces the unit volume of cement paste and provides an
internal restraint that significantly reduces the magnitude of
these volume changes in concrete.
In addition to drying shrinkage, the cement paste is also
subject to carbonation shrinkage. Shrinkage results from the
Fig. 3.1—Cracking of concrete due to drying shrinkage.
224R-12 ACI COMMITTEE REPORT
effects of carbon dioxide on the chemical changes of calcium-
silicate hydrate and crystalline-hydration products and the
drying of the pores by removing absorbed water. Calcium
hydroxide will form calcium carbonate by reacting with
atmospheric carbon dioxide. Because carbon dioxide does
not penetrate more than about 12 mm (0.5 in.) into the surface
of high-quality concrete with low porosity, carbonation
shrinkage is of minor importance in the overall shrinkage
of most concrete structures. Carbonation does, however, play
an important role in the shrinkage of small laboratory test
specimens and structures constructed with low-quality,
porous concrete, particularly when subjected to long-term
exposure to drying. The amount of carbonation shrinkage
observed on a small laboratory specimen can be greater than
the shrinkage of the concrete in the structure. This effect
results from the greater surface area to volume ratio in
smaller specimens. Shrinkage due to carbonation is discussed in
detail by Verbeck (1958).
3.4—Factors controlling drying shrinkage
of concrete
The major factors controlling ultimate drying shrinkage of
concrete include relative humidity, aggregate type and con-
tent (or paste content), water content, and w/cm. The rate of
moisture loss and shrinkage of a given concrete is influenced
by the size of the concrete member, the relative humidity,
distance from the exposed surface, and drying time.
3.4.1 Relative humidity and drying time—Relative humidity
has a major influence on ultimate shrinkage and the rate of
Fig. 3.3—Relations between shrinkage and time for concretes stored at different relative
humidities. Time reckoned since end of wet curing at 28 days (Troxell, Raphael, and Davis
1958).
Fig. 3.2—Effect of creep on tensile stress.
CONTROL OF CRACKING IN CONCRETE STRUCTURES 224R-13
shrinkage. Results by Troxell, Raphael, and Davis (1958)
showed that the lower the relative humidity, the greater the
ultimate shrinkage and rate of shrinkage (Fig. 3.3). Figure 3.3
also illustrates that expansion occurs if concrete is exposed to a
continuous supply of water; this process is known as
swelling. Swelling is small compared with shrinkage in
ordinary concrete and occurs only when the relative humidity
is maintained above 94% (Lorman 1940). Swelling can, how-
ever, be significant in lightweight concrete (Neville and
Brooks 1985). Figure 3.3 also shows that drying is a slow
process. It can take many years before ultimate shrinkage
is reached because the loss of water from hardened concrete is
diffusion controlled.
3.4.2 Influence of quantity and type of aggregate on
shrinkage—Concrete shrinkage is due primarily to shrinkage of
the hardened cement paste. The presence of aggregate in con-
crete reduces the total shrinkage by providing elastic re-
straint to paste shrinkage. Concrete shrinkage, however, is
not solely related to the relative aggregate content; there is
another effect due to the ratio of elastic modulus of aggregate
to that of the hydrated paste. When using high-quality aggre-
gates, which are characterized mainly by low absorption
capacity, this ratio is typically between four and seven
(Hansen and Almudaiheem 1987). This is also illustrated in
Fig. 3.4, where an elastic modulus ratio between 1 and 2
indicates an aggregate stiffness that is much smaller than
that of normalweight aggregate.
Pickett (1956) and Hansen and Almudaiheem (1987)
developed constitutive models for predicting the influence of
relative aggregate content and modulus ratio on ultimate
concrete shrinkage. The latter model clearly explains why
lightweight concrete for the same relative aggregate content
exhibits considerably more shrinkage than ordinary concrete.
This is also illustrated in Fig. 3.4 when the modulus ratio
is between one and two because the aggregate stiffness is
much smaller than that of normalweight aggregate.
The influence of aggregate-absorption capacity on concrete
shrinkage was investigated by Carlson (1938) and is illustrated
Fig. 3.4—Effect of relative aggregate content and modulus ratio on drying shrinkage of
concrete (Hansen and Almudaiheem 1987).
Fig 3.5—Typical effect of water content of concrete on drying
shrinkage (USBR 1981).
Table 3.1—Effect of aggregate type on concrete
shrinkage (after Carlson [1938])
Aggregate Specific gravity Absorption 1-year shrinkage, %
Sandstone 2.47 5.0 0.116
Slate 2.75 1.3 0.068
Granite 2.67 0.8 0.047
Limestone 2.74 0.2 0.041
Quartz 2.66 0.3 0.032
224R-14 ACI COMMITTEE REPORT
in Table 3.1; the concrete had identical cements and w/cms. The
absorption of an aggregate, which is a measure of porosity, in-
fluences its modulus or compressibility. A low elastic modu-
lus is usually associated with high absorption.
Quartz, limestone, dolomite, granite, feldspar, and some
basalts can be classified as higher-modulus aggregates,
which result in lower shrinkage properties of concrete. High-
shrinkage concrete often contains sandstone, slate, horn-
blende, and some types of basalts. Because the rigidity of
certain aggregates, such as granite, limestone, or dolomite,
can vary over a wide range, their effectiveness in restraining
drying shrinkage varies.
Although compressibility is the most important property
of aggregate governing concrete shrinkage, the aggregate
itself can shrink during drying. This is true for sandstone
and other aggregates of high-absorption capacity. In general,
aggregate with a high modulus of elasticity and low absorption
will produce a concrete with low ultimate shrinkage.
3.4.3 Paste content and w/cm—Consistency, as measured
by the slump test, is an important parameter in proportioning
concrete. The amount of mixing water needed to achieve a
given slump is dependent on the maximum aggregate size
used because the maximum size influences the total aggregate
surface area that needs to be covered with cement paste.
Decreasing maximum aggregate size increases the total
surface area to be covered with paste. Therefore, more water
and cement are needed to achieve a given slump. For the
same w/cm, concrete shrinkage increases with increasing
water content because the paste volume increases; this
agrees with the predictions in Fig. 3.4 and results obtained by
the U.S. Bureau of Reclamation (1975) shown in Fig. 3.5.
For a constant w/cm, there is an approximately linear rela-
tionship between water content (paste content as well) and
concrete shrinkage within the range of water contents listed.
Temperature also has an influence on the water requirements
of the fresh concrete for same slump (Fig. 3.6). A reduction
in water content, which reduces the paste content, will re-
duce the ultimate drying shrinkage of concrete. Therefore,
the water content (and paste content) of a concrete mix-
ture should be kept to a minimum to minimize potential dry-
ing shrinkage and the cracking tendency of the concrete.
Figure 3.7 illustrates that concrete shrinkage increases
with w/cm for a given aggregate content. This effect is more
pronounced with lower aggregate contents (Odman 1968).
3.4.4 Influence of member size—The size and shape of a
concrete member and the porosity of the cement paste influ-
ences the drying rate of concrete and, therefore, influences
the shrinkage rate. The shape affects the ratio of the surface
area to volume of the member, and a higher ratio results in a
higher drying rate. For a given concrete, the observed shrinkage
at a given time decreases with an increase in the size of the
specimen. This effect is illustrated in Fig. 3.8 (Bryant and
Vadhanavikkit 1987) in which long-term shrinkage results
were obtained on concrete prisms up to 400 mm (8 in.) thick.
Ultimate shrinkage may not be reached for structural members
during the intended service life.
Another consequence of moisture diffusion is that a mois-
ture gradient develops from the surface to the interior. For a
specimen that has moisture evaporation from all surfaces,
shrinkage strain is greatest at the surface where moisture
content is lowest, and shrinkage strain decreases toward the
center where moisture content is highest. Nonuniform self-
equilibrating internal stresses develop. Tensile stresses occur
at and near the surfaces and compressive stresses develop at
and near core, as shown in Fig. 3.9.
Warping occurs if drying takes place in an unsymmetrical
manner, either due to drying from one side or due to a non-
symmetrical structure. In slabs-on-grade, the warping mech-
anism is a primary cause of cracking. Moisture evaporates
from the top surface only, which causes higher shrinkage at
the top. The concrete near the top surface is partially re-
strained from shrinking because it is attached to concrete
lower in the slab that is more moist and does not shrink as
much as the top surface. This restraint produces tensile
stresses at and near the top surface, which results in the slab
warping or curling, and the free edges of the slab can lift off
Fig. 3.6—Effect of temperature of fresh concrete on its
water requirement (USBR 1981).
Fig. 3.7—Influence of w/c and aggregate content on shrinkage
(Odman 1968).
CONTROL OF CRACKING IN CONCRETE STRUCTURES 224R-15
the ground. If the edges of the slab are restrained from move-
ment, such as footings, and the slab is not allowed to warp,
then the top surface has higher tensile stresses. Cracking can
result if the tensile stresses from restrained shrinkage exceed
the tensile strength of the concrete. Cracking may also result
near the edge of the slab when a vertical load is applied on
the warped cantilever.
3.4.5 Effect of curing on shrinkage—Carlson (1938) reported
that the duration of moist curing of concrete does not have
much effect on ultimate drying shrinkage. Test results from
the California Department of Transportation (1963) show
that substantially the same shrinkage occurred in concrete
that was moist-cured for 7, 14, and 28 days before drying
started. As far as the cracking tendency of the concrete is
concerned, prolonged moist curing may not be beneficial. A
general recommendation is to continue moist curing for at
least 7 days. (For further information, refer to ACI 309.)
Sealed curing is curing without loss or addition of water.
It eliminates other kinds of shrinkage so that all the resulting
shrinkage will be autogenous. Autogenous shrinkage is a
result of the fact that the products of hydration occupy a
smaller volume than the original volume of cement and water.
Self-dessication is a problem in low w/c concretes under sealed
conditions in which the pores dry out and hydration slows
down. Autogenous shrinkage strain is typically about 40 to
100
× 10
-6
(Davis 1940). Houk, Paxton, and Houghton (1969)
found that autogenous shrinkage increases with increasing
temperature, cement content, and cement fineness.
Fig. 3.8—Influence of specimen size on shrinkage (Bryant and Vadhanavikkit 1987).
Fig 3.9—Internal restraint of shrinkage.
224R-16 ACI COMMITTEE REPORT
3.4.6 Effect of admixtures—The effect of admixtures on
concrete shrinkage is unclear. As an example, early-age
shrinkage appears to increase by about 100% in the presence
of calcium chloride, whereas later-age shrinkage is increased
by about 40% compared with control specimens (ACI 212.3R).
Air-entrainment does not seem to increase shrinkage by
more than 10% for air contents up to about 5% (Carlson 1938).
Results by Ghosh and Malhotra (1979), Brooks, Wain-
wright, and Neville (1979), and Feldman and Swenson
(1975) indicated that the use of high-range water-reducing
admixtures increases shrinkage. According to Ytterberg (1987),
high-range water-reducing admixtures do not necessarily
reduce shrinkage in proportion to their ability to reduce
water content.
3.5—Control of shrinkage cracking
Concrete tends to shrink due to drying whenever its sur-
faces are exposed to air of low relative humidity or high
winds. Because various kinds of restraint prevent the con-
crete from contracting freely, cracking should be expected,
unless the ambient relative humidity is kept near 100%. The con-
trol of cracking consists of reducing the cracking tendency to a
minimum, using adequate and properly positioned reinforce-
ment, and using contraction joints. The CEB-FIP Model
Code (1990) gives quantitative recommendations on the
control of cracking due to shrinkage by listing various coef-
ficients to determine the shrinkage levels that can be expected.
Control of cracking by correct construction practices is
covered in Chapter 8.
Cracking can also be minimized by using expansive cements
to produce shrinkage-compensating concrete. This is discussed
in Section 3.6.
3.5.1 Reduction of cracking tendency—Most measures
that can be taken to reduce concrete shrinkage will also reduce
the cracking tendency. Drying shrinkage can be reduced by
using less water in the mixture and the largest practical
maximum-size aggregate. A lower water content can be
achieved by using a well-graded aggregate, stiffer consistency,
and lower initial temperature of the concrete.
Concrete can withstand higher tensile strains if the stress
is slowly applied; therefore, it is desirable to prevent rapid
drying of concrete. Prevention of rapid drying can be attained
by using curing compounds, even after water curing.
3.5.2 Reinforcement—Properly placed reinforcement,
used in adequate amounts, will reduce the number and
widths of cracks, reducing unsightly cracking. By distribut-
ing the shrinkage strains along the reinforcement through
bond stresses, the cracks are distributed so that a larger num-
ber of narrow cracks occur instead of a few wide cracks.
Although the use of reinforcement to control cracking in
a relatively thin concrete section is practical, it is not needed
in massive structures, such as dams, due to the low drying
shrinkage of these mass concrete structures. The minimum
amount and spacing of reinforcement to be used in structural
floors, roof slabs, and walls for control of temperature and
shrinkage cracking is given in ACI 318 or in ACI 350R. The
minimum-reinforcement percentage, which is between 0.18
and 0.20%, does not normally control cracks to within gen-
erally acceptable design limits. To control cracks to a more
acceptable level, the percentage requirement needs to exceed
about 0.60%.
3.5.3 Joints—The use of joints is the an effective method
of preventing the formation of unsightly cracking. If a
sizeable length or expanse of concrete, such as walls,
slabs, or pavements, is not provided with adequate joints to
accommodate shrinkage, the concrete will make its own
joints by cracking.
Contraction joints in walls are made, for example, by
fastening wood or rubber strips to the form, which leave
narrow vertical grooves in the concrete on both faces of the
wall. Cracking of the wall due to shrinkage should occur at
the grooves, relieving the stress in the wall and preventing
the formation of unsightly cracks between the joints. These
grooves should be sealed to prevent moisture penetration.
Fig. 3.10—Basic concept of shrinkage-compensating concrete.
Fig. 3.11—Length-change characteristics for shrinkage-
compensating and portland cement concrete (relative
humidity = 50%).
CONTROL OF CRACKING IN CONCRETE STRUCTURES 224R-17
Sawed joints are commonly used in pavements and slabs-on-
grade. Joint location depends on the particulars of place-
ment. Each element should be studied individually to deter-
mine where the joints should be placed. ACI 224.3R
discusses the use of joints in concrete construction. Guidance
on joint sealants and contraction joint location in slabs is avail-
able in ACI 504R and ACI 302.1R.
3.6—Shrinkage-compensating concrete
Shrinkage-compensating concrete made with expansive
cements can be used to minimize or eliminate shrinkage
cracking. The properties and use of expansive cement con-
crete are summarized in ACI 223, ACI 223 (1970), ACI SP-
38, and ACI SP-64. Of the several expansive cements pro-
duced in the past, Type K shrinkage-compensating cement
(ASTM C 845) is currently the only one available in the
United States. Several component materials are available to
produce shrinkage-compensating concrete.
In reinforced shrinkage-compensating concrete, the expan-
sion of the cement paste during the first few days of hydration
will develop a low level of prestress, inducing tensile stresses in
the steel and compressive stresses in the concrete. The level of
compressive stresses developed in the shrinkage-compensating
concrete ranges from 0.2 to 0.7 MPa (25 to 100 psi). Normal
shrinkage occurs when water starts to evaporate from the
concrete. The contraction of the concrete will result in a
reduction or elimination of its precompression. The initial
expansion of the concrete reduces the magnitude of any
tensile stress that develops due to restrained shrinkage. This
basic concept of using expansive cement to produce a
shrinkage-compensating concrete is illustrated in Fig. 3.10.
To allow for adequate expansion, special details may be
needed at joints.
A typical length-change history of a shrinkage-compensating
concrete is compared to that of a portland cement concrete in
Fig. 3.11. The amount of reinforcing steel normally used in
reinforced concrete made with portland cements is usually more
than adequate to provide the elastic restraint needed for
shrinkage-compensating concrete. To take full advantage
of the expansive potential of shrinkage-compensating concrete
in minimizing or preventing shrinkage cracking of exposed
concrete surfaces, it is important that positive and uninterrupted
water curing (wet covering or ponding) be started immediately
after final finishing. For slabs on well-saturated subgrades,
curing by sprayed-on membranes or moisture-proof covers
has been successfully used. Inadequate curing of shrinkage-
compensating concrete can result in an insufficient expansion
to elongate the steel and subsequent cracking from drying
shrinkage. Specific recommendations and information on
the use of shrinkage-compensating concrete are contained
in ACI 223R.
CHAPTER 4—CONTROL OF CRACKING IN
FLEXURAL MEMBERS
4.1—Introduction
The control of cracking can be as important as the control
of deflection in flexural members. Cracking in the tension
zone of a reinforced beam starts at stress levels as low as
20 MPa (3000 psi) in the reinforcement. Crack control is
also important to aesthetics of exposed concrete surfaces.
The role of cracks in the corrosion of reinforcing steel is
controversial (ACI 222R). One viewpoint is that cracks re-
duce the service life of structures by permitting more rapid
penetration of carbonation and allow chloride ions, moisture,
and oxygen to reach the reinforcing steel. Another point of
view is that while cracks accelerate the onset of corrosion,
the corrosion is localized. With time, chlorides and water
penetrate uncracked concrete and initiate more widespread
corrosion. Consequently, after a few years of service, there
is little difference between the amount of corrosion in
cracked and uncracked concrete. More important parameters
for corrosion protection are concrete cover and concrete quality.
This chapter is concerned primarily with cracks caused by
flexural and tensile stresses, but temperature, shrinkage,
shear, and torsion can also lead to cracking. Cracking in certain
specialized structures, such as reinforced concrete tanks, bins,
silos, and environmental structures is not covered in this re-
port. Cracking of concrete in these structures is described by
Yerlici (1975), and in ACI 313 and ACI 350R.
Extensive research studies on the cracking behavior of
beams have been conducted over the last 50 years. Most of
the work conducted before 1970 was reviewed by ACI
Committee 224 (1971) in ACI Bibliography No. 9. Additional
work is referenced in this chapter. Leonhardt (1977 and 1988)
presents an extensive review of cracking in reinforced- and
prestressed-concrete structures. The CEB-FIP Model Code for
Concrete Structures (1990) gives the European approach to
crack width evaluation and permissible crack widths.
The basis for codes of practice, both in the U.S. and Europe,
to limit service-load cracking is rooted in equations to predict
crack widths. Several of the most important crack-prediction
equations are reviewed in this report. The trend in reinforced-
and prestressed concrete design to ensure acceptable cracking
at service loads is to provide proper detailing, such as provi-
sion of minimum reinforcement and proper selection of bar
diameters, bar spacing, and reduction of restraint rather than
trying to make use of a sophisticated crack calculation
(Schlaich, Schafer, and Jennewien 1987; Halvorsen 1987).
Fiber-reinforced polymer (FRP) bars have been used as a
reinforcing material (Nawy and Neuwerth 1977, Dolan
1990). Experience is limited, however, and crack control in
structures reinforced with these materials is not addressed in
this report.
4.2—Crack-control equations for reinforced
concrete beams
A number of equations have been proposed for predicting
crack widths in flexural members; most of them were re-
viewed in the original version of this committee report (ACI
Committee 224 1972) and in key publications listed in the
references. Crack control is provided by calculating the
probable crack width and proportioning structural elements
so that the computed width is less than some predefined value.
Most equations predict the probable maximum crack width,
which usually means that about 90% of the crack widths in
224R-18 ACI COMMITTEE REPORT
the member are below the calculated value. Research, how-
ever, has shown that isolated cracks in beams in excess of
twice the computed maximum can occur (Holmberg and
Lindgren 1970) although generally, the coefficient of varia-
tion of crack width is about 40% (Leonhardt 1977). There is
evidence that this range in crack width variability can increase
with the size of the member (ACI Committee 224 1972).
Crack-control equations are presented in the sections that
follow.
4.2.1 ACI approach through ACI 318-95—Requirements
for flexural crack control in beams and thick one-way slabs
(span-depth ratio in the range of 15 to 20) are based on the
statistical analysis (Gergely and Lutz 1968) of maximum
crack-width data from a number of sources. Based on the
analysis, the following general conclusions were reached:
• The reinforcing steel stress is the most important variable;
• The thickness of the concrete cover is an important
variable but not the only geometric consideration;
• The area of concrete surrounding each reinforcing bar
is also an important geometric variable;
• The bar diameter is not a major variable; and
• The ratio of crack width at the surface to that at the
reinforcement level is proportional to the ratio of the
nominal strain at the surface and the reinforcement
strain.
The equations that were considered to best predict the
probable maximum bottom and side crack widths are
(4-1a)
(4-1b)
where
w
b
= most probable maximum crack width at bottom of
beam, in.;
w
s
= most probable maximum crack width at level of
reinforcement, in.;
f
s
= reinforcing steel stress, ksi;
A = area of concrete symmetric with reinforcing steel
divided by number of bars, in.
2
;
t
b
= bottom cover to center of bar, in.;
t
s
= side cover to center of bar, in.;
β = ratio of distance between neutral axis and tension
face to distance between neutral axis and reinforc-
ing steel about 1.20 in beams; and
h
1
= distance from neutral axis to the reinforcing steel,
in.
Simplification of Eq. (4-1a) yielded the following equation
(4-2a)
where
w = most probable maximum crack width, in.; and
w
b
0.091
t
b
A
3
β f
s
5
–
()10×
3–
=
w
s
0.091t
b
A
3
1 t
s
h
1
⁄+
f
s
5–()10
3–
×=
w 0.076
βf
s
d
c
A
3
10×
3–
=
d
c
= thickness of cover from the extreme tension fiber to
the closest bar, in.
When the strain
ε
s
in the steel reinforcement is used instead
of stress f
s
, Eq. (4-2) becomes
(4-2b)
Eq. (4-3) is valid in any system of units.
The cracking behavior in thick one-way slabs (span-depth
ratio 15 to 20) is similar to that in shallow beams. For one-
way slabs with a clear concrete cover in excess of 25.4 mm
(1 in.), Eq. (4-2) can be properly applied if
β = 1.25 to 1.35
is used.
ACI 318-95 Section 10.6 uses Eq. (4-2) with
β = 1.2 in the
following form
(4-3)
and permits the calculation of z with f
s
equal to 60% of the
specified yield strength f
y
in lieu of exact calculation.
In ACI 318-95 and earlier code versions, the maximum al-
lowable z = 175 kips per in. for interior exposure corre-
sponds to a probable crack width of 0.41 mm (0.016 in.).
This level of crack width may be excessive for aesthetic
concerns.
ACI 318 has allowed a value of z = 145 kips per in. for ex-
terior exposure based on a crack width value of 0.33 mm
(0.013 in.). While application of Eq. (4-2a) ((Eq. 10-4) of
ACI 318-95) to beams gives adequate crack-control values,
its application to one-way slabs with standard 20 mm (3/4 in.)
cover and reinforced with steel of 60 ksi (400 MPa) or lower
yield strength results in large reinforcement spacings. The
provisions of Section 7.6.5 of ACI 318-95, however, directly
limit the spacing of such reinforcement in one-way slabs.
ACI 340R contains design aids for the application of
Eq. (4-3).
4.2.2 ACI 318-99 approach—ACI Committee 318 now
believes that it can be misleading to purport to effectively
calculate crack widths, given the inherent variability in
cracking. The three important parameters in flexural crack-
ing are steel stress, cover, and bar spacing. Steel stress is the
most important parameter.
A reevaluation of cracking data (Frosch 1999) provided a
new equation based on the physical phenomenon for the
determination of the flexural crack widths of reinforced
concrete members. This study showed that previous crack
width equations are valid for a relatively narrow range of
covers (up to 63 mm [2.5 in.]).
ACI 318-99, Section 10.6, does not make a distinction
between interior and exterior exposure. It requires that for
crack control in beams and one-way slabs, the spacing of
reinforcement closest to a surface in tension shall not exceed
that given by
(4-4a)
w 2.2
βε
s
d
c
A
3
=
zf
s
d
c
A
3
=
s in.
()
540f
s
⁄
()
2.5c
c
–
[]
=
CONTROL OF CRACKING IN CONCRETE STRUCTURES 224R-19
but not greater than 12(36/f
s
) or 12 in., where
f
s
= calculated stress in reinforcement at service load
(ksi) = unfactored moment divided by the product
of steel area and internal moment arm. Alternatively,
f
s
can be taken as 0.60;
c
c
= clear cover from the nearest surface in tension to the
flexural tension reinforcement, in.; and
s = center-to-center spacing of flexural tension reinforce-
ment nearest to the surface of the extreme tension
face, in.
The SI expression for the reinforcement spacing in Eq. (4-4a)
(f
s
in MPa) is
(4-4b)
but not to exceed 300(252/f
s
) mm.
4.2.3 CEB-FIP and Eurocode EC2 recommendations—
Other organizations around the world have developed proce-
dures for predicting crack widths in structural concrete rang-
ing from conventionally reinforced through partially and
fully prestressed. ACI 318 procedures only deal with con-
ventionally reinforced concrete. Crack-control recommen-
dations proposed in the European Model Code for Concrete
Structures (CEB-FIP 1990; Euro EC2 1997) apply to pre-
stressed as well as reinforced concrete with modifications
and can be summarized in the following sections.
4.2.3.1 CEB-FIP 1990 provisions—The characteristic
crack width w
k
in beams is expressed as follows in terms of
the length l
s,max
over which slip occurs between the steel
reinforcement and the concrete (approximating crack
spacing in stabilized cracking)
(4-5)
where
ε
sm
= average reinforcement strain within segment length,
l
s,max
;
ε
cm
= average concrete strain within segment length, l
s,max
;
and
ε
cs
= strain of concrete due to shrinkage.
The characteristic crack width w
k
cannot exceed the limit-
ing crack with w
lim
, namely
y
f
s mm
()
95000
,540
f
s
⁄
()
2.5c
c
–
[]
=
w
k
l
smax,
ε
sm
ε
cm
–
ε
cs
–
()
=
(4-6)
where w
lim
= nominal limit value of the crack width speci-
fied for cases with expected functional consequences of
cracking (such as conditions stipulated in Table 4.1). In the
absence of specific requirements, such as water tightness or
specific exposure classes as tabulated in the CEB Code, a
limiting value of w
lim
equal to 0.30 mm (0.012 in.) is satis-
factory with respect to appearance and ductility.
The length l
s,max
in Eq. (4-5) can be defined as
(4-7a)
where
σ
s2
= reinforcement stress at the crack location, MPa;
σ
s1
= reinforcement stress at point of zero slip, MPa;
φ
s
= reinforcing bar diameter or equivalent diameter of
bundled bars, mm;
τ
bk
= lower fractile value of the average bond stress, MPa
= 1.8 f
ctm(t)
; and
f
ctm(t)
= the mean value of the concrete tensile strength at
the time that the crack forms.
For stabilized cracking, the expression can be simplified
as follows
(4-7b)
For single-crack formation, Eq. (4-6) is expressed as
(4-8)
The term can be assumed equal to 1.0 for simple calculation,
n being the modular ratio E
s
/E
c
, where
ρ
s,ef
= effective reinforcement ratio, A
s
/A
c,ef
;
A
s
= area of tension reinforcement, mm
2
; and
A
c,ef
= effective concrete area in tension, mm
2
.
The effective area of concrete in tension can be calculated
as
(4-9)
where
b = beam width at the tension side;
h = total section depth; and
d = effective depth to the centroid of the tensile reinforce-
ment.
For stabilized cracking, the average width of the crack can
be estimated on the basis of the average crack spacing such
that
(4-10)
w
k
w
lim
≤
l
smax,
2
σ
s2
σ
s1
–
()
4τ
bk
()
φ
s
⋅⋅
=
l
smax,
φ
s
3.6
ρ
sef,
=
l
smax,
σ
s2
φ
s
2τ
bk
1
n
ρ
sef,
+
()
=
A
c,ef
b
2.5
hd
–
()
[]
=
S
rm
2
3
l
s,max
=
*
It should be expected that a portion of the cracks in the structure will exceed these
values. With time, a significant portion can exceed these values. These are general
guidelines for design to be used in conjunction with sound engineering judgement.
†
Exclusing nonpressure pipes.
Table 4.1—Guide to reasonable* crack widths,
reinforced concrete under service loads
Exposure condition
Crack width
in. mm
Dry air or protective membrane 0.016 0.41
Humidity, moist air, soil 0.012 0.30
Deicing chemicals 0.007 0.18
Seawater and seawater spray, wetting and drying 0.006 0.15
Water-retaining structures
†
0.004 0.10
224R-20 ACI COMMITTEE REPORT
where S
rm
is the mean crack spacing value (mm) in the beam.
4.2.3.2 Eurocode EC2 provisions—The Eurocode
EC2 requires that cracking should be limited to a level
that does not impair the proper functioning of the structure
or cause its appearance to be unacceptable (Euro EC2 1997;
Beckett and Alexandrou 1997; Nawy 2001). It limits the
maximum design crack width to 0.30 mm (0.012 in.) for sus-
tained load under normal environmental conditions. This
ceiling is expected to be satisfactory with respect to ap-
pearance and durability. Stricter requirements are stipulated
for more severe environmental conditions.
The code stipulates that the design crack width be evaluated
from the following expression
(4-11)
where
w
k
= design crack width;
s
rm
= average stabilized crack spacing;
ε
sm
= mean strain under relevant combination of loads
and allowing for the effect such as tension stiffen-
ing or shrinkage; and
β = coefficient relating the average crack width to the
design value
= 1.7 for load-induced cracking and for restraint
cracking in sections with minimum dimension in
excess of 800 mm (32 in.).
The strain
ε
sm
in the section is obtained from the following
expression:
(4-12)
where
w
k
β
s
rm
ε
sm
=
ε
sm
σ
s
E
s
⁄ 1 β
1
β
2
σ
sr
σ
s
⁄
()
2
–
[]
=
σ
s
= stress in the tension reinforcement computed on the
basis of a cracked section, MPa;
σ
sr
= stress in the tension reinforcement computed on the
basis of a cracked section under loading conditions
that cause the first crack, MPa;
β
1
= coefficient accounting for bar bond characteristics
= 1.0 for deformed bars and 0.5 for plain bars;
β
2
= coefficient accounting for load duration
= 1.0 for single short-term loading and 0.5 for sus-
tained or cyclic loading; and
E
s
= Modulus of elasticity of the reinforcement, MPa.
The average stabilized mean crack spacing s
rm
is evaluat-
ed from the following expression
(4-13)
where
d
b
= bar diameter, mm;
ρ
t
= effective reinforcement ratio = A
s
/ A
ct
; the effective
concrete area in tension A
ct
is generally the concrete
area surrounding the tension reinforcement of depth
equal to 2.5 times the distance from the tensile face
of the concrete section to the centroid of the reinforce-
ment. For slabs where the depth of the tension zone
may be small, the height of the effective area should
not be taken greater than [(c – d
b
)/ 3], where c = clear
cover to the reinforcement, mm;
k
1
= 0.8 for deformed bars and 1.6 for plain bars; and
k
2
= 0.5 for bending and 1.0 for pure tension.
In cases of eccentric tension or for local areas, an average
value of k
2
= (ε
1
+ ε
2
) / 2ε
1
can be used, where ε
1
is the
greater and
ε
2
the lesser tensile strain at the section bound-
aries, determined on the basis of cracked section.
In the absence of rigorous computations as described thus
far, choice of minimum area of reinforcement A
s
for crack
control is stipulated such that
(4-14)
where
A
s
= reinforcement area within the tensile zone, mm;
A
ct
= effective area of concrete in tension, mm;
σ
s
= maximum stress permitted in the reinforcement af-
ter the formation of the crack. The yield strength
may be taken in lieu of
σ
s
, although lower values
may be needed to satisfy crack width limits;
f
ct,eff
= tensile strength of the concrete effective at the for-
mation of the first crack. A value of 3 MPa (435 psi)
can be used;
k
c
= coefficient representing the nature of stress distri-
bution,
= 1.0 for direct tension and 0.4 for bending; and
k = coefficient accounting for nonuniform stresses due
to restraint resulting from intrinsic or extrinsic
deformation. It varies between 0.5 and 1.0 (N/ mm
2
=
1 MPa).
s
rm
500.25
k
1
k
2
d
b
ρ
t
⁄
, mm
+=
A
s
k
c
kf
cteff
,
A
ct
σ
s
⁄
=
Table 4.2—Maximum bar diameter for high bond bars
Steel stress, MPa Maximum bar size, mm
160 32
200 25
240 20
280 16
320 12
360 10
400 8
450 6
Table 4.3—Maximum bar spacing for high bond bars
Steel stress, MPa
Maximum bar spacing, mm
Pure flexure Pure tension
160 300 200
200 250 150
240 200 125
280 150 75
320 100 —
360 50 —
CONTROL OF CRACKING IN CONCRETE STRUCTURES 224R-21
The EC2 Code also stipulates that for cracks dominantly
caused principally by flexure, their widths will not usual-
ly exceed the standard 0.30 mm (0.012 in.) if the size and
spacing of the reinforcing bars are within the range of values
in Tables 4.2 and 4.3 for bar size and spacing (Euro EC2
1997; Beckett and Alexandrou 1997; Nawy 2001). For severe
exposure conditions, such as those listed in Table 4.1, crack
width computations become mandatory.
4.3—Crack control in two-way slabs and plates
Crack-control equations for beams underestimate the
crack widths developed in two-way slabs and plates (Nawy
and Blair 1971) and do not indicate to the designer how to
space the reinforcement. The cracking widths in two-way
slabs and plates are controlled primarily by the steel stress
level and the spacing of the reinforcement in the two perpen-
dicular directions. In addition, the clear concrete cover in
two-way slabs and plates is nearly constant (20 mm [3/4 in.]
for most interior structural slabs), whereas it is a major vari-
able in the crack-control equations for beams.
Analysis of data on cracking in two-way slabs and plates
(Nawy and Blair 1971) has provided the following equation
for predicting the maximum crack width
(4-15)
where the terms inside the radical are collectively termed the
grid index:
k = fracture coefficient with a value k = 2.8
× 10
-5
for
uniformly loaded restrained two-way action square
slabs and plates. For concentrated loads or reactions
or when the ratio of short to long span is less than
0.75 but larger than 0.5, a value of k = 2.1
× 10
-5
is
applicable. For span aspect ratios less than 0.5, k =
1.6
× 10
-5
;
β = 1.25 (chosen to simplify calculations, although it
varies between 1.20 and 1.35);
f
s
= actual average service-load stress level or 40% of
the specified yield strength f
y
, ksi;
d
b1
= diameter of the reinforcement in Direction 1 closest
to the concrete outer fibers, in.;
s
1
= spacing of the reinforcement in Direction 1, in.;
s
2
= spacing of the reinforcement in perpendicular Di-
rection 2, in.;
ρ
t1
= active steel ratio, that is, the area of steel A
s
per ft
width/ [12d
b1
+ 2c
1
], where c
1
is clear concrete cover
measured from the tensile face of concrete to the
nearest edge of the reinforcing bar in Direction 1;
and
w = crack width at face of concrete caused by flexure, in.
Direction 1 refers to the direction of reinforcement closest to
the outer concrete fibers; this is the direction for which
crack-control check should be made. Subscripts 1 and 2 per-
tain to the directions of reinforcement.
For simply supported slabs, the value of k should be mul-
tiplied by 1.5. Interpolated k values apply for partial restraint
at the boundaries. For zones of flat plates where transverse
steel is not used or when its spacing s
2
exceeds 305 mm (12 in.),
use s
2
= 305 mm (12 in.) in the equation.
If strain is used instead of stress, Eq. (4-15) becomes
(4-16)
where values of k
1
= 29 × 10
3
times the k values previously
listed. Nawy (1972) and ACI 340.1R contain design aids for
applying these recommendations.
Tam and Scanlon (1986) present a model for determining
deflection of two-way slabs subjected to transverse loads.
Their model accounts for the net effect on deflection of both
restraint cracking and flexural cracking.
4.4—Tolerable crack widths versus exposure
conditions in reinforced concrete
Table 4.1 presents a general guide for what could be
considered reasonable crack widths at the tensile face of
reinforced concrete structures for typical conditions.
These reasonable crack width values are intended to serve
only as a guide for proportioning reinforcement during
design. They are to be used as a general guideline along
with sound engineering judgment.
The table is based primarily on Nawy (1968), who com-
piled information from several sources. It is important to
note that these crack width values are not always a reliable
indication of the corrosion and deterioration to be expected.
In particular, a larger cover, even if it leads to a larger surface
crack width, may be preferable for corrosion control in cer-
tain environments; therefore, the designer should exercise
engineering judgment on the extent of crack control to be
used. When used in conjunction with the recommendations
presented in Sections 4.2.1 and 4.2.3 to limit crack width, it
should be expected that a portion of the cracks in the struc-
ture would exceed these values by a significant amount. It is
also noted that time effects, such as creep, will cause an in-
crease in crack widths that should be taken into account by
the designer.
Another opinion regarding crack control suggests that in
the long term there is no link between the level of flexural
cracking and corrosion (Beeby 1983). This suggests that in-
dependent of exposure conditions, the acceptable level of
cracking is primarily an aesthetic issue. Therefore, in cases
such as liquid-containing structures where the presence of
moisture is constant or leakage is of concern should more
restrictive (smaller) crack widths be required. Based on
information in Halvorsen (1987), a case could be made that
crack widths ranging from 0.15 to 0.3 mm (0.006 to 0.012 in.)
could be considered unacceptable for aesthetic reasons as they
are visible to the naked eye, hence generating a sense of
insecurity or structural failure.
wk
βf
s
I=
I
d
b1
s
2
ρ
t
1
s
1
s
2
d
c
d
b1
8
π
==
wk
1
βε I=
224R-22 ACI COMMITTEE REPORT
4.5—Flexural cracking in prestressed concrete
Partially prestressed members, in which cracks can appear
under working loads, are used extensively. Cracks form in
these members when the tensile stress exceeds the modulus
of rupture of the concrete (6 to 9 psi under short-term
conditions). The control of these cracks is necessary prima-
rily for aesthetic reasons, as they are visible to the naked eye,
hence generating a sense of structural insecurity. The resid-
ual crack width, after removal of the major portion of the live
load, is small (about 0.03 to 0.09 mm [0.001 in. to 0.003 in.])
and therefore, crack control is usually not necessary if the
live load is transient.
There have been studies concerning the calculation of
crack widths in prestressed concrete members (Meier and
Gergely 1981; Suzuki and Yoshiteru 1984; Suri and Dilger
1986; Nawy 1989a). The complexity of the crack width cal-
culations is increased over reinforced concrete members by
the number of variables that should be considered.
4.5.1 Crack-prediction equations—One approach to
crack prediction for bonded prestressed beams has two
steps. First, the decompression moment is calculated, at
which the stress in the concrete at the prestressing steel level
is zero. Then the member is treated as a reinforced concrete
member and the increase in stress in the steel is calculated
for the additional loading. The expressions given for crack
prediction in nonprestressed beams can be used to estimate
the cracks for the load increase above the decompression
moment. A multiplication factor of about 1.5 is needed
when strands, rather than deformed bars, are used nearest to
the beam surface in the prestressed member to account for
the differences in bond properties. This approach is compli-
cated if most of the parameters affecting cracking are con-
sidered (Nilson 1987). An approximate method using the
nominal-concrete-stress approach was presented by Meier
and Gergely (1982). They proposed the following equations
for prediction of maximum flexural crack width
(4-17)
(4-18)
where
C
1
, C
2
= bond coefficients that depend on the type of steel
nearest the tension face;
f
ct
= nominal tensile stress at the tensile face;
E
c
= modulus of elasticity of concrete;
d
c
= minimum concrete cover to centroid of steel at the
tensile face; and
A = effective concrete area per bar as defined in ACI
318.
Equation (4-17) is dimensionally correct and the coeffi-
cient C
1
is dimensionless. In in lb units, C
1
= 12 and C
2
= 8.4
for reinforcing bars, and C
1
= 16 and C
2
= 12 for strands. In SI
units, if A is specified in mm
2
, C
1
= 1.39 and C
2
= 0.97 for
reinforcing bars, and C
1
= 1.85 and C
2
= 1.39 for strands.
Equation (4-17) had better application for most data exam-
ined; however, Eq. (4-18) shows better accuracy for wide
beams with large spacing. These equations predict the average
of the maximum crack widths. The scatter is considerable.
The maximum crack width (in in.) at the steel-reinforcement
level closest to the tensile face of the concrete, accounting for
the stress in the reinforcement in pretensioned and post-
tensioned, fully and partially prestressed members can be
evaluated from the following simplified expressions (Nawy
and Huang 1977; Nawy 1989a):
Pretensioned beams
(4-19)
Post-tensioned unbonded beams
(4-20)
The maximum crack width at the tensile face of the con-
crete can be obtained by multiplying the values obtained
from Eq. (4-19) and (4-20) by a factor R
i
where
R
i
= ratio h
2
/ h
1
;
h
1
= distance from the neutral axis to the centroid of the
reinforcement, in.;
h
2
= distance from the neutral axis to the concrete tensile
face;
∆f
s
= the net stress in the prestressed tendon or the mag-
nitude of the tensile stress in the conventional rein-
forcement at any load level in which the
decompression load (decompression here means f
c
= 0
at the level of the reinforcing steel) is taken as the
reference point, ksi = (f
nt
– f
d
)
f
nt
= stress in the prestressing steel at any load beyond
the decompression load, ksi;
f
d
= stress in the prestressing steel corresponding to the
decompression load, ksi;
∑
O
= sum of reinforcing elements’ circumferences, in.;
and
A
t
= the effective concrete area in uniform tension, in.
2
,
as defined by ACI 318.
Recent work by Nawy on cracking in high strength pre-
stressed beams of compressive strength in excess of 85
MPa (12,000 psi), showed that the factor in Eq. (4.19), (4.20)
becomes 2.75
× 10
–5
in U.S. customary units and 4.0 × 10
–5
in SI units (Nawy, 2000).
The CEB Model Code has the same equation for predicting
the crack width in prestressed members as in nonprestressed
members (Section 4.2.2). The increase in steel strain is calcu-
lated from the decompression stage. Other equations have
been proposed (Abeles 1956; Bennett and Dave 1969; Holm-
berg and Lindgren 1970; Rao, Gandotra, and Ramazwamy
1976; Bate 1958; Bennett and Chandrasekhar 1971; Hutton
and Loov 1966; Krishna, Basavarajuiah, and Ahamed 1973;
Stevens 1969; Suri and Dilger 1986; Suzuki and Yoshiteru
1984; Harajli and Naaman 1989).
f
c
′
w
max
C
1
f
ct
E
c
d
c
=
w
max
C
2
f
ct
E
c
d
c
A
3
=
w
max
5.8510
5–
×
A
t
Σ
O
∆f
s
()
=
w
max
6.5110
5–
×
A
t
Σ
O
∆f
s
()
=
f
c
′
CONTROL OF CRACKING IN CONCRETE STRUCTURES 224R-23
Aalami and Barth (1989) discuss the mitigation of restraint
cracking in buildings constructed with unbonded tendons.
Nonprestressed deformed bars can be used to reduce the
width of the cracks to acceptable levels.
4.5.2 Crack widths—Some authors state that corrosion is a
greater problem in prestressed-concrete members because of
the smaller area of steel used and because of the possible conse-
quences of corrosion on highly stressed steel. Research (Beeby
1978a, 1978b) indicates that there is no general relationship
between cracking and corrosion in most circumstances. Poston,
Carrasquillo, and Breen (1987), however, cites contradictory
laboratory test results on prestressed and nonprestressed
exposure specimens in which chloride-ion concentration at
the level of reinforcement due to penetration of chlorides from
external sources was proportional to crack width. Poston and
Schupack (1990), present results from a field investigation of
pretensioned beams in an aggressive chloride environment in
which brittle wire failure of a seven-wire strand occurred at a
flexural crack, apparently due to corrosion with significant
pitting observed on the other wires at the crack location. The
surface crack widths were 0.13 mm (0.005 in.) or less. The
prestressing strand was generally bright on either side of its
crack with no significant sign of corrosion distress.
As discussed by Halvorsen (1987), provisions for sur-
face crack-width control as a means of protecting against
corrosion should be strongly tied to provisions for high-
quality concrete and plenty of cover. The importance of
having high-quality (low w/cm) concrete with sufficient
cover to provide long-term protection of steel elements,
both prestressed and nonprestressed, cannot be overem-
phasized. The design should provide more stringent crack
control than reinforcement spacing stipulated in ACI 318,
for prestressed-concrete members, and particularly those
subjected to aggressive environments, by providing addi-
tional mild steel reinforcement, reducing the allowable
extreme fiber tension stresses under service loads to a val-
ue below psi, perhaps as low as psi, or both,
and to minimize the potential for flexural cracking.
4.6—Anchorage-zone cracking in prestressed
concrete
Longitudinal cracks frequently occur in the anchorage
zones of prestressed concrete members due to transverse ten-
sile stresses set up by the concentrated forces (Gergely 1969;
Zielinski and Rowe 1960; Stone and Breen 1984a). Such
cracks can lead to (or in certain cases are equivalent to) the
failure of the member. Transverse reinforcement (stirrups),
active reinforcement in the form of lateral prestressing, or
both, should be designed to restrict these cracks.
Two types of cracks can develop: spalling cracks that begin
at top and bottom beam ends outside the end anchorage zones
and propagate parallel to the prestressing force, and bursting
cracks that develop along the line of the force or forces but
away from the end face.
For many years, stirrups were designed to take the entire
calculated tensile force based on the analysis of the uncracked
section. Classical and finite-element analyses (Stone and
Breen 1984a; Nawy 1989b) show similar stress distributions
for which the stirrups are to be provided. Because experi-
mental evidence shows that higher stresses can result than
those indicated by these analyses (Zielinski and Rowe 1960),
and because the consequences of under-reinforcement can be
serious, it is advisable to provide more steel than required
by this type of analysis. More recently, designs have been
based on cracked section analyses. A design procedure for
post-tensioned members using a cracked section analysis
(Gergely and Sozen 1967) has found acceptance with many
designers. For pretensioned members, an empirical equation
has proven to be quite useful (Marshall and Mattock 1962).
Stone and Breen (1984b) present a design procedure for
post-tensioned beam anchorage zones. A general equation is
given for predicting the cracking load in beams without sup-
plemental anchorage zone reinforcement along with provi-
sions for designing supplementary reinforcement and
calculating the effect it will have on cracking and ultimate
load.
Design recommendations for controlling cracking in an-
chorage zones of flexural members with closely spaced an-
chors, such as in slabs and bridge decks, are provided by
Burgess, Breen, and Poston (1989) and Sanders, Breen, and
Duncan (1987).
Spalling cracks form between anchorages and propa-
gate parallel to the prestressing forces and can cause grad-
ual failure, especially when the force acts near and
parallel to a free edge. Because analyses show that the
spalling stresses in an uncracked member occur primarily
near the end face, it is important to place the first stirrup
near the end surface and to distribute the stirrups over a
distance equal to at least the depth of the member to fully
account for both spalling and bursting stresses. In lieu of
normal orthogonal reinforcement to control cracking,
Stone and Breen (1984a, 1984b) showed the very benefi-
cial effect of using spiral reinforcement or active rein-
forcement in the form of transverse prestressing to control
cracking in anchorage zones where the prestressing forces
are large.
4.7—Crack control in deep beams
Major changes in reinforced concrete design in the
past two decades, namely the widespread adoption of
strength design, have resulted in some structures with
high service-load-reinforcement stresses. Several cases
have been reported (Frantz and Breen 1980a, 1980b)
where wide cracks have developed on the side faces of
beams between main flexural reinforcement and the neutral
axis. Although the measured crack widths at the main rein-
forcement level were within acceptable code limits, the side-
face crack widths near middepth were as much as three
times as wide.
Based on an experimental and analytical investigation of
cracking in deep beams (in the sense of separation of tension
and compression force resultants, not span-depth ratio),
Frantz and Breen developed recommendations for side-face
crack control in beams in which the depth d exceeds 915 mm
(36 in.). Modifications of these recommendations have been
included in ACI 318 since 1989. Section 10.6.7 of ACI 318
6 f
c
′ 2 f
c
′
224R-24 ACI COMMITTEE REPORT
requires skin reinforcement to be uniformly distributed
along both faces of the member for a distance d/2 nearest the
flexural tension reinforcement.
4.8—Tension cracking
The cracking behavior of reinforced concrete mem-
bers in axial tension is similar to that of flexural mem-
bers, except that the maximum crack width is larger than
that predicted by the expressions for flexural members
(Broms 1965a,b). The lack of strain gradient and result-
ant restraint imposed by the compression zone of flexur-
al members is probably the reason for the larger tensile
crack width.
Data are limited, but it appears that the maximum ten-
sile crack width can be about expressed in a form similar
to that used for flexural crack width
(4-21)
where crack width is measured in in.
A more complicated procedure for predicting crack width
in tension members has been developed that incorporates
both slip and bond stress (Yang and Chen 1988). Although
the crack width prediction equation appears to show good
agreement with available test data, the procedure is too com-
plicated for design purposes. A similar approach was also
developed for predicting crack widths in concrete tension
members reinforced with welded-wire fabric (Lee et al.
1987). A more complete discussion of concrete cracking in di-
rect tension is provided in ACI 224.2R.
CHAPTER 5—LONG-TERM EFFECTS ON
CRACKING
5.1—Introduction
Cracking in concrete is affected by the long-term conditions
to which the concrete element is subjected. In most cases,
long-term exposure and long-term loading extend the magni-
tude of cracks, principally their width, in both reinforced and
plain concrete. The discussion in this chapter summarizes the
major long-term factors that affect the crack-control perfor-
mance of reinforced and prestressed concrete.
5.2—Effects of long-term loading
As discussed in Chapter 2, both sustained and cyclic load-
ing increase the amount of microcracking. Microcracking
appears to be a function of the total strain and is largely in-
dependent of the method by which the strain is induced.
Microcracks formed at service load levels do not seem to
have a great effect on the strength or serviceability of rein-
forced and prestressed concrete.
The effect of sustained or repetitive loading on macro-
scopic cracking, however, can be an important consideration
in the serviceability of reinforced concrete members, espe-
cially in terms of corrosion of reinforcing steel and appear-
ance. The increase in crack width due to long-term or
repetitive loading can vary between 100 and 200% over sev-
eral years (Bate 1963; Brendel and Ruhle 1964; Lutz, Shar-
ma and Gergely 1968; Abeles, Brown, and Morrow 1968;
w 0.10
f
s
d
c
A
3
10
3–
×=
Bennett and Dave 1969; Holmberg and Lindgren 1970; Ill-
ston and Stevens 1972; Holmberg 1973). While there is a
large scatter in the data, information obtained from sustained
loading tests of up to 2 years (Illston and Stevens 1972) and
fatigue tests with up to 1 million cycles (Bennett and Dave
1969; Holmberg 1973; Rehm and Eligehausen 1977) indi-
cate that a doubling of crack width with time can be expected.
Under most conditions, the spacing of cracks does not change
with time at constant levels of stress (Abeles, Brown, and
Morrow 1968; Illston and Stevens 1972; Holmberg 1973).
An exception to this occurs at low loads or in beams with
high percentages of reinforcement, in which case the total
number and width of cracks increase substantially after the
loading has begun (Brendel and Ruhle 1964; Abeles, Brown,
and Morrow 1968; Holmberg 1973). The largest percent-
age increase in crack width is then expected in flexural
members subjected to low levels of load because the
cracks take more time to develop.
For both prestressed and reinforced concrete flexural
members, long-term loading and repetitive loading give
about the same crack widths and spacing (Rehm and Elige-
hausen 1977). The rate of crack width development, however,
is considerably faster under repetitive loading (Bennett and
Dave 1969; Holmberg 1973; Rehm and Eligehausen 1977;
Stevens 1969).
As discussed in Chapter 4, crack width is a function of
cover. For short-term static and fatigue loading, surface
crack width is approximately proportional to the steel strain
(Illston and Stevens 1972; Holmberg 1973; Stevens 1969).
Crack widths increase under sustained loading at a decreas-
ing rate. The rate of growth in crack width, however, is faster
than the average observed surface strain at the level of the
steel. For long-term loading, crack width is proportional
to the steel strain (including the effects of creep), plus the
strain induced in the concrete due to shrinkage (Illston
and Stevens 1972).
Under initial loads, cracks intercepting reinforcement are
restricted by the bond between the steel and the concrete (Ill-
ston and Stevens 1972; Broms 1965b), and the width of sur-
face cracks does not provide a good indication of the
exposure of the reinforcing steel to corrosive conditions.
Over a period of time, however, the adhesion bond between
the steel and the concrete undergoes breakdown. After about
2 years, the crack width at the reinforcement is approximate-
ly equal to the crack width at the surface (Illston and Stevens
1972). At this stage, cracks in flexural members are triangu-
lar in shape, increasing in width from the neutral axis to the
soffit and are approximately uniform across the width of the
beam.
5.3—Environmental effects
The long-term effects of an adverse environment in both
producing and in enlarging concrete cracks (Mather 1957,
1968) can be damaging to both concrete and reinforcement.
If concrete is not resistant to freezing and thawing when crit-
ically saturated, cracks will develop due to bursting effects
of the freezing water. The lack of such resistance can be due
to the following reasons: the use of resistant-resistant coarse
CONTROL OF CRACKING IN CONCRETE STRUCTURES 224R-25
aggregate, inadequate air-void system, or failure to protect
the concrete from freezing before curing. Critical saturation
in nonfrost-resistant concrete can occur by the presence of
preexisting cracks that allow entry of water. The initiation of
D-cracking near joints or other cracks in pavements is a good
example. In more extreme cases, it is not uncommon for
cracks caused either by thermal stress or shrinkage of the
richer topping mixture in the roadway deck of dams and nav-
igation locks to cause spalling due to the freezing of water in
the cracks themselves independent of the frost resistance of
the concrete. On the other hand, pre-existing cracks can also
function to allow concrete to dry below critical saturation be-
fore freezing when this might not occur in the absence of
such cracks. The role of cracks as they affect frost resistance
will vary with the environmental conditions, such as, typical
time of drying after wetting before freezing, crack width, and
ability of cracks to drain.
Concrete durability is better when the aggregate used is
durable under freezing and thawing conditions and the
strength of the concrete is appropriate (ACI 201.2R). Field
exposure tests of reinforced concrete beams (Roshore 1967)
subjected to freezing and thawing in an ocean-side environ-
ment indicate that the use of air-entrained concrete made the
beams more resistant to weathering than the use of non-air-
entrained concrete. Beams with modern deformed bars were
more durable than those using bars with old-style deforma-
tions. Maximum crack widths did not increase with time
when the steel stress was less than 30 ksi (210 MPa), but did
increase substantially (50 to 100%) over a 9-year period
when the steel stress was 30 ksi (210 MPa) or more.
5.4—Aggregate and other effects
Concrete can crack as the result of expansive reactions be-
tween aggregate and alkalis present in the cement hydration,
admixtures, or external sources, such as curing water,
groundwater, and alkaline solutions stored or used in the fin-
ished structure.
Possible solutions to these problems include limitations on
reactive constituents in the aggregate, limitations on the al-
kali content of cement, and the addition of a satisfactory poz-
zolanic material or a combination of these. The potential for
some expansive reactions, such as alkali-carbonate, is not re-
duced by pozzolanic admixtures. ACI 201.2R and Woods
(1968) give details on identification and evaluation of aggre-
gate reactivity. ACI 221.1R gives guidelines on the alkali-
aggregate reaction and selectivity process for mixture pro-
portioning and durability.
Based on ACI 201.2R, ACI 212.3R, ACI 222R, and
Mather (1957, 1968), the hazard of using calcium chloride,
which may initiate corrosion, warrants a recommendation
against its use when crack control is a major factor affecting
long-term performance and durability of a structural system.
Also, the use of calcium chloride in reinforced structures ex-
posed to moist environments should be avoided regardless of
the presence or absence of water-soluble salts in adjacent
waters and soil.
Detrimental conditions can also result from the application
of deicing salts to the surface of hardened concrete. Concrete
to be subjected to deicers or similar chemicals should be air
entrained and properly proportioned and cured to produce
low permeability.
5.5—Use of polymers in improving cracking
characteristics
Extensive work is available on the use of polymers in
modifying the characteristics of concrete (Brookhaven Na-
tional Laboratory 1968; ACI SP-40; ACI SP-58; ACI 548R).
Polymer-portland cement concretes have a large deforma-
tion capacity, high tensile and compressive strengths, and
negligible permeability. The tensile splitting strength can be
as high as 10.7 MPa (1550 psi) (Nawy, Ukadike, and Sauer
1977). Polymer impregnation, though rarely used today, is
another method of introducing beneficial polymer systems
into concrete. These materials are discussed in greater detail
in Chapter 6.
CHAPTER 6—CONTROL OF CRACKING IN
OVERLAYS
6.1—Introduction
An overlay can be constructed by placing mortar or con-
crete over a concrete surface. The use of overlays has rapidly
increased since the early 1970s. They are now commonly
used for rehabilitation of deteriorated bridge decks; strength-
ening or renovating pavements, warehouse floors, walkways
and other concrete flatwork; and in new two-course con-
struction.
Overlays can be divided into three groups. The first
group is when portland cement is used. These overlays
can be low-slump dense concrete (LSDC), polymer-mod-
ified concrete (also called latex-modified concrete
[LMC]), and fiber-reinforced concrete (FRC). These
overlays may also contain silica fume, fly ash, or granulat-
ed blast-furnace slag. The second group includes polymer
and epoxy mortars or concretes. The third group includes
polymer-impregnated concrete (PIC), which has not become
generally effective, economical, or practical. In a PIC sys-
tem, hardened concrete is impregnated with a low molecular
weight monomer that fills small cracks and voids to a shallow
depth (about 5 mm [1/4 in.]) beneath the surface. The mono-
mer is then polymerized and a relatively impervious surface
layer results.
If the base slab is relatively crack free, or if the overlay is
sufficiently thick and strong to resist the extension of cracks
in the original slab, a well-bonded layer with matched joints
is generally the best approach. If the overlay has sufficient
thickness, a totally unbonded overlay is generally best where
severe cracking is present or where it can later develop in the
base slab. Systems that are essentially unbonded have been
constructed satisfactorily where the overlay is placed over an
asphalt layer. The asphalt itself acts as a debonding layer if
it has a reasonably smooth surface without potholes. This
type of construction lends particularly well to deteriorated
airfield slabs that have been resurfaced with asphaltic con-
crete but require additional rigid pavement to take the in-
creased loads of heavy aircraft. Another technique that has
been used when the material to be overlaid is reasonably
smooth consists of placing the overlay over a polyethylene