defining and measuring robustness in wireless sensor communication for telemedicine
Bạn đang xem bản rút gọn của tài liệu. Xem và tải ngay bản đầy đủ của tài liệu tại đây (2.45 MB, 86 trang )
DEFINING AND MEASURING ROBUSTNESS IN WIRELESS SENSOR
COMMUNICATION FOR TELEMEDICINE
A Thesis
Presented to
The Graduate Faculty of The University of Akron
In Partial Fulfillment
of the Requirements for the Degree
Master of Science
Sudha Bhattarai
August, 2008
ii
DEFINING AND MEASURING ROBUSTNESS IN WIRELESS SENSOR
COMMUNICATION FOR TELEMEDICINE
Sudha Bhattarai
Thesis
Approved: Accepted:
_______________________________ _______________________________
Advisor Dean of the College
Dr. Kathy J. Liszka Dr. Ronald F. Levant
_______________________________ _______________________________
Faculty Reader Dean of the Graduate School
Dr. Timothy W. O'Neil Dr. George R. Newkome
_______________________________ _______________________________
Faculty Reader Date
Dr. Tim Marguish
_______________________________
Department Chair
Dr. Wolfgang Pelz
iii
ABSTRACT
Wireless sensor networks are useful in a wide range of applications. A network
used for a telemedicine application must be able to endure various noise factors present in
the system. Dropped packets during mote communication are an important parameter that
can be used to determine the robustness of the system. Robustness, in this context, is the
degree to which a system is insensitive to small perturbations.
We propose mote technology as a potential source for wireless communication of
medical signals in body area networks. In order to determine if the proposed system is
useful, a robustness metric is developed specifically for a telemedicine application. The
contribution of this research is to provide a framework so that with further research, we
can evaluate whether the mote hardware will deliver acceptable performance given
perturbations in a wireless environment.
iv
ACKNOWLEDGEMENTS
Thanks to Dr .Kathy Liszka for her immense support and direction in this project.
Special thanks to Malinda J. Server for her help in understanding medical terms. Thanks
to the committee member for their evaluation and comments on my work. I am also
indebted to Mike Ritcher for making his experience with this research available to me. I
would like to thank my husband Suraj Adhikari for his help in installation of motes.
v
TABLE OF CONTENTS
Page
LIST OF TABLES ………………………………………………………… …………viii
LIST OF FIGURES………………………………………………………………………ix
CHAPTER
I. INTRODUCTION…………………………………………………………………….1
1.1. Overview…………………………………………………………………… …1
1.2. Eldercare .……………………………………………………………………… 2
1.3. The Holy Grail ………………………………………………………………… 3
1.4. Wireless Issues ………………………………………………………………….4
II. ROBUSTNESS ……………………………………………………………………….6
2.1. Performance Features ………………………………………………………… 6
2.2. Perturbation Parameters …………………………………………………………9
2.3. Impact of Perturbation Parameters on Performance Features …………………10
2.4. Analysis to Determine Robustness …………………………………………….10
2.5. Robust Research.……………………………………………………………….11
III. SYSTEM DESCRIPTION………………………………………………………… 13
vi
3.1. Hardware Description and Terminology……………………………………….13
3.1.1. Motes ……………………………………………………….……… 14
3.1.2. Mica2Dot ……………………………………………………………14
3.1.3. Mica2 ……………………………………………………………… 15
3.1.4. MIB510 …………………………………………………………… 16
3.2. Software Description and Terminology ……………………………………….17
3.2.1. TinyOS………………………………………………… …… …….18
3.2.2. nesC …………………………………………………… ……… ….18
3.2.3. Oscilloscope ……………………………………… ……… ………19
3.2.4. Blink ………………………………………………… … …………20
3.2.5. Serial Forwarder ……………………………… ……… ………… 20
3.2.6. Packet Listener ………………………………… …………… ……21
3.2.7. TOSBase ……………………………………………………….……21
3.2.8. OscilloscopeRF …………………………………… ……… …… 23
IV. PHYSICAL EXPERIMENTS …… …………………………………………….24
4.1. Objectives and limitations of the experiments ………………… ……………24
4.2. Preliminary experiments ……………………………………… …………….25
4.3. Communication issues …………………………………………… …………27
4.4. Data collection ……………………………………………………… ……….29
vii
4.5. Discussion …………………………………………………………………… 37
V. CONCLUSION AND FUTURE WORK……… ……………………………….… 38
REFERENCES ………………………………………………………………………….40
APPENDICES …………………………………………………………… ……………42
APPENDIX A. USER MANUAL ………………………………………… ………… 43
APPENDIX B. SERIALFORWARDER ……………………………………… …….51
APPENDIX C. PACKETLISTENER ……………………………….……… …………55
APPENDIX D. TOSBASE ………………………………….………………… ………57
APPENDIX E. OSCILLOSCOPERF ……………………………………… ………….62
APPENDIX F. DATA TABLES …………………………………………… …………65
viii
LIST OF TABLES
Table Page
4.1 Mote tests of one hour at 90 feet ……………………………… ………………36
F.1 Mote 1 readings for 1 minute ……………………………………… ………… 66
F.2 Mote 2 readings for 1 minute ……………………………………… ………….68
F.3 Mote 4 readings for 1 minute …………………………………………… …… 69
F.4 Mote 5 readings for 1 minute …………………………………………… …… 71
F.5 Mote 1 readings for 5 minutes ………………………………………………… 73
F.6 Mote 2 readings for 5 minutes …………………………………… ………… 74
F.7 Mote 4 readings for 5 minutes ………………………………… ………………75
F.8 Mote 5 readings for 5 minutes …………………………………… ………… 76
F.9 Motes reading for an hour ……………………………………… …………… 77
ix
LIST OF FIGURES
Figure Page
1.1. A conceptual biosensor shirt with sensors exposed on the outside for
illustration …………………………………………………………….…………….4
3.1. Mica2Dot Motes …………………………………………………………….…….15
3.2. Mica2 mote ……………………………………………………………….……….15
3.3. MIB510 Hardware ………………………………………….…………………… 17
3.4. Block Diagram of the MIB510 …………………………………….…………… 17
3.5 Oscilloscope GUI to represent the graphical view of motes
communication …………………………………………………………………….19
3.6 SerialForwarder reading the packet information ………….………………………20
3.7 Mote data from listen.java ………………………………………….…………… 22
4.1 One minute trials for four motes at a distance of 15 feet…………………… … 30
4.2 One minute trials for four motes at a distance of 30 feet……………… ……… 31
4.3 One minute trials for four motes at a distance of 45 feet…………….…….………31
4.4 One minute trials for four motes at a distance of 60 feet………………… …… 32
4.5 One minute trials for four motes at a distance of 75 feet…………… …… … …32
4.6 One minute trials for four motes at a distance of 90 feet………………………… 33
x
4.7 Five minute trial for four motes at a distance of 15 feet………….…………… …33
4.8 Five minute trial for four motes at a distance of 30 feet……………….……… …34
4.9 Five minute trial for four motes at a distance of 45 feet……………………… …34
4.10 Five minute trial for four motes at a distance of 60 feet………….…………… …35
4.11 Five minute trial for four motes at a distance of 75 feet……………………… …35
4.12 Five minute trial for four motes at a distance of 90 feet…………….………… …36
A.1 MIB510 programming board …………………………………………………… 44
A.2 One end of the cable connected with the mib510 board ……………………… …44
A.3 Another end of the cable connected with the computer …………… ……………45
A.4 Mica2 ………………………………………………………………… …………45
A.5 Mica2 in mib510 board ……………………………………………………… ….46
A.6 Mica2dot motes ………………………………………………………… ……… 47
A.7 Mica2dot connection with the Mib510 board ……………………….…………….47
A.8 Red light on mica2dot is blinking ………………………………………….…… 48
A.9 Mib510 connected with the computer …………………………………….……….50
A.10 Results after running listen tool ……………………………………………….… 50
1
CHAPTER I
INTRODUCTION
1.1. Overview
Wireless sensor networks are becoming pervasive in our lives, transforming many
segments of our economy and life. Wireless medical telemetry systems for remote
monitoring and diagnosis of patients, notably those with a history of cardiac arrhythmias,
are now a reality. The use of the electrocardiogram has spread from the hospital to the
home, with ambulatory ECG equipment readily available. Body area networks for
telemedicine, in the form of biosensor shirts or vests, are also leaving the research lab and
entering the real world [2, 3]. Although these apparatus are somewhat awkward and
bulky, the possibilities abound as we watch what was once science fiction enter our lives,
possibly in very personal ways.
The major contribution of this thesis is the derivation of a set of equations for the
definition of robustness in a system of wireless sensors intended to serve a homebound
patient. Robustness can be defined as a factor that determines if a system of interest is
stable in the presence of unpredictable changes in the input. In tandem, software was
developed to test a set of wireless sensors, then data was collected and analyzed to
validate the proposed robust methodology. Crossbow motes served as the hardware
platform that supplied the empirical data, although the robustness equations apply
generically to any similar system and are in no way tied to or affected by the choice of
2
hardware and software platform. Indeed, every few months, better mote technology
appears on the market.
1.2. Eldercare
In the definition of what makes a particular system of this type robust, we target a
home environment where a home bound patient could wander freely. The telemedicine
system we are interested in is not a catchall solution to all medical conditions. We note
several applications that have proven reasonable for remote patient monitoring, but we do
not engage in any medical diagnosis algorithms in this research. Also of note, we are not
addressing a universal mobility model. In the future, it would be ideal to release a patient
from the hospital with one mobile solution that is unobtrusive and effective in every
environment conceivable, but we are not there yet. Instead, the environment we are
evaluating for a robust system is that of a patient recently sent home for convalescence.
Their movements, realistically, would be restricted to their enclosed living area.
We do not define or evaluate the robustness of a system for the patient that is
mobile beyond the home. For example, there are ECG monitoring devices that have been
developed and marketed for the sports industry. Athletes needs have been targeted so that
they can be monitored under conditions that are physically stressful. Ambulatory elderly
patients have significantly different needs. A wider variety of symptoms should be
monitored in older adults, particularly as their body chemistry changes. For example,
studies suggest that as we age, we are at a higher risk for complications directly related to
drug interactions, even if there were no problems in the past [1]. Among suggestions for
management of these risks are regular ECG tests. It is this population, therefore, that
ultimately will be served with this research.
3
1.3. The Holy Grail
A wearable cardiac monitoring shirt or vest device replaces the traditional ECG
halter, allowing older, ambulatory patients to remain at home longer, particularly those
who have been diagnosed with some form of, or are susceptible to cardiovascular disease
(CVD). The obvious advantage of this approach is continual monitoring versus discrete,
routinely scheduled tests.
One particularly large hurdle, especially for the elderly with fragile skin, is the
electrode itself. ECG data collection is normally a non-invasive technique, although skin
spike and ingestible sensors exist. Skin contact electrodes are applied directly to the skin
with a conductive adhesive gel to maintain contact for high quality traces. These irritate
the skin, and are not meant for long term use or extensive movement. Commercially
available devices for home monitoring typically use 3-lead, hard-wired, skin contact ECG
sensors that can be worn up to fourteen days. Non-contact sensors allow total freedom of
movement while being monitored. This type of biosensor is not commercially available,
but researchers in both the United States and Great Britain have proved the science.
Patents are currently pending for non-contact electrodes [4].
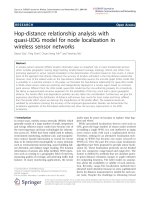
The intended sensor network architecture is designed for a shirt as illustrated in
Figure 1.1. The shirt would have, as its backbone, a set of wired biosensors connected to
a wireless sensor mote acting as a controller for processing and communication. The
biosensor suite could include non-contact ECG sensors with blood pressure and body
temperature sensors for diagnostic support. A small handheld device with a much larger
memory, processing capacity and short range wireless communication capability is the
focal point for the controlling mote. We call this the base station. This device may
provide GPS coordinates and automated emergency cell phone support as descried in [5].
Alternatively, it could take the form of a laptop with the same capabilities, but less
mobility, as the laptop location would be less mobile than a PDA, which could easily be
transferred from one room in the home to another.
As such, this is the physical scenario for which the robust methodology has been
derived: a limited home environment with normal construction walls, furniture, humans,
pets, etc. with a distance of roughly 100 feet from the patient to the base station. The data
rates for the model are derived from those provided by biosensors intended for home
patient use.
Figure 1.1: A conceptual biosensor shirt with sensors exposed on the outside for
illustration.
1.4. Wireless Issues
Wireless sensor motes, simply referred to as motes, are proposed as the source for
transmission of medical data in these body area networks. They can be used as a central
collection point on a biosensor shirt to monitor a patient’s medical condition. Although
the data is transmitted through a wireless link to a geographically close base station, the
4
5
environment for wireless communication is unpredictable. The contribution of this thesis
is the development of a robustness metric designed specifically for this application in
order to determine if the motes can be used for reliable transmission of potentially life
critical data. Communication between these wireless devices may take place in an
environment where their performance capacities degrade due to unpredictable
circumstances, such as distance between motes, environment and incorrect estimation of
system parameters.
In chapter two, robustness is further defined. The system of equations is
developed that is the core of this work. Chapter three describes the experimental
hardware and software used for the experiments. In chapter four, data from the
experiments are presented, analyzed and discussed. Finally, conclusions are drawn in
chapter five and a plan for future work is presented.
6
CHAPTER II
ROBUSTNESS
In general terms, robustness is the extent that a system can continue to function in
the presence of small perturbations, i.e., when faults are introduced. Ali et. al., [6] have
developed an interesting general mathematical formulation to create a metric for
robustness in a target system. This process has been successfully applied to a variety of
scheduling applications [7, 8, 9].
Our goal is to use their general process to derive and analyze a robustness metric
that is meaningful for mote-to-mote communication, specifically targeting the
performance needs of a biosensor shirt communicating with a local base station [18]. We
follow their four step procedure, called FePIA: identify the performance measures,
identify perturbation parameters, identify the impact of those perturbation parameters on
the system, and finally, analyze the system robustness.
2.1. Performance Features
The first step in the FePIA procedure is to identify the performance features of the
motes that we are evaluating. In other words, what makes our system robust? It is known
that wireless communication suffers from signal loss caused by factors such as distance,
obstructions, and interference with other signals in the same frequency. Communication
7
protocols often include time outs and resends for unacknowledged packets to deal with
these problems. Even so, a system that cannot keep up with too many packet
transmissions will lose data in a continuous data stream environment like ECG
monitoring. Real time biomedical data should be robust against signal loss so that data
analysis on the base station is not affected in either quality or timeliness.
A single system performance feature, φ
i
, to be throughput, will be used. For this
application, throughput is defined here as the number of packets delivered from a source
mote to a destination mote in a given time frame.
The main concern is the accumulation of errors such that the limited buffer space
allocated in the source mote will become full with unacknowledged packets waiting to be
transmitted while new data is being generated by the halter. In fact, it is imperative that
the entire ECG signal is transmitted properly and in its entirety. The base station system
is expected to run rudimentary analysis on the waveform and calculate the heart rate.
Results of the analysis may trigger an alarm as appropriate. Too many false positives
create a lack of confidence in the system. False negatives resulting in loss of life are
unacceptable.
Let χ be the data rate in packets per second (Hz) and γ be the samples per packet
based on the block sizes of the data collected. Let P
tot
be a vector of the total number of
packets transmitted from the source, or sensor collecting mote to the destination mote for
a given time period expressed in seconds, t. We are given T as a total time expressed in
intervals of t. If n is the number of intervals of t, then the total time span being measured
is T = t × n. The predicted (expected) value is the number of packets sent in the absence
of uncertainty, that is,
8
P
i
tot
= χ × γ × t . (1)
Next we need to determine the robustness requirement for φ
i
. Because we are
dealing with medical data that could have an effect on a patient’s life, reliability is
critical, and time is of the essence. It is assumed that we know values for χ, γ and t. A
mapping µ is then determined using an estimated value based on the tolerable error rate.
This mapping corresponds to the predicted (expected) performance versus the actual
performance for a number of time intervals.
We next need to consider the tolerable variation in our system feature, φ
i
. For
example, we might determine that we are able to resend a certain percentage of the
packets that were dropped or corrupt over a time interval, t, without affecting the overall
throughput of the system. That is, during the time it takes for the source to timeout and
resend those packets, no other data currently being acquired will be lost at the source due
to a full buffer. This is our expected error rate, called τ. The system is robust if the
expected error rate itself does not deviate by more than a certain percent. For example, if
the tolerable variation in the expected error rate is 15%, then τ = 0.15, and the maximum
tolerable variation would be described as 0.15 × P.
Finally, we define P
rec
to be the actual number of packets successfully received at
the destination.
9
2.2. Perturbation Parameters
A perturbation parameter is the part of the system that makes the outcome
imperfect or unpredictable. We let Π be the set of perturbation parameters with |Π| = 1.
We also define π
1
to be the error rate.
Let E
drop
be a vector of the number of packets dropped in time interval t. This is a
measurement of the number of packets sent from a source mote to a destination that do
not get acknowledged. The packets are presumably not received by the destination, or
else the header is so corrupt that it cannot determine that it was sent from the source
mote. Let E
corr
be a vector of the number of corrupted packets in time interval t. That is,
we measure those packets whose headers are intact enough for the destination mote to
request a resend due to a corrupted payload. Packets received with a bad cyclic
redundancy check (CRC) are deleted without sending a resend request (NACK). The
sender, not receiving an ACK, times out and resends. Thus, we define the total number of
errors to be the vector E = [E
1
E
2
… E
n
] such that:
E
i
= E
i
drop
+ E
i
corr
. (2)
E
i
corr
is measured directly at the destination mote, even though we delete corrupt
packets without a resend request. E
i
drop
can then be calculated as:
E
i
drop
= P
i
tot
- P
i
rec
- E
i
corr
. (3)
10
For example, assume the source mote sends 1875 packets. The destination mote
claims it received a total of 1813 good packets and 49 corrupt packets. The discrepancy
of 13 packets are accounted for as lost in transmission or dropped because of a bad
header.
Now let E
exp
be a vector of the total expected errors over time T in intervals of t
for distances defined in Π. E
exp
= [E
1
exp
E
2
exp
… E
i
exp
]. E
i
exp
is calculated as
E
i
exp
= P
i
tot
* τ . (4)
In this system, E is taken as the perturbation parameter.
2.3 Impact of Perturbation Parameters on Performance Features
Next follows a definition of the impact of errors on throughput. As specified in
step three of FePIA, P
rec
must be expressed as a function of E. This is a straightforward
relationship, where i is mapped with respect to the time intervals of t.
P
i
rec
(E) = P
i
- E
i
. (5)
2.4. Analysis to Determine Robustness
In the last step of FePIA, we need to determine the smallest collective variation in
the values of the perturbation parameters, Π that causes the performance feature, φ
i
, to
violate the robustness requirement. The set of corresponding boundary relationships with
respect to equation (5) is:
{P
i
rec
(E) = τ (P
i
tot
- E
i
exp
)| 1 ≤ i ≤ n}. (6)
We define τ
µ
as the function that maps the packets received with the expected
errors. Applying the FePIA method we use the Euclidean distance between the vector of
the actual throughput and the estimated throughput. If this value is not more than τ
µ
(P
rec
,
E), then the actual throughput will be at least τ × P
tot
. For clarity, the Euclidean norm for
a vector x, is annotated as ||x||
2
and is given by:
(7)
The robustness radius for our initial application with distance at the perturbation
parameter is given by
τ
µ
(φ
i
, π
j
) = min || E
i
- E
i
orig
||
2
. (8)
In graphical terms, this defines a radius that defines the boundary relationship
where, when crossed, the system is no longer considered to be robust.
2.5 Robustness Research
This forms the theoretical basis for this research. In order to determine if a system
is robust, one must answer three basic questions. First, what behavior makes our specific
system robust? In our research, we define this to be the throughput of the system. Second,
11
12
what uncertainties do we face that affects the robustness of our system? We have
determined this to be the number of packets dropped due to perturbations in a wireless
environment. Finally, quantitatively, how robust is our system? This question is not
answered in this thesis. Rather, in chapter three, we develop the software for a set of
motes so that we have a working system to test and collect the real time data needed for
this analysis. In chapter four, we show the results of the working system, and the first set
of data collected.
13
CHAPTER III
SYSTEM DESCRIPTION
A proposed architecture for a biosensor shirt populated with next-generation
wireless, non-contact ECG sensors, blood pressure patches, pulse oximeters, and body
temperature sensors for diagnostic support is described in [11]. The purpose of our
experiments is to establish communication between the one or more source motes and a
destination mote. We are developing the software so that we have a stable, useable
system for further research to quantitatively determine how robust a system of this type
is. This chapter provides a description of the hardware and software used for the
experiments.
3.1. Hardware Description and Terminology
The hardware used consists of source motes that are capable of sending sensor
data, destination motes that collect the data through a wireless channel, and a base station
that can store, and potentially evaluate the data. Evaluation is dependent on the specific
application.
14
3.1.1. Motes
In general terms, a mote is simply a remote transceiver that can also act as a
remote sensor. The hardware is usually cheap and very small, relative to what we
normally think of with computers. The mote supplies simple wireless communication
capability to interact with other motes in order to share different information about the
environment, health, habitat, or battlefield awareness, for example. The hardware used
for this part of our research is manufactured by Crossbow [12]. Two different types of
motes are used. What we define as a source mote is capable of collecting sensor data
from its sensor board connecter interface. What we define as a destination mote collects
the data from the source mote (or motes) and sends the data to a base station for storage.
Our base station is a laptop for this research.
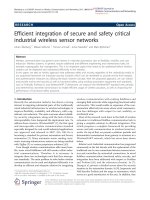
3.1.2. Mica2Dot
Mica2Dot is a third generation, Quarter-Sized (25mm), Wireless Platform for
Smart Sensor, which is designed for Wireless Sensor Networks. It is a reprogrammable,
battery-powered and movable device. It can be found with 868/916 MHz, 433 MHz or
315 MHz multi-channel transceiver with extended range. Each mote has 18 pins that can
connect to sensors, supporting analog input, digital I/O, and a serial communication
interface. Test data is stored in flash memory of the source mote hardware and
transmitted to a destination mote. The Mica2Dot motes used for this research are shown
in Figure 3.1.
Figure 3.1: Mica2Dot Motes
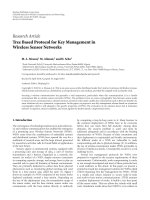
3.1.3. Mica2
Mica2 is also a third generation, wireless communication device which is used for
sending data to the base station. It is like a small computer. It has its own processing,
storage and power supply. It can be connected to the mib510 board for sending
information to the computer [12]. The Mica2 motes used in this research is shown in
Figure 3.2.
Figure 3.2: Mica2 mote
15