global fertilizers industry primer - ubs (2008)
Bạn đang xem bản rút gọn của tài liệu. Xem và tải ngay bản đầy đủ của tài liệu tại đây (135.87 KB, 16 trang )
UBS Investment Research
UBS Global I/O
TM
: Fertilisers
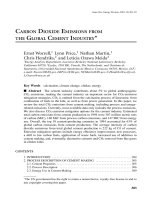
Middle East FOB Urea Prices and Forecasts
0
200
400
600
20
0
2
20
0
3
2
0
04
20
0
5
20
0
6
20
07
2
00
8
E
2
009E
2
0
10
E
2
01
1
E
US$/ton
Source: Fertecon, UBS Estimates
Nitrogen fertilisers strong for now
Chinese export tariffs increases tighten supply & stabilise
The Chinese government has reacted to a surge in urea exports by increasing
export tariffs for 2008 by an average of 5 percentage points. We see this as a
continued prevention of Chinese supply from dampening what is a tight market
while at the same time providing some relief at current elevated price levels.
Crop commodity prices support demand growth
Almost doubling of US corn ethanol production capacity in 2008 coupled with
revised USDA corn price forecasts for 2008 are clear indicators that nitrogen
demand growth fundamentals are as strong as in 2007.
We predict a 20% Urea average price increase for 2008
We estimate a 20% increase in average Urea prices in 2008, but a 7% easing o
f
p
rices in 2009 and 2010 due to the addition of significant low cost capacity in the
Middle East and North Africa.
Yara, Agrium, Potash Corp benefit, while trade barriers isolate ChinaBlue
Our raised price forecast continues to support our Buy ratings on Agrium &
Potash Corp, while Chinese producers remain isolated due to trade barriers
supporting the Neutral view on China Blue We reiterate Yara’s Sell rating &
revised its price target & earnings forecasts on January 15
th
to reflect price changes
Global Equity Research
Global
Chemicals, Fertilisers
Market Comment
17 January 2008
www.ubs.com/investmentresearch
Joe Dewhurst
A
nalyst
+44 207 56 88327
Laurent Favre
A
nalyst
+44-20-756 84008
Brian MacArthur, CFA
A
nalyst
+1-416-350 2229
Jimmy Wong
A
nalyst
+852-2971 8186
Owen Evans
A
nalyst
+61-2-9324 3848
RIC Name Region Analyst Rating M Cap Curr. Target Price App
AGU.N Agrium North America Brian MacArthur Buy $10,517 US$ 79.00 66.69 18%
POT.N Potash Corp North America Brian MacArthur Buy $45,221 US$ 155.00 143.61 8%
3983.HK China BlueChemical Asia Jimmy Wong Neutral $3,243 HK$ 5.50 5.46 1%
IPL.AX Incitec Pivot Australia Owen Evans Neutral $5,626 AZ$ 125.00 124.04 1%
YAR.OL Yara Europe Laurent Favre Sell $14,843 NKr 235.00 270.50 -13%
Source: UBS Research, Prices updated 15
th
January 2007
The UBS Global I/O™ initiative engages analysts from around the world in a
collaborative effort to offer our leading
global equity research (“Input”) along
with investment ideas (“Output”) in multiple regions concurrently
.
This report has been prepared by UBS Limited
ANALYST CERTIFICATION AND REQUIRED DISCLOSURES BEGIN ON PAGE 12.
UBS does and seeks to do business with companies covered in its research reports. As a result, investors should be aware that the firm may
have a conflict of interest that could affect the objectivity of this report. Investors should consider this report as only a single factor in making
their investment decision. Customers of UBS in the United States can receive independent, third-party research on the company or
companies covered in this report, at no cost to them, where such research is available. Customers can access this independent research at
www.ubs.com/independentresearch or may call +1 877-208-5700 to request a copy of this research.
ab
UBS Global I/OTM: Fertilisers 17 January 2008
UBS 2
Urea prices firm until 2010
Pricing
Urea can be used as a proxy for nitrogen based fertilisers as it accounts for more
than 60% of the nitrogen fertiliser supply chain. We anticipate Urea pricing to
see more strengthening in 2008 with some easing towards the end of 2009 and
into 2010.
Table 1: Prilled Urea Price Forecasts
2002 2003 2004 2005 2006 2007 2008E 2009E 2010E 2011E 2012E
Middle East 114 157 196 241 233 317 382 359 307 277 277
New Orleans US Barge 143 181 221 278 258 380 459 430 369 332 332
US Gulf Coast 132 158 223 286 252 386 465 437 374 337 337
Yuzhny - Black Sea 93 142 176 218 222 309 373 350 300 270 270
Source: Fertecon, UBS Estimates
Table 2: Urea global supply demand summary
2004 2005 2006 2007E 2008E 2009E 2010E 2011E
Capacity '000 tons 139,349 145,844 153,554 161,282 169,480 177,336 182,389 187,916
Consumption '000 tons 121,227 126,767 133,527 139,592 144,758 149,535 154,223 157,769
Utilisation 87% 87% 87% 87% 85% 84% 85% 84%
Source: Fertecon, IFA, UBS Estimates
Supply
Urea spot pricing is primarily influenced by supply demand in the import and
export markets. Looking at global utilisation rates alone does not provide a clear
picture as utilisation levels are kept artificially low due to tariffs and export
restrictions particularly in China. China is self sufficient in Urea and runs at
utilisation rates of 83% well below theoretical maximum rates of 92%. The
Chinese government has tried to depress exports as an aim to both control local
fertiliser prices, as these are perceived as key influencers in food price inflation,
and unnecessary coal and gas consumption. Removal of Chinese capacity and
demand from global forecasts illustrates that in fact the rest of the world is
operating in a tightening supply/demand environment. In our mind this presents
a clearer picture on supply/demand dynamics.
Urea pricing expected to increase by
20% yoy over 2007 but some softening
expected in 09 & 10 due to lower cost
capacity additions in the Middle East
Urea supply demand needs to be
evaluated excluding China, as the
government will continue to stem
exports through tariffs
UBS Global I/OTM: Fertilisers 17 January 2008
UBS 3
Chart 1: Urea production utilisation rates
Source: Fertecon, UBS Estimates
With the recent escalation in global FOB prices we have seen significant
increases in Chinese export volumes, which have actually cooled what could be
seen as a heated market rather than correcting it. Export volumes in Q4/07
peaked at record levels as export tariffs were relaxed from 30 to 15% while
global spot prices were already high. We expect this dynamic to remain and this
is why we assume a greater degree of pricing stability in 2008 & 2009 than the
utilisation rates ex-China would imply.
Chart 2: Chinese urea exports in 2007
0
200,000
400,000
600,000
800,000
1,000,000
Jan-
07
Feb-
07
Mar-
07
Apr-
07
May-
07
Jun-
07
Jul-07 Aug-
07
Sep-
07
Oct-
07
Nov-
07
Urea exports tps
200
250
300
350
400
Tonnage Exported tons/month Average Price US$
15%
Tariff 30%
Source: Chinese Customs, Fertecon, UBS
We expect the Chinese government will continue to control exports through
tariffs. In January 2008 the Chinese government dramatically increased the tariff
structure on Urea exports. In 2007 tariffs ran at 30% from January to September
and were reduced to 15% during the low local demand period of October to
December. These are now set at 30% for January to March, 35% from April to
September and 25% from October to December. With current pricing this will
still, by our calculations supply an additional 400 ktons per month into the
export market provided MEA FOB prices remain above $300/ton. In our view
the Chinese supply will serve to stabilise prices rather than depress them in 08 &
09.
Chinese exports were at a record level
in Q4/07 in spite of a 15% export tariff
Chinese exports, a safety valve when
MEA FOB values are above $300/ton
83%
84%
85%
86%
87%
88%
89%
2004 2005 2006 2007E 2008E 2009E 2010E 2011E
Utilisation rate %
With China Excluding China
83%
84%
85%
86%
87%
88%
89%
2004 2005 2006 2007E 2008E 2009E 2010E 2011E
Utilisation rate %
With China Excluding China
UBS Global I/OTM: Fertilisers 17 January 2008
UBS 4
Chart 3: Chinese Urea export potential protected by tariffs
Source: Fertecon, UBS Estimates
From 2010 significant increases in supply capacity for urea are expected. Much
of the additional capacity is likely to be in the Middle East and North Africa
where operating costs are significantly lower than the rest of the world. We
believe that this will shift the overall cost curve downwards and we will see
some price relief from 2010.
Chart 4: Estimated urea cash costs Chart 5: High probability urea capacity additions
0
50
100
150
200
250
300
US Gulf
Coast
China Ukraine Russia Middle
East
FOB US$/ton
0
1,000
2,000
3,000
4,000
5,000
6,000
7,000
8,000
2008 2009 2010 2011
Urea Capacity '000 tons
MEA
FSU
Europe & Russia
China
Asia (Excl China)
Americas
Source: Fertecon, UBS estimates, CMAI Source: Fertecon, UBS estimates
In addition to this there are a large number of announced projects with a lower
probability of implementation. We would infer though that elevated prices will
now increase the probability of project go-aheads. Thus we believe that high
prices will encourage the cycle move into oversupply post 2011. If all
announced projects were added this would move average operating rates for
2011-2015 period from 85% to 76%.
New lower cost capacity should help
soften prices beyond 2008 by lowering
the cost curve
0
5
10
15
20
25
30
35
40
45
50
2005 2006 2007E 2008E 2009E 2010E 2011E 2012E
Export Capacity Million tons
Additional China "potential"
Latin America
North America
Asia
Middle East
Africa
CIS
Europe
0
5
10
15
20
25
30
35
40
45
50
2005 2006 2007E 2008E 2009E 2010E 2011E 2012E
Export Capacity Million tons
Additional China "potential"
Latin America
North America
Asia
Middle East
Africa
CIS
Europe
UBS Global I/OTM: Fertilisers 17 January 2008
UBS 5
Chart 6: Low probability announced capacity additions
0
5,000
10,000
15,000
20,000
25,000
30,000
35,000
40,000
45,000
50,000
2007-2010 Low
probability
2011-15 High
Probability
2011-2015 Low to
Medium Probability
Urea capacity addition '000 tons
MEA
FSU
China
Asia (Excl China)
Americas
Source: Fertecon, UBS estimates
Demand
Chart 7: Urea global demand growth rates Chart 8: Urea consumption by region
0.0%
1.0%
2.0%
3.0%
4.0%
5.0%
6.0%
2005 2006 2007E 2008E 2009E 2010E 2011E
-
20
40
60
80
100
120
140
160
180
2
00
4
200
6
200
8
E
2010E
Urea consumption millions tons
Oceania
CIS
Africa
Middle East
Latin America
Europe
North America
Asia
Source: Fertecon, UBS estimates, IFA Source: Fertecon, UBS estimates, IFA
We expect global demand for Urea to slow marginally in 2008 versus 2007, but
still remain about 3.5%. There is likely to be more balanced planting of soybean
and wheat versus corn as the margin gap between the three crops is closer.
India will likely continue to surprise and we estimate will again grow at close to
8% as it has done both in 2006 and 2007. India consumption in 2007 is
estimated to be nearly 20% of global.
UBS Global I/OTM: Fertilisers 17 January 2008
UBS 6
Chart 9: Fertiliser application rates by major crop Chart 10: US spot corn prices
0
20
40
60
80
100
120
140
Corn Wheat Soybeans Cotton
N P2O5 K20
kg/acre
1.00
2.00
3.00
4.00
5.00
Feb-90
Feb-92
Feb-94
Feb-96
Feb-98
Feb-00
Feb-02
Feb-04
Feb-06
Ethanol & Ex
p
orts Drivin
g
Drought
Source: Potash Corp Source: StockVal
Chart 11: Wheat Prices ($/bu.) – 1990-present Chart 12: Soybean Prices ($/bu.) – 1990-present
0.00
2.00
4.00
6.00
8.00
10.00
Jan-90
Jan-92
Jan-94
Jan-96
Jan-98
Jan-00
Jan-02
Jan-04
Jan-06
Jan-08
Record Wheat Prices
4.00
6.00
8.00
10.00
12.00
14.00
Jan-90
Jan-92
Jan-94
Jan-96
Jan-98
Jan-00
Jan-02
Jan-04
Jan-06
Jan-08
Low er Acreage & Strong Demand
Source: StockVal Source: StockVal
Demand fundamentals of record crop prices, historically low inventories and
emerging market wealth improvements are stronger than ever.
US ethanol capacity build for 2008 appears to be moving ahead as planned.
According to the Renewable Fuels Association ethanol capacity in the US will
expand by a further 6bn gallons from 7.3bn gallons of capacity on line at the end
of 2007. Recent increases in energy prices have also now moved ethanol crush
margins into positive territory, though oversupply due to additional capacity will
ultimately erode these margins. On January 14
th
the USDA increased its 07/08
corn forecast from $3.65 to$4.00 a bushel.
Farmers are getting richer globally as a result and the cost reward equation for
farmers in utilisation of fertilisers and chemicals increases.
Demand pressure for corn in the US
should increase with added ethanol
capacity
UBS Global I/OTM: Fertilisers 17 January 2008
UBS 7
Chart 13: US net farm income , 1980 - present
$16.1
$26.9
$23.8
$14.2
$26.0
$28.6
$30.9
$37.4
$38.0
$45.3
$44.6
$38.5
$47.8
$44.7
$48.9
$36.9
$54.8
$50.5
$45.6
$46.8
$47.9
$51.5
$40.2
$59.7
$85.9
$77.1
$59.0
$87.5
0.0
10.0
20.0
30.0
40.0
50.0
60.0
70.0
80.0
90.0
100.0
1980
1981
1982
1983
1984
1985
1986
1987
1988
1989
1990
1991
1992
1993
1994
1995
1996
1997
1998
1999
2000
2001
2002
2003
2004
2005
2006
2007F
$ Billions
Source: USDA
A key consideration though for 2008 is that the margin differential for farmers
between corn, soybean and wheat has shifted. We believe that there could be
some shifting out of corn into soybeans in the US. This should soften overall US
nitrogen demand.
(1) Farmers like to rotate crops and many of them planted corn on top of corn
in 2007 and are unlikely to plant corn for a 3
rd
year.
(2) Soybeans and wheat price have increased significantly, both up around
80% whereas corn is up about 20% y-o-y.
(3) Nitrogen fertiliser costs are now an important consideration when planting
corn.
Chart 14: Wholesale Ammonia (NH3) Price ($/ton) – 2003-2008
$150
$200
$250
$300
$350
$400
$450
$500
Jan-03
Jul-03
Jan-04
Jul-04
Jan-05
Jul-05
Jan-06
Jul-06
Jan-07
Jul-07
Price ($)
Nitrogen Costs Spiking for Corn Growers
Source: Bloomberg
On the downside there may be some
switching out of corn into soybean in
the US
UBS Global I/OTM: Fertilisers 17 January 2008
UBS 8
(4) Profits per acre calculations of corn vs. soybeans are turning in favour of
beans.
(5) All other things being close to equal, farmers prefer to grow soybeans
because they require less upkeep.
Chart 15: US Corn vs. Soybeans Acres – 2000-2008E (Acres/millions)
85
72
60
65
70
75
80
85
90
95
2000 2001 2002 2003 2004 2005 2006 2007 2008E
Corn Soy beans
Acres Expected to Revert Back to More Normal
Source: USDA, UBS estimates
UBS Global I/OTM: Fertilisers 17 January 2008
UBS 9
Equity impacts
Chart 16: Company sales split by nutrient (2006 basis)
100%
33%
28%
21% 21%
5%
34%
17%
53%
7%
33%
38%
2%
33%
87%
55%
41%
24%
55%
13%
Ur
a
lk
a
l
i
Potash Corp
I
s
r
ae
l Chemi
cals
K&S
Mosaic
Agri
u
m
Y
ara
Other
Nitrogen
Phosphate
Potash
613 3,377 2,887 3,173 5,306 4,193 7,540
(US$ millions)
Source: UBS, company reports
Chart 17: Urea capacity per share 2008E basis
0
1
2
3
4
5
6
7
8
9
10
Yara Agrium Potash Corp Incitec Pivot China
BlueChemical
Urea kg/share
Source: Fertecon, UBS Estimates
Agrium (Buy, PT US$79.00)
Agrium is a major North American fertilizer producer with numerous nitrogen
plants, two phosphate plants and one potash mine and a large retail business. It
is the largest North American nitrogen producer and owns three of the most
modern plants, resulting in lower gas consumption. Its efficiency, combined
with their favourable location in Alberta where gas costs are typically lower than
those of many of its competitors, results in Agrium having some of the lowest-
cost ammonia and urea plant in North America. In addition, a large portion of
Agrium's North American sales are in the higher-priced US Pacific Northwest
and Western Canadian markets, which leads to even better margins. Finally,
Agrium has a 50% interest in the Proferteil facility in Argentina which has
access to low-cost natural gas under long-term contracts. Thus we believe
Agrium is well positioned to benefit from strong nitrogen prices.
UBS Global I/OTM: Fertilisers 17 January 2008
UBS 10
Potash Corp (Buy, PT US$155.00)
PotashCorp is one of the world's largest and lowest-cost publicly traded potash
producers and is also the world's third-largest phosphate producer. Thus the
company is better known for its exposure to potash and phosphate two
commodities for which UBS also has a positive outlook. However, PotashCorp
is also one of the world's largest nitrogen companies, with seven plants in the
U.S. and a large complex in Trinidad. Due to favourable long-term contracts at
some of the Trinidadian facilities that tie its natural gas cost (the major cost in
producing ammonia) to the price of ammonia, at full production about 50% of
PCS ammonia is covered in a manner that preserves margins unless the
ammonia price falls below a floor price. In addition, a portion of PCS's nitrogen
production goes to industrial customers at more stable margins. Thus we believe
PotashCorp will also benefit from strong nitrogen prices.
Incitec Pivot (Neutral, PT A$125)
Incitec is the sole producer of fertilisers in eastern Australia. It produces 480kt
of urea and equivalents from its Gibson Island plant in Brisbane and 1mt of
MAP/DAP from the Phosphate Hill plant in north Queensland. It is also the
largest importer and distributer of fertiliser in Australia.
Both are low cost plants delivered into eastern Australian markets. In general the
customer base is extremely competitive in Asian markets. This is particularly
true for wheat, barley, sorghum, sugar and dairy products. Presuming normal
weather patterns we would expect IPL to have an excellent year in fiscal 2008.
Yara (Sell, PT NKR235.00)
Yara is the most heavily weighted towards nitrogen fertilisers out of all the
stocks under coverage. Yara has outperformed the market by 60-80% over the
past 6 months though there is market risk in momentum build towards anything
Ag related and nitrogen barriers to entry are significantly lower than mineral
based fertilisers (Potash and Phosphates) putting this supply demand balance
more at risk to profit taking in the future, in our view.
China BlueChemical (Neutral, PT HK$ 5.50) &
Sinofert (Buy, PT HK$ 7.60)
Chart 18: Chinese versus global Urea Prices
100
150
200
250
300
350
400
J
an
-0
2
Jul-02
J
an-
0
3
J
ul-
03
J
a
n-0
4
Jul-04
J
an-
0
5
Jul-
05
Jan-06
Jul-06
J
an
-0
7
Jul-
0
7
Urea pricing US$/ton
China MEA
Price capping effects
Source: Fertecon, CEIC
UBS Global I/OTM: Fertilisers 17 January 2008
UBS 11
China BlueChemical has about 1.84 million tons of Urea capacity. Sinofert on
the other hand is a small distributor or urea in China and hence has limited
exposure to the Chinese Urea market.
The market is subjected to capping by the Chinese government in an effort to
stem price inflation effects of fertilisers on food. For most of 2007 the Chinese
producers have not managed to capture cash margins experienced in the global
market and in effect puts them at a disadvantage.
The Chinese government has also introduced export taxes to prevent what they
see as unnecessary exports of products derived from precious energy sources of
natural gas and coal. Export tariffs were historically set to be 30% of FOB sport
prices from Q1-Q3 and 15% during the low demand Q4. Since the beginning of
January this has been adjusted upwards to 30% in Q1, 35% in Q2 to Q3 and
25% in Q4. This has meant that cash margins from exports are also constrained
and at reduced volumes.
The market conditions support our valuation estimates for China BlueChemical
as, due to protectionism, it operates with cash margins at a substantial discount
to those enjoyed by global producers.
Q Statement of Risk
The fertiliser market is strongly influenced both global and regional supply
demand balances, as well as input and shipping costs. Unpredictable events in
particular weather related ones can rapidly alter these balances and hence
influence prices.
UBS Global I/OTM: Fertilisers 17 January 2008
UBS 12
Q Analyst Certification
Each research analyst primarily responsible for the content of this research
report, in whole or in part, certifies that with respect to each security or issuer
that the analyst covered in this report: (1) all of the views expressed accurately
reflect his or her personal views about those securities or issuers; and (2) no part
of his or her compensation was, is, or will be, directly or indirectly, related to
the specific recommendations or views expressed by that research analyst in the
research report.
UBS Global I/OTM: Fertilisers 17 January 2008
UBS 13
Required Disclosures
This report has been prepared by UBS Limited, an affiliate of UBS AG. UBS AG, its subsidiaries, branches and affiliates
are referred to herein as UBS.
For information on the ways in which UBS manages conflicts and maintains independence of its research product;
historical performance information; and certain additional disclosures concerning UBS research recommendations,
please visit www.ubs.com/disclosures.
UBS Investment Research: Global Equity Rating Allocations
UBS 12-Month Rating Rating Category Coverage
1
IB Services
2
Buy Buy
55% 39%
Neutral Hold/Neutral
36% 36%
Sell Sell
8% 20%
UBS Short-Term Rating Rating Category Coverage
3
IB Services
4
Buy Buy
less than 1% 25%
Sell Sell
less than 1% 50%
1:Percentage of companies under coverage globally within the 12-month rating category.
2:Percentage of companies within the 12-month rating category for which investment banking (IB) services were provided within
the past 12 months.
3:Percentage of companies under coverage globally within the Short-Term rating category.
4:Percentage of companies within the Short-Term rating category for which investment banking (IB) services were provided
within the past 12 months.
Source: UBS. Rating allocations are as of 31 December 2007.
UBS Investment Research: Global Equity Rating Definitions
UBS 12-Month Rating Definition
Buy
FSR is > 6% above the MRA.
Neutral
FSR is between -6% and 6% of the MRA.
Sell
FSR is > 6% below the MRA.
UBS Short-Term Rating Definition
Buy
Buy: Stock price expected to rise within three months from the time the rating was assigned
because of a specific catalyst or event.
Sell
Sell: Stock price expected to fall within three months from the time the rating was assigned
because of a specific catalyst or event.
UBS Global I/OTM: Fertilisers 17 January 2008
UBS 14
KEY DEFINITIONS
Forecast Stock Return (FSR) is defined as expected percentage price appreciation plus gross dividend yield over the next 12
months.
Market Return Assumption (MRA) is defined as the one-year local market interest rate plus 5% (a proxy for, and not a
forecast of, the equity risk premium).
Under Review (UR) Stocks may be flagged as UR by the analyst, indicating that the stock's price target and/or rating are
subject to possible change in the near term, usually in response to an event that may affect the investment case or valuation.
Short-Term Ratings reflect the expected near-term (up to three months) performance of the stock and do not reflect any
change in the fundamental view or investment case.
EXCEPTIONS AND SPECIAL CASES
UK and European Investment Fund ratings and definitions are :
Buy: Positive on factors such as structure, management, performance record, discount; Neutral: Neutral on factors such as
structure, management, performance record, discount; Sell: Negative on factors such as structure, management, performance
record, discount.
Core Banding Exceptions (CBE) : Exceptions to the standard +/-6% bands may be granted by the Investment Review
Committee (IRC). Factors considered by the IRC include the stock's volatility and the credit spread of the respective company's
debt. As a result, stocks deemed to be very high or low risk may be subject to higher or lower bands as they relate to the rating.
When such exceptions apply, they will be identified in the Company Disclosures table in the relevant research piece.
Company Disclosures
Company Name Reuters 12-mo rating Short-term rating Price Price date
Agrium Inc.
2c, 4a, 5, 16
AGU.N Buy N/A US$66.69 15 Jan 2008
China BlueChemical
3983.HK Neutral N/A HK$5.46 15 Jan 2008
Incitec Pivot Limited
13
IPL.AX Neutral N/A A$124.04 15 Jan 2008
Potash Corporation of
Saskatchewan Inc.
2a, 4b, 16
POT.N Buy N/A US$143.61 15 Jan 2008
Sinofert Holdings
0297.HK Buy N/A HK$7.37 15 Jan 2008
Yara
2b, 16
YAR.OL Sell N/A NKr270.50 15 Jan 2008
Source: UBS. All prices as of local market close.
Ratings in this table are the most current published ratings prior to this report. They may be more recent than the stock pricing
date
2a. UBS AG, its affiliates or subsidiaries has acted as manager/co-manager in the underwriting or placement of securities of
this company/entity or one of its affiliates within the past 12 months.
2b. UBS AG, its affiliates or subsidiaries has acted as manager/co-manager in the underwriting or placement of securities of
this company/entity or one of its affiliates within the past five years.
2c. UBS Securities Canada Inc or an affiliate has acted as manager/co-manager, underwriter or placement agent in regard
to an offering of securities for this company/entity or one of its affiliates within the past 12 months.
4a. Within the past 12 months, UBS Securities Canada Inc or an affiliate has received compensation for investment banking
services from this company/entity.
4b. Within the past three years, UBS Securities Canada Inc or an affiliate has received compensation for investment banking
services from this company/entity.
5. UBS Securities Canada Inc or an affiliate expect to receive or intend to seek compensation for investment banking
services from this company/entity within the next three months.
13. UBS AG, its affiliates or subsidiaries beneficially owned 1% or more of a class of this company`s common equity
securities as of last month`s end (or the prior month`s end if this report is dated less than 10 days after the most recent
month`s end).
16. UBS Securities LLC makes a market in the securities and/or ADRs of this company.
The analyst responsible for this report has not reviewed the material operations of the issuer.
Unless otherwise indicated, please refer to the Valuation and Risk sections within the body of this report.
UBS Global I/OTM: Fertilisers 17 January 2008
UBS 15
For a complete set of disclosure statements associated with the companies discussed in this report, including information on
valuation and risk, please contact UBS Securities LLC, 1285 Avenue of Americas, New York, NY 10019, USA, Attention:
Publishing Administration.
UBS Global I/OTM: Fertilisers 17 January 2008
UBS 16
Global Disclaimer
This report has been prepared by UBS Limited, an affiliate of UBS AG. UBS AG, its subsidiaries, branches and affiliates are referred to herein as UBS. In certain countries, UBS AG is referred
to as UBS SA.
This report is for distribution only under such circumstances as may be permitted by applicable law. Nothing in this report constitutes a representation that any investment strategy or
recommendation contained herein is suitable or appropriate to a recipient’s individual circumstances or otherwise constitute a personal recommendation. It is published solely for information
purposes, it does not constitute an advertisement and is not to be construed as a solicitation or an offer to buy or sell any securities or related financial instruments in any jurisdiction. No
representation or warranty, either express or implied, is provided in relation to the accuracy, completeness or reliability of the information contained herein, except with respect to information
concerning UBS AG, its subsidiaries and affiliates, nor is it intended to be a complete statement or summary of the securities, markets or developments referred to in the report. UBS does not
undertake that investors will obtain profits, nor will it share with investors any investment profits nor accept any liability for any investment losses. Investments involve risks and investors should
exercise prudence in making their investment decisions. The report should not be regarded by recipients as a substitute for the exercise of their own judgement. Any opinions expressed in this
report are subject to change without notice and may differ or be contrary to opinions expressed by other business areas or groups of UBS as a result of using different assumptions and criteria.
Research will initiate, update and cease coverage solely at the discretion of UBS Investment Bank Research Management. The analysis contained herein is based on numerous assumptions.
Different assumptions could result in materially different results. The analyst(s) responsible for the preparation of this report may interact with trading desk personnel, sales personnel and other
constituencies for the purpose of gathering, synthesizing and interpreting market information. UBS is under no obligation to update or keep current the information contained herein. UBS relies
on information barriers to control the flow of information contained in one or more areas within UBS, into other areas, units, groups or affiliates of UBS. The compensation of the analyst who
prepared this report is determined exclusively by research management and senior management (not including investment banking). Analyst compensation is not based on investment banking
revenues, however, compensation may relate to the revenues of UBS Investment Bank as a whole, of which investment banking, sales and trading are a part.
The securities described herein may not be eligible for sale in all jurisdictions or to certain categories of investors. Options, derivative products and futures are not suitable for all investors, and
trading in these instruments is considered risky. Mortgage and asset-backed securities may involve a high degree of risk and may be highly volatile in response to fluctuations in interest rates
and other market conditions. Past performance is not necessarily indicative of future results. Foreign currency rates of exchange may adversely affect the value, price or income of any security
or related instrument mentioned in this report. For investment advice, trade execution or other enquiries, clients should contact their local sales representative. Neither UBS nor any of its
affiliates, nor any of UBS' or any of its affiliates, directors, employees or agents accepts any liability for any loss or damage arising out of the use of all or any part of this report. Additional
information will be made available upon request.
For financial instruments admitted to trading on an EU regulated market: UBS AG, its affiliates or subsidiaries (excluding UBS Securities LLC and/or UBS Capital Markets LP) acts as a market
maker or liquidity provider (in accordance with the interpretation of these terms in the UK) in the financial instruments of the issuer save that where the activity of liquidity provider is carried out
in accordance with the definition given to it by the laws and regulations of any other EU jurisdictions, such information is separately disclosed in this research report.
United Kingdom and the rest of Europe: Except as otherwise specified herein, this material is communicated by UBS Limited, a subsidiary of UBS AG, to persons who are eligible
counterparties or professional clients and is only available to such persons. The information contained herein does not apply to, and should not be relied upon by, retail clients UBS Limited is
authorised and regulated by the Financial Services Authority (FSA). UBS research complies with all the FSA requirements and laws concerning disclosures and these are indicated on the
research where applicable. France: Prepared by UBS Limited and distributed by UBS Limited and UBS Securities France SA. UBS Securities France S.A. is regulated by the Autorité des
Marchés Financiers (AMF). Where an analyst of UBS Securities France S.A. has contributed to this report, the report is also deemed to have been prepared by UBS Securities France S.A.
Germany: Prepared by UBS Limited and distributed by UBS Limited and UBS Deutschland AG. UBS Deutschland AG is regulated by the Bundesanstalt fur Finanzdienstleistungsaufsicht
(BaFin). Spain: Prepared by UBS Limited and distributed by UBS Limited and UBS Securities España SV, SA. UBS Securities España SV, SA is regulated by the Comisión Nacional del
Mercado de Valores (CNMV). Turkey: Prepared by UBS Menkul Degerler AS on behalf of and distributed by UBS Limited. Russia: Prepared and distributed by ZAO UBS Securities.
Switzerland: Distributed by UBS AG to persons who are institutional investors only. Italy: Prepared by UBS Limited and distributed by UBS Limited and UBS Italia Sim S.p.A UBS Italia Sim
S.p.A. is regulated by the Bank of Italy and by the Commissione Nazionale per le Società e la Borsa (CONSOB). Where an analyst of UBS Italia Sim S.p.A. has contributed to this report, the
report is also deemed to have been prepared by UBS Italia Sim S.p.A South Africa: UBS South Africa (Pty) Limited (Registration No. 1995/011140/07) is a member of the JSE Limited, the
South African Futures Exchange and the Bond Exchange of South Africa. UBS South Africa (Pty) Limited is an authorised Financial Services Provider. Details of its postal and physical address
and a list of its directors are available on request or may be accessed at http:www.ubs.co.za. United States: Distributed to US persons by either UBS Securities LLC or by UBS Financial
Services Inc., subsidiaries of UBS AG; or by a group, subsidiary or affiliate of UBS AG that is not registered as a US broker-dealer (a ’non-US affiliate’), to major US institutional investors only.
UBS Securities LLC or UBS Financial Services Inc. accepts responsibility for the content of a report prepared by another non-US affiliate when distributed to US persons by UBS Securities LLC
or UBS Financial Services Inc. All transactions by a US person in the securities mentioned in this report must be effected through UBS Securities LLC or UBS Financial Services Inc., and not
through a non-US affiliate. Canada: Distributed by UBS Securities Canada Inc., a subsidiary of UBS AG and a member of the principal Canadian stock exchanges & CIPF. A statement of its
financial condition and a list of its directors and senior officers will be provided upon request. Hong Kong: Distributed by UBS Securities Asia Limited. Singapore: Distributed by UBS Securities
Pte. Ltd or UBS AG, Singapore Branch. Japan: Distributed by UBS Securities Japan Ltd to institutional investors only. Australia: Distributed by UBS AG (Holder of Australian Financial
Services Licence No. 231087) and UBS Securities Australia Ltd (Holder of Australian Financial Services Licence No. 231098) only to ‘Wholesale’ clients as defined by s761G of the
Corporations Act 2001. New Zealand: Distributed by UBS New Zealand Ltd. China: Distributed by UBS Securities Co. Limited.
The disclosures contained in research reports produced by UBS Limited shall be governed by and construed in accordance with English law.
UBS specifically prohibits the redistribution of this material in whole or in part without the written permission of UBS and UBS accepts no liability whatsoever for the actions of third parties in this
respect. © UBS 2008. The key symbol and UBS are among the registered and unregistered trademarks of UBS. All rights reserved.
ab