slike bài giảng quản trị ngân hàng chương 10measuring and evaluating the performance of banks and their principal competitors
Bạn đang xem bản rút gọn của tài liệu. Xem và tải ngay bản đầy đủ của tài liệu tại đây (19.67 MB, 58 trang )
William Chittenden edited and updated the PowerPoint slides for this edition.
MEASURING &
EVALUATING THE
PERFORMANCE OF BANKS
Chapter 10
Key topics
1. Stock values and profitability ratios
2. Measuring credit, liquidity, and other risks
3. Measuring operating efficiency
4. Performance of competing financial firms
5. Size and location effects
6. The UBPR and comparing performance
6-2
Banks’ key objectives
1. Maximizing the bank value
2. Controlling wide-range risks
Value of the bank’s stock
6-4
Value of a bank’s stock rises when:
Expected dividends increase
Risk of the bank falls
Market interest rates decrease
Combination of expected dividend increase and risk
decline
6-5
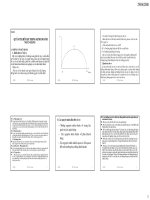
Value of bank’s stock
if earnings growth is constant
g -r
D
P
1
0
=
6-6
Key profitability ratios in banking
Assets Total
IncomeInterest Net
Assets Total
expense)Interest -
income(Interest
Margin Interest Net ==
Assets Total
Incomet NoninteresNet
Assets Total
expensest Noninteres-
PLLL-
revenuet Noninteres
Margin t NoninteresNet ==
Net Income
Return on Equity Capital (ROE) =
Total Equity Capital
Net Income
Return on Assets (ROA) =
Total Assets
6-7
Key profitability ratios in banking (cont.)
gOutstandin SharesEquity Common
TaxesAfter IncomeNet
(EPS) SharePer Earnings =
Total Interest Income __ Total Interest Expense
Earnings Spread = Total Earning Assets Total Interest Bearing
Liability
6-8
Assets Total
Expenses Operating Total
- Revenues Operating Total
Margin OperatingBank Net =
Assets Total
Assets Earning
Base Earning =
Breaking down ROE
N e t P r o f i t M a r g i n =
N e t I n c o m e / T o t a l O p e r a t i n g R e v e n u e
A s s e t U t i l i z a t i o n =
T o t a l O p e r a t i n g R e v e n u e / T o t a l A s s e t s
R O A =
N e t I n c o m e / T o t a l A s s e t s
E q u i t y M u l t i p l i e r =
T o t a l A s s e t s / E q u i t y C a p i t a l
R O E = N e t I n c o m e / T o t a l E q u i t y C a p i t a l
x
x
6-9
Return on equity (ROE = NI / TE)
… the basic measure of stockholders’ returns
ROE is composed of two parts:
Return on Assets (ROA = NI / TA),
represents the returns to the assets the bank has
invested in
Equity Multiplier (EM = TA / TE),
the degree of financial leverage employed by the
bank
Return on assets (ROA = NI / TA)
…can be decomposed into two parts:
• Asset Utilization (AU) → income generation
• Expense Ratio (ER) → expense control
ROA = AU - ER
= (TR / TA) - (TE / TA)
Where:
TR = total revenue or total operating income
= Int. inc. + Non-int. inc. + SG and
TE = total expenses
= Int. exp. + Non-int. exp. + PLL + Taxes
ROA is driven by the bank’s ability to:
…generate income (AU) and control expenses (ER)
Income generation (AU) can be found on the UBPR
(page 1) as:
TA
losses)( gainsSec
TA
Inc.int. Non.
TA
Inc.Int.
AU ++=
Expense control (ER) can be found on the UBPR
(page 1) as:
TA
PLL
TA
.Exp.intNon
TA
.Exp.Int
ER
*
+
−
+=
Note, ER* does not include taxes.
ROE depends on:
Equity multiplier=Total assets/Total equity capital
Leverage or financing policies: the choice of sources of funds (debt
or equity)
Net profit margin=Net income/Total operating revenue
Effectiveness of expense management (cost control)
Asset utilization=Total operating revenue/Total assets
Portfolio management policies (the mix and yield on assets)
6-13
INCOME
Return to the Bank
ROA = NI / TA
EXPENSES
Rate
Composition (mix)
Volume
Interest
Overhead
Prov. for LL
Taxes
Fees and Serv Charge
Trust
Other
Rate
Composition (mix)
Volume
Interest
Non Interest
Salaries and Benefits
Occupancy
Other
Bank Performance Model
Bank Performance Model
Returns to
Shareholders
ROE = NI / TE
Returns to
Shareholders
ROE = NI / TE
Degree of Leverage
EM =1 / (TE / TA)
Expense ratio (ER = Exp / TA)
… the ability to control expenses
Interest expense / TA
Cost per liability (avg. rate paid)
Int. exp. liab. (j) / $ amt. liab. (j)
Composition of liabilities
$ amt. of liab. (j) / TA
Volume of int. bearing debt and equity
Non-interest expense / TA
Salaries and employee benefits / TA
Occupancy expense / TA
Other operating expense / TA
Provisions for loan losses / TA
Taxes / TA
Asset utilization (AU = TR / TA):
… the ability to generate income.
Interest Income / TA
Asset yields (avg. rate earned)
Interest income asset (i) / $ amount of asset (i)
Composition of assets (mix)
$ amount asset (i) / TA
Volume of Earning Assets
Earning assets / TA
Noninterest income / TA
Fees and service charges
Securities gains (losses)
Other income
Determinants
of ROE in a
financial firm
6-17
Components of ROE for all insured U.S.
Banks (1992-2007)
6-18
A variation on ROE
Net Income Pre-Tax Net Operating Income
ROE =
Pre-Tax Net Operating Income Total Operating Revenue
× ×
Total Operating Revenue Total Assets
Total Assets Total Equity Capital
×
ROE = Tax Management Efficiency
Expense Control Efficiency
Asset Management Efficiency
Funds Management Efficiency
×
×
×
6-19
Breakdown of ROA
6-20
Financial ratios
…PNC and Community National Bank
UBPR for PNC
Interest expense
…composition, rate and volume effects for PNC and
Community National Bank
Interest income
…composition, rate and volume effects for
PNC and Community National Bank
Quick quiz
1. What individuals or groups are likely to be interested in the
banks’ level of profitability and exposure to risk?
2. What are the principal components of ROE, and what does
each of the these components measure?
3. Suppose a bank has an ROA of 0.80% and an equity
multiplier of 12x. What is its ROE? Suppose this bank’s
ROA falls to 0.60%. What size equity multiplier must it
have to hold its ROE unchanged?
4. What are the most important components of ROA and what
aspects of a financial institution’s performance do they
reflect?
6-24
Bank risk
…Popular measures of overall risk
1. Standard deviation (σ) or variance (σ
2
) of stock
price
2. Standard deviation or variance of net income
3. Standard deviation or variance of ROE & ROA
The higher σ and σ
2
,
the greater the overall risk