lean manufacturing management- the relationship between practice and firm level financial performance
Bạn đang xem bản rút gọn của tài liệu. Xem và tải ngay bản đầy đủ của tài liệu tại đây (1005.56 KB, 237 trang )
LEAN MANUFACTURING MANAGEMENT: THE RELATIONSHIP BETWEEN
PRACTICE AND FIRM LEVEL FINANCIAL PERFORMANCE
DISSERTATION
Presented in Partial Fulfillment of the Requirements for the Degree Doctor of
Philosophy in the Graduate School of The Ohio State University
By
Eric Oscar Olsen, B.S., M.B.A., M.A.
*****
The Ohio State University
2004
Dissertation Committee:
Approved by
Professor Peter T. Ward, Advisor
Professor William L. Berry
______________________________
Professor David A. Collier Advisor
Graduate Program in Business Administration
Professor Anil K. Makhija
ii
ABSTRACT
The relationship between lean manufacturing management practices and business
financial performance is examined through the use of empirical surveys and archival
accounting data from Compustat and stock return data from CRSP. A sample frame
of small to medium sized discrete product and process manufacturing companies
reporting participation in only one four-digit SIC was identified as the sample frame.
The five-year (1998-2002) financial performance for these companies was analyzed
at the operations and business levels using a median z-score comparing median firm
performance with the median performance of a matched portfolio of firms.
Operations measures included asset and employee productivity, gross margin ratio
and two measures of aggregate cycle time. Business measures included return on
equity (ROE), sales growth, and stock return. A web-based survey was used to
collect data on seven lean practices including just-in-time production management,
statistical process control, total productive maintenance, group technology, employee
involvement, supplier communication, and customer involvement. Forty-two
responding firms were classified as being either lean or non-lean based on a cluster
analysis of factor scores. The results demonstrated that lean practices act as a
synergistic, mutually supportive set rather than linearly additive individual practices
iii
in affecting operations financial performance. Lean classification was associated
with better total and cash-to-cash cycle times, but was not related to either better or
worse asset or employee productivity. Lean firms also tended to have narrower grow
margins than non-lean firms. With respect to business level performance, lean firms
tend to have better ROE, but no relationship was found with respect to either stock
return or sales growth. Of all the lean practices tested only employee involvement
demonstrated a significant relationship to business level performance. Firms with
high ROE tend to have high employee involvement. A literature review topology is
presented to demonstrate the need for studies combining empirical survey data and
archival measures of performance. Opportunities for future research are outlined.
iv
Dedicated to Dawn, Kaitlin, and Skylar;
whose love and support has made all the difference.
v
ACKNOWLEDGMENTS
A debt of gratitude is owed to my committee for allowing me to take the road “less
traveled by.” I especially thank Peter Ward for guiding me down the path of lean
performance measurement, Bill Berry for pointing out the parallels between lean
management ideals and value investing, Dave Collier for his support of cycle time as a
critical measure, and Anil Makhija for guidance in financial performance measurement.
This work could not have been accomplished without the support of my peer doctoral
students at the Fisher College of Business. This is especially true of three individuals
who put down their own work to help me with mine. I thank Stefan Hocke for putting
together a web site while I was trying to determine how to collect data without one,
Sebastian Garcia-Dastugue for helping my daughter Kaitlin and I create an Access
database and putting up with our novice questions, and Maurice Reid for reviewing my
work while studying for his own general exam.
In regards to getting my survey done, I thank the Ohio State Center for Survey Research
for their insights and assistance in collecting data. I thank the Center for Excellence in
Manufacturing Management for their sponsorship of my survey.
vi
A person could not ask for a better extended family. I acknowledge the love and
influence of my father, John Olsen, who knows no fear when it comes to tackling a
project and my mother, Alta, whose sense of humor made those projects bearable. The
Morgan Orchard represents the road less traveled for a previous generation. Addie and
Marshall Ritter provided a constant source of refuge and strength as well as a rigorous
review of a draft manuscript.
Finally, I would like to thank the friends, friends of friends, significant others, and kids
who attended the weekly happy hours over the 5 years I was in the PhD program at Ohio
State. You are welcome to come over any Friday night.
vii
VITA
February 25, 1957 Born – East Orange, New Jersey
Education
1979 B.S. Forest Engineering, University of Maine at Orono
1987 M.B.A. Virginia Polytechnic Institute and State University
2002 M.A. Business Administration, The Ohio State University,
Fisher College of Business
1999 – 2003 Graduate Teaching and Research Associate, The Ohio State
University
2004 – Present Lecturer, California Polytechnic State University, San Luis
Obispo, California
Industry
1979– 1981 Engineer, Caterpillar Tractor Company, Peoria, Illinois
1982 – 1988 Engineering Manager, Litton Industries, Blacksburg,
Virginia
1988 – 1999 Engineering, Production, Education Manager, Hewlett
Packard/Agilent Technologies, San Jose, California
viii
FIELDS OF STUDY
Major Field: Business Administration
Concentration: Operations Management
Minor Field: Management of Human Resources
ix
TABLE OF CONTENTS
Page
Abstract……………………………………………………………………………………ii
Dedication……………………………………………………………………………… iii
Acknowledgements……………………………………………………………………….iv
Vita……………………………………………………………………………………… v
List of Tables…………………………………………………………………………… vi
List of Figures ………………………………………………………………………… vii
Chapters:
1
Introduction ……………………………………………………… 1
1.1 Research background …………………………………………… 1
1.2 Research problem …………………………………………… … 5
1.3 Research method ………………………………………………… 7
1.4 Importance and contribution of research ………………………… 10
1.5 Organization of the dissertation ……………………………… …. 12
2
Literature review ……………………………………………….…. 13
2.0 Objectives and map of domain ……………………………… …. 13
2.1 Survey-perceptual (category 1) studies ……………………… … 21
2.1.0 Description and objectives …………………………………… …. 21
2.1.1 Lean practice measurement ……………………………………… 23
2.1.2 Lean operations performance measurement ………………… … 25
2.1.3 Summary ……………………………………………………….…. 28
2.2 Announcement-archival (category 2) studies ………………….… 28
2.2.0 Description and objectives …………………………………… …. 28
2.2.1 Lean company identification ………………………………… … 29
2.2.2 Lean financial performance measurement …………………… …. 32
2.2.2.1 Operations measures ………………………………………….… 32
2.2.2.2 Business measures …………………………………………… … 35
2.2.3 Methods of financial performance analysis ………………………. 38
2.2.3.1 Comparison formation …………………………………………… 38
x
2.2.3.2 Measures of central tendency ………………………………….… 40
2.2.3.3 Comparison time span …………………………………………… 41
2.2.3.4 Methods of analysis ……………………………………………… 42
2.2.4 Summary ………………………………………………………… 43
2.3 Survey-archival (category 3) studies ………………………… … 44
2.3.0 Description and objectives …………………………………… …. 44
2.3.1 Performance measurement …………………………………….… 45
2.3.2 Practice measurement ………………………………………….… 46
2.3.3 Methods of analysis ……………………………………………… 47
2.4 Summary and literature-based justification for study …………… 49
3
Research Propositions……………………………………………… 51
3.0 Research propositions – objectives …………………………….…. 51
3.1 Lean archetype versus operations financial performance (P1) … 53
3.1.1 Theoretical support …………………………………………….… 53
3.1.2 Empirical support …………………………………………… … 55
3.2 Individual lean practice versus operations financial
performance (P2) ………………………………………………… 58
3.2.1 Relationship to Simple Linear Combinations of Practices …….… 58
3.2.1.1 Theoretical Support ……………………………………………… 58
3.2.1.2 Empirical Support …………………………………………… …. 59
3.2.2 Relationship between individual practice and performance
measures ……………………………………………………….… 60
3.3 Lean archetype versus business financial performance (P3) … …. 62
3.3.1 Theoretical support …………………………………………….… 62
3.3.2 Empirical support …………………………………………… … 66
3.4 Individual lean practices versus business financial performance
(P4) …………………………………………………………….… 68
3.4.1 Relationship to simple linear combinations of practices ………… 68
3.4.1.1 Theoretical support …………………………………………….… 68
3.4.1.2 Empirical support …………………………………………… … 69
3.4.2 Relationship between individual practice and performance
measures ……………………………………………………….… 70
3.5 Lean operations versus business financial performance (P5) ….…. 71
3.6 Summary ……………………………………………………….…. 72
4
Methods …………………………………………………………… 73
4.0 Methods – objectives ……………………………………………… 73
xi
4.1 Sample frame ……………………………………………………… 77
4.1.0 Objectives …………………………………………………………. 77
4.1.1 Availability of archival financial data …………………………… 78
4.1.2 Business scope …………………………………………………… 79
4.1.3 Size restriction …………………………………………………… 80
4.1.4 Industry group …………………………………………………… 80
4.1.5 Years of data available ……………………………………………. 82
4.2 Financial performance variables ………………………………… 82
4.2.0 Objectives …………………………………………………………. 82
4.2.1 Business financial performance variables ………………………… 85
4.2.1.1 Return on equity (ROE) ………………………………………… 86
4.2.1.2 Sales growth (SG) ………………………………………………… 87
4.2.1.3 Stock return (SR) ………………………………………………… 88
4.2.2 Operations financial performance variables …………………… 90
4.2.2.1 Asset productivity – return on cash-adjusted assets (ROCA) …… 90
4.2.2.2 Employee productivity (EP) ………………………………………. 91
4.2.2.3 Gross margin ratio (GMR) ……………………………………… 92
4.2.2.4 Cycle time ………………………………………………………… 92
4.2.2.4.1 Cash-to-cash cycle time (CTC) …………………………………… 94
4.2.2.4.2 Total cycle time (CTT) ……………………………………………. 95
4.2.2.4.3 Inventory cycle time (CTI) ……………………………………… 95
4.2.2.4.4 Accounts receivable cycle time (CTR) …………………………… 96
4.2.2.4.5 Accounts payable cycle time (CTP) ………………………………. 96
4.2.3 Financial performance median z-score calculation ……………… 97
4.3 Lean manufacturing practice variables …………………………… 102
4.3.0 Objectives …………………………………………………………. 102
4.3.1 Survey instrument ………………………………………………… 103
4.3.2 Data collection ……………………………………………………. 104
4.3.3 Survey sample validation …………………………………………. 108
4.3.3.1 Sample frame representativeness …………………………………. 109
4.3.3.2 Response bias …………………………………………………… 110
4.3.4 Practice construct formulation ……………………………………. 112
4.3.4.1 Factor analysis …………………………………………………… 113
4.3.4.2 Construct reliability ……………………………………………… 115
4.3.4.3 Factor measurement ………………………………………………. 115
4.3.5 Lean archetype formation …………………………………………. 116
4.3.5.1 Cluster analysis …………………………………………………… 117
4.3.5.1.1 Cluster results …………………………………………………… 119
4.3.5.1.2 Cluster validation …………………………………………………. 121
4.4 Relationship analysis ……………………………………………… 127
xii
4.4.0 Objective ………………………………………………………… 127
4.4.1 Relationship between lean archetypes and operations
financial performance …………………………………………… 128
4.4.2 Relationship between individual lean practices and operations
financial performance……………………………………………… 128
4.4.3 Relationship between lean archetypes and business financial
Performance ………………………………………………………. 129
4.4.4 Relationship between individual lean practices and business
financial performance …………………………………………… 129
4.4.5 Relationship between lean operations and business financial
Performance ………………………………………………………. 130
4.5 Summary ………………………………………………………… 131
5
Results ……………………………………………………………… 134
5.0 Results – objectives and overview ……………………………… 134
5.1 Lean versus operations financial performance (L-O) …………… 137
5.1.1 Variable description ………………………………………………. 137
5.1.1.1 Lean practice ……………………………………………………… 137
5.1.1.2 Operations financial performance ………………………………… 138
5.1.2 Analysis and results ……………………………………………… 138
5.1.2.1 Lean archetype versus operations financial performance ………… 139
5.1.2.2 Individual lean practice versus operations financial
Performance ………………………………………………………. 143
5.1.2.3 Lean versus operations performance summary …………………… 144
5.2 Lean versus business financial performance (L-B) ……………… 145
5.2.1 Variable description ………………………………………………. 145
5.2.2 Analysis and results ……………………………………………… 145
5.2.2.1 Lean archetype versus business financial performance ………… 145
5.2.2.2 Individual lean practice versus business financial performance … 148
5.2.3 Lean versus business performance summary …………………… 150
5.3 Lean operations versus business financial performance (O-B) …… 152
5.3.1 Overview ………………………………………………………… 152
5.3.2 Analysis and results ……………………………………………… 153
5.4 Summary ………………………………………………………… 160
6
Discussion ………………………………………………………… 161
6.0 Discussion – objectives and overview ……………………………. 161
6.1 Lean archetype practice composition …………………………… 161
xiii
6.2 Lean versus operations financial performance (L-O) …………… 164
6.3 Lean versus business financial performance (L-B) ……………… 170
6.4 Lean operations versus business financial performance (O-B) …… 173
6.5 Threats to validity …………………………………………………. 174
6.5.0 Objectives …………………………………………………………. 174
6.5.1 Threats to statistical conclusion validity ………………………… 174
6.5.2 Threats to internal validity ……………………………………… 177
6.5.3 Threats to external validity ……………………………………… 180
6.6 Summary ………………………………………………………… 182
7
Conclusion ………………………………………………………… 184
7.1 Research objective ………………………………………………… 184
7.2 Key findings ………………………………………………………. 186
7.3 Managerial implications ………………………………………… 190
7.3.0 Overview and objectives ………………………………………… 190
7.3.1 Lean implementation ……………………………………………… 190
7.3.2 Absolute magnitude of lean effects ….……………………………. 192
7.4 Future research ……………………………………………………. 194
Bibliography ……………………………………………………………………… 197
Appendices ……………………………………………………………………… 204
Appendix A - Complete listing of sample frame companies with 2001 data………. 204
Appendix B – Survey of manufacturing practices …………………………………. 210
Appendix C - Example initial solicitation letter …………………………………… 212
Appendix D - Example follow-up letter …………………………………………… 215
Appendix E - Sample of rankings and percentile performance rating viewable
upon completion of the web based survey by respondents …………. 218
Appendix F - Full factor loading and factor score matrix for lean practices ………. 219
xiv
LIST OF TABLES
Table Page
2.1 Practice and performance coverage of key studies …………………….…. 19
2.2 Other relevant features of practice performance studies …………………. 20
2.3 Lean practices – frequency and significance in recent OM literature ……. 22
2.4 Major practice constructs for lean operations ………………………….…. 25
2.5 Performance measures – frequency and significance in recent OM
literature ……………………………………………………………… …. 27
2.6 Performance measures used in archival data studies ………………… …. 35
3.1 First order mechanisms connecting lean “seven wastes” to operations
financial measures ………………………………………….…………… 58
3.2 Lean practices and financial performance measures ………………… …. 62
4.1 Research methods overview and highlights ………………………… …. 74
4.2 Summary of descriptive characteristics for firms included in the sample
frame. Data is for fiscal year 2001 ………………………………………
78
4.3 Financial performance measures …………………………………………. 85
4.4 Reference list of Compustat data descriptions …………… …………… 87
4.5 Descriptive statistics for sample frame financial performance pseudo
z-scores …………………………………………………………… …… 100
4.6 Lean practices included in this study …………………………………… 103
4.7 Descriptive statistics by survey response category ……………………… 108
4.8 Comparison of sample and sample frame statistics ………………………. 110
xv
4.9 Self reported respondent titles sorted by frequency ………………………. 112
4.10 Factor analysis items, loading, factor score weights and reliability ….…… 114
4.11 Mean values for two and three cluster analysis solutions ………………… 120
4.12 Structure matrix for lean and non-lean cluster discriminant function …… 125
4.13 Median z-scores for operations financial performance variables …………. 126
5.1 Lean versus non-lean firm median z-score differences for the original
sample and resampled data with replacement …………………………… 143
5.2 Lean cluster difference test results for business financial performance … 146
5.3 Comparisons between above and below competitive median business
financial performers with respect to lean practice level ………………… 150
5.4 Survey sample data ranges versus non-respondent data pre- and post-
trimming ………………………………………………………………… 156
5.5 Business financial performance differences for lean and non-lean firms
predicted by lean financial signature models …………………………… 156
5.6 Business financial performance differences for lean and non-lean firms by
lean financial signature models and probability cutoff level …………… 156
5.7 Predicted differences in financial performance variables using Model 2
(CTT) ……………………………………………………………………… 158
6.1 Threats to statistical conclusion validity … ….….….….….….….….…… 175
6.2 Threats to internal validity ….….….….….….….….….….….….….…… 177
6.3 Threats to external validity ….….….….….….….….….….….….….……. 180
xvi
LIST OF FIGURES
Figures Page
1.1 Research frame and relationship diagram ….….….….….….….….….… 7
2.1 Practice-performance literature domain typology and categories ….….… 18
3.1 Diagram of research propositions ….….….….….….….….….….….….… 52
3.2 Modified DuPont model (Boyd, 1996) ….….….….….….….….….….… 66
4.1 Block diagram of research design ….….….….….….….….….….….….… 74
4.2 Relationship between cycle time measures used in this study ….….….… 94
4.3 Box plots for business performance measure z-scores ….….….….….… 101
4.4 Box plots for operations performance measure z-scores ….….….….….… 102
4.5 Binary logit models predicting cluster membership including cash-to-cash
cycle time (a) or total cycle time (b) ….….….….….….………………… 127
5.1 Relationships between variables investigated ….….….….….….….….… 137
5.2 Plots of lean (L) and non-lean (N) clusters’ operations financial
performance (i.e. ROCA, EP, GMR) ….….….….….….….….….….….… 142
5.3 Plots of lean (L) and non-lean (N) clusters’ cycle time operations
financial performance ….….….….….….….….….….….….….….….…… 142
5.4 Plots of lean (L) and non-lean (N) clusters versus business financial
performance measures ….….….….….….….….….….….….….….….…
147
5.5 Binary logit model predicting above (Hi) or below (Lo) competitive
median ROE performance ….….….….….….….….….….….….….….… 151
5.6 Plots of above (Hi) and below (Lo) competitive median ROE groups
for lean practice scores on SCM and EMP (Data) ….….….….….….…….
151
xvii
5.7 Binary logit model predicting cluster membership with total cycle time,
gross margin ratio, and their interaction ….….….….….….….….……… 159
7.1 Proposed lean implementation model based on study results ….….….… 192
1
CHAPTER 1
INTRODUCTION
1.1 Research Background
Both operations management literature and common sense contend that implementing
best practices on the factory floor inevitably results in improved business level financial
performance. However, empirical research studies fall short in consistently
substantiating this relationship with respect to the broad set of operations commonly
known as “lean manufacturing” practices. Lean manufacturing may be considered as a
synergistic set of integrated modern manufacturing management practices commonly
classified under subsets of just-in-time (JIT), total quality management (TQM), total
productive maintenance (TPM), and a collection of supportive human resource
management practices including teamwork and employee empowerment. Lean
manufacturing encompasses such practices as employee involvement in problem solving,
statistical process control (SPC), reengineering setups, cellular manufacturing, supplier
information sharing and partnership, supply base rationalization, pull production, worker
teams, integrated product design, in-house designed technology, and customer
requirements integration.
2
The Toyota Motor Corporation offers a preeminent example of a successful lean
manufacturer (Bremner & Dawson, 2003; Drickhamer, 2004; Womack, Jones, & Roos,
1991). For 50 years, Toyota has continuously improved its version of lean practice under
the banner “Toyota Production System (TPS).” TPS performance positions Toyota to
rival DaimlerChrysler, Ford, and General Motors for world auto market domination. A
recent BusinessWeek cover article points out that although other auto manufacturers may
surpass the auto maker’s individual performance measures, “no car company is as strong
as Toyota in so many areas….Its operating profit margin of 8% now dwarfs those of
Detroit’s Big Three” (Bremner & Dawson., 2003). Not surprisingly, Toyota’s financial
and market success relies largely on lean manufacturing management practices.
Nevertheless, the proof that lean works for the broad spectrum of manufacturing firms is
specious. Even as practitioners attest that proof exists, studies by both operations
management (OM) and finance researchers have proven inconsistent in establishing a
significant positive relationship between lean practices and archival business financial
performance. In all fairness, most research studies find a positive association with at
least one or two financial measures. Reductions in some form of inventory consistently
occur in lean implementations. Yet measures of return on assets (ROA), return on sales
(ROS), return per employee, and profit margin prove inconsistent.
The ambiguity of even “good” empirical research on this question results from three
problems. The first relates to the managerial perceptions of performance typically used
as the dependent variable in operations management empirical studies. Managers assess
3
one or more of the following: performance relative to competitors, change in
performance, internal goal, and absolute performance for specific measures. Surveys
asking both practice and performance questions of the same manager run a high risk of
encouraging biased responses. Most studies of this nature find a positive relationship
between lean practices and perceived financial performance. Managers who are
responsible for, or involved in, implementing lean practices may tend to notice only those
performance indicators that affirm their belief. An independent source of performance
data is required to enhance the validity of these research studies.
The second problem occurs in accounting and finance studies of the practice-performance
relationship. These studies rely on more objective, archival sources of financial
performance data along with rigorous statistical analysis of that data. These studies tend
to lack clarity in defining what they consider either a lean or a non-lean firm. They
depend on public announcements or other forms of self-identification as indicators of
implementing specific practices. Not surprisingly, these studies arrive at mixed results.
The third problem concerns the practice of measuring lean practices individually, or in
limited subsets, to gauge their relationship to performance. This research maintains that
lean practices act as a synergistic whole in affecting operations and financial
performance. Therefore, it is not unusual that research studying the individual effects of
JIT, TQM, or TPM as subsets of practices often fall short of accounting for significant
changes in financial performance.
4
The major contribution of this research is to more definitively assess the practice-
performance relationship by using both well-validated practice survey questions (for
assessing the actual level of lean implementation) and archival performance data.
Standard and Poor’s Compustat
1
and the Chicago Graduate School of Business’ Center
for Research in Security Prices (CRSP)
2
databases provide independent sources of
historical accounting, operations, and business financial performance data. Thus, this
research study uses the most applicable techniques from both research streams while
overcoming major obstacles that each face separately.
The managerial relevance for removing ambiguities from causal connection between
practice and performance are undeniable. The prescriptive usefulness of operations
management research depends on the resultant ability to advise a manager, “Do this, and
your results will improve.” Lean practice implementation that can be shown to lead to
financial results that operations managers, accountants, and financial officers all
appreciate, can pave the way for more companies to “become lean.” An implied
connection exists between the focus of lean on reducing non-value adding activities (i.e.
waste reduction) to “make value flow” (Womack & Jones, 1996) and the criteria for good
1
“Standard & Poor's Compustat, a division of McGraw-Hill, Inc, is the premier supplier of financial
information and produces a variety of databases and software products for institutional investors, financial,
and corporate clients…Compustat is a database of financial, statistical, and marketing information
providing more than 300 annual and 100 quarterly Income Statement, Balance Sheet, Statement of Cash
Flows, and supplemental data items on more than 24,000 publicly held companies.” Wharton Research
Data Services; Oct 2003.
2
“The Center for Research in Security Prices (CRSP) maintains the most comprehensive collection of
standard and derived security data available for the NYSE, AMEX and Nasdaq Stock Market. CRSP is a
research center at the University of Chicago Graduate School of Business and maintains historical data
spanning from December 1925 to the present. CRSP's trademark unique issue identifiers tracks a
continuous history of securities and provides a seamless time-series examination of the issue's history.”
Wharton Research Data Services; Oct 2003.
5
investment and management practice held by value investors, such as Warren Buffet
(Graham, 1949; Graham & Dodd, 1934; Vick, 2001). Buffet uses a company’s long-term
ability to maintain a high, stable return on equity as a primary indicator of the company’s
ability to generate value for its shareholders (Vick, 2001).
1.2 Research Problem
This study addresses the general question, “Do lean manufacturing management practices
improve financial performance?” This question subsumes several preliminary questions
concerning what types and implementation levels of practices constitute “lean practice”
and financial performance. As mentioned earlier, this study views lean as a synergistic
set of mutually supportive and integrated management practices. The research confirms
and measures the relative composition of the lean practice set by identifying lean and
non-lean archetypes within a well-defined sample frame of manufacturing companies.
Specifically, this research examines whether lean practices as a set, or as individual,
specific lean practices as reflected in survey data are related to two levels of sustained
financial performance (the operations and the business level). At the operations level,
Compustat data is used to assess performance by measuring five-year median asset and
employee productivity, gross profit margin, and total cycle time. At the business level,
return on equity (ROE) and sales growth are measured using Compustat data and stock
return performance is assessed using CRSP data.
The study tests several research propositions to systematically analyze the question of
whether lean practices affect financial performance. These propositions are structured by
6
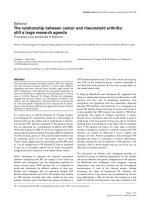
articulating the problem as a need to understand the dyadic relationships between three
ideas: lean practice, operations financial performance, and business financial
performance (Figure 1.1). The first to be examined is the relationship between lean
practice and either operations financial performance (L-O) or business financial
performance (L-B). Lean practice is tested in two ways for each practice-performance
relationship: both as a mutually supportive set of practices and as individual practices.
Next, the relationship between operations and business financial performance is tested
(O-B). This scheme results in the following abbreviated research propositions:
Proposition 1
: Lean archetypes tend to have better operations financial performance
than non-lean archetypes.
Proposition 2.1: The extent of lean practice implementation as measured in simple linear
combinations is not associated with operations financial performance.
Proposition 2.2: The implementation levels of all lean practices are positively associated
with all measures of operations performance.
Proposition 3
: Lean archetypes tend to have better business financial performance than
non-lean archetypes.
Proposition 4.1
: The extent of lean practice implementation as measured in simple linear
combinations is not associated with business financial performance.
Proposition 4.2: Implementation levels of all lean practices are positively associated with
all measures of operations performance.
7
Proposition 5
: Categorization as a lean archetype based on operations financial
performance is positively associated with business financial performance.
Research Frame
Lean
Practices
Business
Financial ($)
Performance
Operations
Financial ($)
Performance
“L-O”
“O-B”
“L-B”
Manufacturing
Companies
Figure 1.1: Research frame and relationship diagram.
1.3 Research Method
The approach taken to study the practice-performance problem combines the best aspects
of two research streams. From the operations management empirical research stream the
study derives its survey methodology and well-defined, validated multi-item constructs to
measure the extent of practice implementation in sample companies. From accounting
and finance research, it assumes a rigorous statistical approach to analysis and
measurement of financial performance. Combining perceptual practice measurement
8
from surveys with archival financial data enables this research to make substantive claims
with respect to its findings’ validity.
The research method included first adopting a sample frame of manufacturing companies
in four broad industry categories. To enhance the generalizability of the conclusions, the
categories range from discrete product to process industries. A strict selection criterion
required that the companies report participation in only one four-digit standard industry
classification. Along with a size restriction of fewer than 9000 employees, this criterion
served to ensure that survey responses were applicable to the performance of the firm as a
whole. A high-level company executive for each sample firm completed a survey
instrument with 36 questions (Appendix B) covering eight lean practices previously
validated in the research literature. The practice data were factor analyzed and used to
identify lean and non-lean firms through cluster analysis.
Archival financial data from 1998 to 2002 was used to measure long-term performance.
A robust, relative measure of financial performance was developed for each metric
financial measure used in the study. Measures were developed by identifying a
comparison portfolio of companies in the sample frame and calculating the difference
between the median 5-year performance for the sample firm and that of its matched
comparison portfolio. The relationships between lean and non-lean firms were compared
with respect to operations financial and business financial performance using non-
parametric statistics and logistic regression. As accounting and financial data is prone to