liquidity and yield spreads of corporate bonds
Bạn đang xem bản rút gọn của tài liệu. Xem và tải ngay bản đầy đủ của tài liệu tại đây (351.76 KB, 78 trang )
LIQUIDITY AND YIELD SPREADS OF CORPORATE BONDS
DISSERTATION
Presented in Partial Fulfillment of the Requirements for
the Degree Doctor of Philosophy in the Graduate
School of the Ohio State University
By
Sergei Ivanovich Tishchenko, M.A.
* * * * *
The Ohio State University
2004
Dissertation Committee:
Professor Anthony B. Sanders, Adviser
Professor Stephen A. Buser
Professor Anil K. Makhija
Approved by
Adviser
Graduate Program in Business
Administration
ii
ABSTRACT
Corporate bond bid-ask spreads explain 40 percent of the temporal variation in yield
spreads when daily individual bond data are used. Other known yield spread
determinants such as the level and slope of the treasury yield curve, aggregate equity
returns and implied volatility jointly explain only 10 percent of the yield spread
variation. On average, approximately 60 percent of the bid-ask spread is impounded
in the corporate yield spread. The estimates of the yield spread sensitivity to bid-ask
spread changes are remarkably stable across bonds with different Standard & Poor’s
credit grades ranging from AAA to CC. This evidence supports the view that
corporate bond liquidity is an important yield spread determinant.
iii
Dedicated to those who encourage others.
Correction does much, but encouragement does more.
Johann Wolfgang Von Goethe
The finest gift you can give anyone is encouragement. Yet, almost
no one gets the encouragement they need to grow to their full
potential. If everyone received the encouragement they need to
grow, the genius in most everyone would blossom and the world
would produce abundance beyond the wildest dreams.
Sidney Madwed
iv
ACKNOWLEDGMENTS
I would like to thank my dissertation committee – Professors Anthony B. Sanders,
Stephen A. Buser, and Anil K. Makhija – for their support throughout this project
and for their insightful ideas that enriched this work. I thank Vikram Kuriyan and
Joseph Cherian for their support at the final stages of this project. Without help of
Jean Helwege, this work would have never become possible. I am appreciative to
René Stulz for sparking and encouraging my interest in this research area. I thank my
friends Dena Overina, Elena Tuchina, and Anton Goldade for their help with the
manual data collection. They turned this tedious task into fun.
v
VITA
January 9, 1971……….…… Born, Alexandria, Ukraine
1993………………….………B.S., Physics, Moscow Institute of Physics and
Technology, Moscow, Russia
1996…………………….……M.A., Psychology, The Ohio State University
1997……………………….…M.A., Finance, The Ohio State University
May 2001- November 2002….Research Analyst, Putnam Investments, Boston
February 2002 – present…… .Senior Research Analyst, Banc of America Capital
Management, New York
FIELDS OF STUDY
Major Field: Business Administration
vi
TABLE OF CONTENTS
Abstract ii
Dedication………………………………………………………………………… iii
Acknowledgments iv
Vita v
List of Tables viii
List of Figures x
Chapters:
1 Liquidity and Yield Spreads of Corporate Bonds 1
1.1 Introduction 1
1.2 Related Literature ….5
1.2.1 Determinants and Properties of Yield Spreads 5
1.2.2 Liquidity, Asset Pricing, and Yield Spreads 10
1.3 Data 11
1.3.1 Sample Construction from the Warga Database 11
1.3.2 Treasury and Equity Index Data ……………… 16
1.3.3 Computation of the Yield Spreads ……………. 17
1.4 The Empirical Relationship Between Corporate Bond Yield Spreads
and Bid-Ask Spreads…………………………………… …………… …… 18
1.4.1 Theoretical Considerations………………………………….…………. 18
1.4.2 The Univariate Pooled Regression Model …………… 20
1.4.3 The Individual Bond Univariate Time-Series Regressions…………… 22
1.4.4 Multiple Determinants of the Yield Spreads……………………………25
1.5 Conclusions………………………………………………………………… 29
2 Liquidity and Yield Spreads of Corporate Bonds During the Financial Crisis
of 1998 30
vii
2.1 The Financial Crisis of 1998 30
2.1.1 Description of the Crisis 30
2.1.2 Fixed Income Markets During the Crisis of 1998 33
2.2 Description of the Data……………………………………………………… 35
2.2.1 Sample Construction from the Warga Database……………………… 35
2.2.2 Bloomberg Generic Bid and Ask Bond Prices…………………………. 35
2.2.3 Bloomberg Data Issues………………………………………………… 37
2.3 Corporate Bond Yield Spreads and Bid-Ask Spreads During the Crisis 39
2.3.1 Yield Spreads Increase During the Crisis 39
2.3.2 Corporate Bond Liquidity Proxies During the Crisis 40
2.4 Relationship Between the Bond Yield Spreads and Bid-Ask Spreads
During the Crisis…………………………………………………………… 44
2.5 Conclusions ….45
List of References ………………………… 46
Appendix A. Tables and Figures for Chapter 2…………………………………… 49
End Notes……………………………………………………………………………65
viii
LIST OF TABLES
Table
1.1 Yield Spread Determinants and Their Proxies …9
1.2 Descriptive Statistics of the Samples of Corporate Bonds… … ….14
1.3 Distribution of Bonds Across S&P Rating Classes ……………… 15
1.4 Pooled Time-Series Cross-Sectional Regression of the Corporate
Bond Yield Spread and Bid-Ask Spread Daily Changes …………… 21
1.5 Time-Series Regressions of the Corporate Yield Spread Daily
Changes on Bid-Ask Spread Changes………………………………… …23
1.6 Yield Spread Determinants and Predicted Signs of the Relationships……26
1.7 Time-Series Regressions of the Corporate Yield Spread Daily
Changes on Bid-Ask Spread Changes and Other Determinants………… 27
1.8 Time-Series Regressions of the Corporate Yield Spread Daily
Changes on the Typical Determinants Except Bid-Ask Spread Changes….28
A.1 Descriptive Statistics of the Corporate Bonds for Different Samples 50
A.2 Distribution of Bonds in the Samples Across S&P Credit Rating Classes 51
A.3 Means of the Yield Spread Monthly Changes…………………………… 52
A.4 Descriptive Statistics of the Bid-Ask Spread Levels Across
Rating Groups…………………………………………………………… 53
A.5 End-of-Month Means of the Bond Bid-Ask Yield Difference
Month-to-Month Changes 53
ix
A.6 Pooled Regression of Corporate Yield Spreads on Bid-Ask Spreads 54
A.7 Random Effects Regression of Yield Spreads on Bid-Ask Spreads 54
A.8 Cash Flows of High Yield Mutual Funds ……55
x
LIST OF FIGURES
Figure
1.1 Yield Spread of High Yield Bonds …4
A.1 Equal-Weighted Sample Average Yield Spread 56
A.2 Equal-Weighted Sample Average Bid-Ask Spread 57
A.3 Daily Yields on Treasury and Corporate Bonds in 1998 58
A.4 End-of-Month Yield Spreads of Corporate Bonds 59
A.5 Yield Spreads of Corporate Bonds 60
A.6 Bond Daily Bid-Ask Spreads by Credit Rating Group 61
A.7 Corporate Bond Market Activity During the Crisis of 1998 62
A.8 Bid-Ask Spread and Pricing Frequency 63
A.9 Bid-Ask Spread and Size of Bond Issue 64
1
CHAPTER 1
LIQUIDITY AND YIELD SPREADS
OF CORPORATE BONDS
1.1 Introduction
What factors determine the difference in yields between the corporate and
government debt is an important issue that has recently received much attention from
both the finance academics and practitioners. Understanding the difference between
the corporate and government bond yields, which is called yield spread
1
, is of
paramount importance in many practical situations. For instance, fixed income
portfolios of defaultable bonds, whose interest rate risk is hedged away by taking
short positions in Treasury securities, become very sensitive to yield spreads.
Therefore, the factors that drive yield spreads determine the risk of such portfolios,
and they require understanding and measurement.
2
The yields of corporate bonds should be higher than the government bond yields
for several reasons. One reason is the expected default loss. Some corporate bond
issuers will be unable to meet their debt repayment obligations, and in such event of
default, the bond investors will recover only a portion of their original investment. In
contrast, Treasury securities are considered to be virtually default-free. Investors,
therefore, should require a higher yield on corporate bonds relative to Treasuries.
Another reason for the yield spread is tax premium. Interest payments on corporate
bonds are subject to taxation at the state level whereas government bonds are free
from state taxes. This differential tax treatment contributes to the yield spread.
Bond liquidity is another salient yield spread determinant. Indeed, while the
Treasury debt market is one of the most liquid markets in the world, the secondary
market for corporate bonds is notorious for its illiquidity
2
. The corporate bond
market illiquidity exhibits itself in low trading volumes and high transaction costs,
and therefore should be reflected in bond prices and yields to compensate investors
for the related liquidity risks and costs of transacting. Recent advances in defaultable
bond pricing incorporate liquidity into the bond pricing models
3
. Empirical studies of
bond liquidity as a yield spread determinant have been very limited, however, mainly
due to data availability and data quality issues.
This paper is an empirical investigation of the relationship between the corporate
bond liquidity and yield spreads. The relationship is studied at the individual bond
level using daily corporate bond bid-ask spreads as a main liquidity proxy.
3
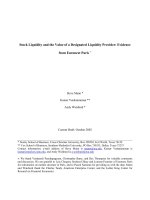
The importance of understanding the effects that bond liquidity has on corporate
yield spreads was highlighted by the financial crisis of 1998. During the crisis,
dramatic revaluations were observed in the fixed income markets. For example, only
in August 1998 the yield spread of the Merrill Lynch High Yield Master Index
4
increased by over 40 percent relative to its prior 5-year average. This is illustrated in
Figure 1.1. During the crisis, the opinion that liquidity was the dominant factor for
pricing defaultable bonds was a prevalent point of view expressed by many market
participants, including the following quotes by the Merrill Lynch Chief High Yield
Strategist:
“The most direct effect of the Asian crisis, which culminated in Russia’s default
on domestic debt, was the sharp rise in yield spreads…”
“Rise in risk premiums in emerging markets debt … spread to the investment-
grade and the high-yield sectors of the U.S. corporate bond market.”
“There’s been no wave of bankruptcies or credit problems, so the losses mystify
some people, but it’s been all liquidity.”
“A precipitous drop in liquidity, which caused the yield spread between low-
rated issues and Treasuries to widen sharply, produced a historically low
return.”
5
4
0%
1%
2%
3%
4%
5%
6%
7%
8%
9%
10%
11%
1988 1989 1990 1991 1992 1993 1994 1995 1996 1997 1998 1999 2000 2001 2002 2003
Yield Spread of Speculative Grade Bonds
12-Month Trailing Default Rate
Russian &
LTCM
Crises
Asian
Flu
Internet
Bub b le
Mexican
Teq uila
Crisis
Junk Bo nd
Market
Scandal
Figure 1.1. Yield Spread of High Yield Bonds.
Yield spread is the difference between the yield on the Merrill Lynch High Yield Master Index and
the 10-year Treasury rate. The Moody’s 12-month trailing default rate is calculated on the issuer
basis.
In this paper, the crisis of 1998 is used as a natural experiment for studying the
relationship between the corporate bond liquidity and yield spreads.
The rest of this chapter is organized as follows. The next section reviews the
related literature on the determinants and properties of yield spreads as well as on the
role of liquidity in pricing of assets. Then, I describe the data sources, sample
construction, and discuss the methodology. After that, I describe and discuss the
statistical tests and conclude.
5
1.2 Related Literature
1.2.1 Determinants and Properties of Yield Spreads
Beginning with the pioneering articles by Black and Scholes (1973) and Merton
(1974) different contingent claims models have been proposed for pricing corporate
liabilities
6
. However, the ability of this approach to explain yield spreads was
questioned by empirical work. Kim, Ramaswamy and Sundaresan (1993) note that
the conventional contingent claims model due to Merton (1974) is unable to generate
default premiums in excess of 120 basis points while over the 1926-1986 period the
yield spreads on Baa rated corporate bonds ranged from 51 to 787 basis points and
averaged 198 basis points. Recently, Eom, Helwege and Huang (2004) directly test
structural models of corporate bond pricing. The authors point out severe systematic
biases of these models in estimating corporate bond spreads. An important question
is how much liquidity premium, which is ignored in the contingent claims models,
affects yield spreads.
Empirical research aimed at discovering the determinants of yield spreads and
their relative contributions to the spreads dates back to the seminal work of Fisher
(1959), who formulated and empirically confirmed the hypothesis that the average
premium on a firm’s bonds depends on the risk that the firm will default and on the
bonds’ liquidity. Fisher (1959) uses the market value of all publicly traded bonds that
the firm has outstanding and bond trading volume as his liquidity proxies.
6
Cook and Hendershott (1978) investigate the relative contributions of taxes, risk,
and relative security supplies as the determinants of the movements of the long-term
Aa deferred-call utility bond spreads in 1961-1975. They find that the tax treatment
is the most important of these factors, and that relative security supplies lacks
support as a significant factor contributing to the observed spread. Buser and Hess
(1986) document a strong influence of the corporate default premium on the ratio of
tax-equivalent government yields.
Yawitz, Maloney, and Ederington (1985) develop a model of bond prices and
yield spreads that incorporates the effect of both taxes and differences in default
probabilities. Using the 1965-1981 data they find that the spread between the after-
tax yield on a taxable government bond and a prime grade municipal is
approximately four times as large as the spread between the yields on the prime and
medium grade municipal bonds, suggesting that the tax-free municipal bonds have
significant risk premiums embodied in their yields. Garman and Fridson (1996)
quantify the high yield market’s fluctuating riskiness in a regression of high yield
spreads on credit risk, illiquidity risk, and monetary conditions proxies. Pedrosa and
Roll (1998) study the nondiversifiable systematic risk in corporate bond credit
spreads. They point out that as investors alter their beliefs about the general outlook
for the economy, they reassess the probability of default for all corporate bonds. This
suggests that investors’ subjective perception of the overall economic conditions
may be an important factor in determining corporate yield spreads.
7
The relation between Treasury yields and corporate yield spreads conveys
information about the covariation between default-free discount rates and the
market’s perception of default risk. Duffee (1998) studies this relation using monthly
data on investment-grade corporate bonds from 1985 through 1995. He finds modest
negative relation, which is stronger for lower-rated bonds.
Elton, Gruber, Agrawal and Mann (2001) attempt to decompose the yield spread
into separate components due to expected default loss, tax premium, and non-
diversifiable systematic risk premium. The authors admit that “Liquidity may play a
role in the risk and pricing of corporate bonds”. However, they “…like other studies,
abstract from this influence.” Investigation of the liquidity effects is omitted
probably due to the lack of data to adequately proxy for liquidity.
Collin-Dufresne, Goldstein and Martin (2001) demonstrate that monthly changes
in such potential yield spread determinants as the riskless spot rate, the slope of the
yield curve, the bond-issuing firm leverage, the volatility of firm value, the
probability and magnitude of a downward firm value jump, and the business climate
– that should in theory determine credit spread changes – have limited explanatory
power. The authors find that regression residuals are driven by a single unidentified
common factor, which explains 70 percent of the variation in residuals. This
observation is interpreted as evidence that aggregate rather than firm-specific factors
are more important for credit spread changes and that the stock and bond markets
may be segmented. The authors use the following variables to proxy for corporate
bond liquidity. The first proxy is the proportion of actual versus estimated end-of-
8
month prices in the Warga (1998) corporate bond database. The second proxy is the
estimated changes in the on-the-run minus off-the-run 30-year Treasury yields are
used to measure liquidity. If liquidity decreases, the spread between the on-the-run
and off-the-run bonds increases. Finally, a relationship between the swap and
corporate bond markets is utilized. If liquidity in the swap market deteriorates, it is
likely that liquidity in the corporate bond market will deteriorate as well. All these
liquidity proxies are found to lack explanatory power – they are not significant in the
estimated regressions. Therefore, the authors conclude that “…the dominant
component of monthly credit spread changes in the corporate bond market is …
independent of both changes in credit risk and typical measures of liquidity.”
An overview of the different factors and their proxies used in prior studies to
explain yield spreads is given in Table 1.1.
9
Factors and Proxy Variables Article
Default Probability
Credit Ratings Collin-Dufresne, Goldstein, Martin (2001)
Firm’s Leverage Fisher (1959)
Collin-Dufresne, Goldstein, Martin (2001)
Volatility of Firm’s Income or Value Fisher (1959)
Time of Operations Without Default Fisher (1959)
Actual Default Rate Garman, Fridson (1996)
Index of Lagging Economic Indicators Fridson, Jónsson (1995)
Capacity Utilization Garman, Fridson (1996)
Recovery Ratio
Elton et al. (2001)
Tax Status
State Tax Rates Cook, Hendershott (1978); Elton et al. (2001)
Local Tax Rates Elton et al. (2001)
Liquidity
Bid-Ask Spread
Volume of Trading Fisher (1959)
Size of Bond Issue Fisher (1959); Crabbe, Turner (1995)
Mutual Fund Flows as % of Fund’s Assets Garman, Fridson (1996)
Liquid Assets as % of Total Fund’s Assets Garman, Fridson (1996)
% of actual vs. estimated prices in database Collin-Dufresne, Goldstein, Martin (2001)
On- vs. off-the-run Treasury yield spread Collin-Dufresne, Goldstein, Martin (2001)
Swap market liquidity Collin-Dufresne, Goldstein, Martin (2001)
Economic and Monetary Conditions
Treasury Yields/Curve Garman, Fridson (1996); Duffee (1998)
Houweling, Hoek, Kleinbergen (1999)
Christiansen (2000)
Stock Index Return Collin-Dufresne, Goldstein, Martin (2001)
Fama and French (1996) SMB factor Elton et al. (2001)
Change in CPI Garman, Fridson (1996)
M2-M1 Garman, Fridson (1996)
Bond Maturity
Helwege, Turner (1999)
Risk Aversion (Investor Confidence) Cook, Hendershott (1978)
Table 1.1. Yield Spread Determinants and Their Proxies.
This table summarizes the yield spread determinants studied in the finance literature and the variables
used to proxy for them.
10
1.2.2 Liquidity, Asset Pricing, and Yield Spreads
One of the first studies that incorporates liquidity into asset pricing is a paper by
Amihud and Mendelson (1986), who propose a model and empirically support its
prediction that the expected stock return is an increasing and concave function of the
bid-ask spread. Elaborating on their earlier work, Amihud and Mendelson (1991)
study the effects of liquidity on pricing of Treasury bonds. They find that the yields
of Treasury bills are lower than those of otherwise identical government notes in
their final coupon period by 70 to 110 basis points.
Empirical fixed-income microstructure research in general, and the liquidity
impact on pricing of risky bonds in particular, has been lagging behind due to the
lack of available data. There are several exceptions, however. Schultz (2001) “peeks
behind the curtain” of the corporate bond market by studying its trading costs and
practices. He reports the following findings: (1) the average round-trip trading costs
are about $0.27 per $100 of par value; (2) the costs are lower for larger trades; (3)
small bond dealers charge more; and (4) there is no evidence that lower-rated bonds
are more costly to trade.
Hotchkiss and Ronen (1999) use daily and hourly high yield bond transaction
prices to examine the informational efficiency of the corporate bond market relative
to the market for the underlying stock. They find that the relative informativeness of
high yield bond prices is driven largely by the bonds’ liquidity rather than by the
structure of the dealer market for corporate bonds.
11
Chakrawarty and Sarkar (1999) conduct a comparative study of liquidity in the
U.S. corporate, municipal and government bond markets. They find that after
controlling for other factors, the municipal bond realized bid-ask spread is higher
than the government bond spread by about 9 cents per $100 par value, but the
corporate bond spread is not. In the corporate and municipal markets the realized
bid-ask spread increases in the remaining time to maturity of a bond. The corporate
bond spread also increases in credit risk and age of a bond.
This paper contributes to the above literature by being the first study of the time-
series relationship between the corporate bond bid-ask spreads and yield spreads
using daily data. The data is described in the next section.
1.3. Data
1.3.1 Sample Construction from the Warga Database
The data panel of the corporate bond bid and ask yields is constructed in two
steps. First, a set of corporate bonds is identified using the Fixed Income Securities
Database supplied by Lehman Brothers and distributed by Warga (1998), which is
commonly referred to as the Warga database. Then, for each bond identified in step
one, the time series of the daily closing bid and ask yields are obtained from the
Bloomberg historical database of bond prices.
The Warga Database is one of the most comprehensive collections of publicly
offered U.S. Corporate bond data. The database contains bond descriptive
12
characteristics such as the date of issue and maturity, coupon rate and frequency,
dollar amount outstanding, credit ratings, optionality features and industry code of
the issuing firm.
For each month from January 1990 to March 1998 I identify all industrial
noncallable and nonputtable bonds. The resulting sample contains 3,413 bond issues.
Of these 3,413 bonds, the Bloomberg
7
database contains price data for 1,952 issues
8
.
I eliminate the observations for which the bid and ask yields are either missing, non-
positive, above 100 percent, or equal to each other (zero bid-ask spread) as such
observations probably indicate erroneous records in the database. Additionally, all
bonds with the coupon payment frequency different from semiannual as well as the
bonds with a sinking fund provision are excluded from the sample due to their
different pricing.
The bonds with less than one year to maturity have been noted to have extremely
sensitive yield spreads to even small price changes (see, for example, Ericsson and
Renault (2002)). If a bond has less than one year to maturity
9
, I exclude it from my
sample. Additionally, I exclude from the sample the bonds with more than 30 years
to maturity for the following reason. In the subsequent sections, the corporate bond
yield spreads are computed by subtracting from the bond’s yield the Treasury rate of
the corresponding maturity. Since the longest available constant maturity Treasury
rate series has the maturity of 30 years, extrapolating the corresponding treasury rate
beyond 30 years is likely to lead to substantial errors. Therefore, the bonds with
more than 30 years to maturity are excluded from the sample.
13
The observations with the zero or near-zero bid-ask spread changes probably
indicate that either the bond price quotes were not updated due to lack of trading
activity in the bond during that day or errors in the recorded data. If the one day bid-
ask spread change is less than one basis point, I exclude such observation from the
data set.
In order to have adequate sample sizes for the estimation of the time series
regression models at the individual bond level, I retain in my sample only the bonds
with 40 or more available daily observations. The final sample contains 252 bonds
issued by 130 companies with a total of 36,432 daily observations during the period
from January 3, 1990 to June 25, 2004, the average of 145 daily observations per
bond.
The descriptive statistics for both the Bloomberg sample of 252 bonds and the
Warga database sample of 3,413 bonds, which is representative of the corporate
bond population, are presented in Table 1.2. The Bloomberg sample contains larger
issues than the general bond population: $250 million versus $150 million median
amount outstanding. It also has shorter maturity bonds at the time of issuance: the
median of 7.76 years to maturity versus 10.0 years to maturity in the population. The
bonds in the Bloomberg sample have slightly higher coupons: the median coupon of
7.86 percent versus 7.70 percent in the overall bond population. A median bond from
the Bloomberg sample matures in November 2003.
14
Warga Database Sample of 3,413 Bonds
Variable Median Mean St.Dev. Min Max
Amount Out, $ mil. 150.0 199.0 158.8 1.0 1,500.0
Coupon, % 7.70 7.77 2.31 0.00 17.25
Matur. at Issue, Years
10.0 12.68 14.30 0.25 160.0
Issue Date 30-Jun-1992 - - 1-Nov-1886 31-Mar-1998
Maturity Date 1-Jun-2001 - - 28-Feb-1990 1-Mar-2098
Bloomberg Sample of 252 Bonds
Variable Median Mean St.Dev. Min Max
Amount Out, $ mil. 250.0 311.2 207.7 2.0 1,300.0
Coupon, % 7.86 7.83 1.70 0.00 13.00
Matur. at Issue, Years
7.76 10.39 7.60 1.75 30.00
Issue Date 13-Sep-1993 - - 1-Oct-1898 15-Mar-1998
Maturity Date 23-Nov-2003 - - 15-Aug-1995 15-Feb-2028
Table 1.2. Descriptive Statistics of the Samples of Corporate Bonds.
The distribution of the bonds and their issuers across S&P rating classes is given
in Table 1.3. My Bloomberg sample of 252 bonds consists of 198 investment grade
issues (80 percent), 51 speculative grade “junk” bonds (20 percent), and three bonds
not rated by S&P.
Additionally, for subsequent analyses, I define four credit rating groups by
grouping bonds according to their prevalent S&P credit rating. Group “AA” includes
all bonds in the sample, which are rated AA+, AA, and AA- by S&P on average.
Group “A” consists of all bonds rated A+, A, and A Group “BBB” contains all
bonds rated BBB+, BBB, and BBB All bonds in the “Junk” group are rated by S&P
below investment grade. The number of bonds and their issuers across the rating
groups are given in Table 1.3. The sample has 26 bonds (10 percent) in group AA,
70 bonds (28 percent) in group A, 102 bonds (41%) in group BBB, and 51
speculative grade bonds (20%).
15
S&P Rating Bonds
Issuers
All 252 130
High Grade 198
(80%)
93
(73%)
High Yield 51
(20%)
34
(27%)
AAA 6 5
AA+ 3 3
AA 9 4
AA- 8 4
A+ 15 10
A 48 18
A- 7 5
BBB+ 22 9
BBB 24 13
BBB- 56 22
BB+ 16 9
BB 8 5
BB- 10 4
B+ 2 2
B 8 7
B- 4 4
CCC+ 1 1
CCC 0 0
CCC- 1 1
CC 1 1
Not Rated 3 3
Credit Group
AA 26
(10%)
16
(12%)
A 70
(28%)
33
(25%)
BBB 102
(41%)
44
(34%)
Junk 51
(20%)
34
(26%)
Table 1.3. Distribution of Bonds Across S&P Rating Classes.