better tools, better process, better performance best-in-class spm deployments mirrored by xactly customer
Bạn đang xem bản rút gọn của tài liệu. Xem và tải ngay bản đầy đủ của tài liệu tại đây (255.36 KB, 10 trang )
This document is the result of primary research performed by Aberdeen Group. Aberdeen Group's methodologies provide for objective fact-based research and represent
the best analysis available at the time of publication. Unless otherwise noted, the entire contents of this publication are copyrighted by Aberdeen Group, Inc. and may not
be reproduced, distributed, archived, or transmitted in any form or by any means without prior written consent by Aberdeen Group, Inc.
May 2013
Better Tools, Better Process, Better
Performance: Best-in-Class SPM Deployments
Mirrored by Xactly Customers
One of the most crucial challenges facing today’s business-to-business (B2B)
companies is the care and feeding of their professional sales staff, considering
that competitive threats, savvy buyers, and ongoing budgetary constraints put
pressure on sales leadership and operational managers to do more with less.
Fortunately, a select group of top-performing enterprises reveals, in recent
Aberdeen research, an actionable combination of best practices and technology
adoption that successfully meets this challenge. This Research Brief will outline a
series of these protocols that can be adopted by under-performing sales
organizations seeking to improve their business results, as well as how a subset
group of Xactly customer survey respondents relate to these practices and
performance levels.
Between September and November 2012, Aberdeen surveyed 312 end-user
organizations about their sales effectiveness practices and accomplishments,
specifically to understand how sales performance management (SPM) is most
effectively deployed by Best-in-Class firms (sidebar) and detailed in
Motivate,
Incent, Compensate, Enable: Sales Performance Management Best Practices (January
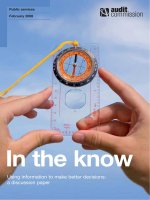
2013). Ten percent (10%) of these survey respondents indicated Xactly as their
technology provider around SPM, and we see in Figure 1 that sales reps for
Figure 1: Xactly Customers Field More Successful Sellers
Source: Aberdeen Group, November 2012
59%
54%
56%
43%
40%
45%
50%
55%
60%
Reps
achieving
quota
First-year
reps on
quota
Percdentage of attainment
n = 312
Xactly customers All Others
Research Brief
Aberdeen’s Research Briefs
provide a detailed exploration of
key findings from a primary
research study, including key
performance indicators, Best-in-
Class insight, and vendor insight.
The Sales Performance Management
Best-in-Class
In November and December, 2012,
Aberdeen surveyed 312 end-user
sales organizations to understand
their sales effectiveness best
practices. The performance metrics
used to define the Best-in-Class (top
20%), Industry Average (middle 50%),
and Laggard (bottom 30%) among
these sales teams are:
88% customer retention rate, vs.
78% among Industry Average and
14% for Laggard firms
12.3% average year-over-year
increase in overall team attainment
of sales quota, vs. a 1.0% increase
for the Industry Average and a
5.8% decline among Laggard
respondents
10.1% average year-over-year
increase in the percentage of sales
reps achieving quota, vs. a 1.2%
decline for Industry Average and a
7.7% decline (increase in) the cycle
time among Laggard respondents
8.0% average year-over-year
increase in average deal size or
contract value, vs. a 0.8% increase
for the Industry Average and a
1.5% decline among Laggard
respondents
Better Tools, Better Process, Better Performance: Best-in-Class SPM
Deployments Mirrored by Xactly Customers
Page 2
© 2013 Aberdeen Group. Telephone: 617 854 5200
www.aberdeen.com Fax: 617 723 7897
these particular organizations, particularly first-year sellers, are more likely to
achieve their individual quota levels. If we may safely assume that more sales
reps hitting their number is a desirable trait — and Aberdeen’s
Sales
Effectiveness research consistently yields support for this metric as a crucial key
performance indicator (KPI) in overall ROI on Sales Operations spending —
then it is well worth exploring how these firms, as well as top-performing
enterprises, support their front line with core competencies and technologies.
Best Practices, Best Performance
In Figure 2, we learn about a series of process capabilities (see Aberdeen’s
PACE research model, sidebar, page 3) that are consistently deployed more
frequently by Best-in-Class sales organizations than under-performing
companies, all of which can be effectively utilized in support of an SPM
technology deployment. Let’s take a detailed look at some of these practices:
Figure 2: Best-in-Class Capabilities Yield Superior Sales Results and Enablement Efficiencies
Source: Aberdeen Group, November 2012
Among all companies, and especially well-adopted by the Best-in-Class, is the
organizational capability defining SPM support from the C-Suite. It is
somewhat surprising that so many Laggard companies — nearly half — actually
report that senior executives are not invested in enabling their sales
organization; their business results paint an unfortunate picture of the
associated poor performance results. On the other hand, it should be noted,
the involvement of top corporate management in the specific compensation
design for the sales team is not as advisable, with only 35% of the Best-in-Class
(45% of All Others) reporting such a connection. While senior-level
involvement in fixing sales quota is the leading compensation determining factor
among all companies, Best-in-Class firms do not allow this top-down
involvement to override other forms of input nearly as dramatically as Industry
Average and Laggard companies, such as previous rep compensation, needs of
81%
78%
65%
45%
78%
58%
55%
40%
56%
55%
51%
37%
30%
45%
60%
75%
90%
SPM process has
buy-in from
corporate senior
leadership
Defined metrics for
analyzing impact of
sales performance
on company health
We provide sales managers
with training/tools to help
them provide better
feedback to, and guidance
for, their reps
Sales reps use automated
solutions to forecast their
performance against goal /
their likely compensation
Percentage of Respondents
n = 312
Best-in-Class Industry Average Laggard
Sector Definition
For the purposes of this
survey, the term “sales
performance management”
referred to any process,
strategy, or initiative focused
on managing, compensating,
rewarding, motivating, or
promoting sales staff, in order
to achieve optimal
performance in revenue
attainment and overall sales
productivity.
Better Tools, Better Process, Better Performance: Best-in-Class SPM
Deployments Mirrored by Xactly Customers
Page 3
© 2013 Aberdeen Group. Telephone: 617 854 5200
www.aberdeen.com Fax: 617 723 7897
the business or territory, or overall expectations for a team’s performance. This
is due to the distance, especially in large corporations, between top executives
and staff in the trenches, to whom they might not easily relate. Rather, they
balance the input more evenly with past and future corporate needs as well as
the realities of sales incomes and goals.
Next, Best-in-Class firms are 37% more likely than All Others (78% vs. 57%) to
link the sales team’s overall performance to the company’s overall
health, using defined metrics such as profit margin, forecasting accuracy,
customer retention, net client value, etc. Rather than isolating the perception of
the sales team’s performance around the simple number of dollars in closed
deals, these companies value a more holistic contribution by the business
development team, and track measurable statistics to back up their
commitment.
A final Best-in-Class core competency shows fewer than half of all companies
provide their sales reps with automated solutions to forecast their
current sales performance against their goals and/or their expected
compensation based on pending achievements. It is worth noting, however, that
top-performing firms are more likely than others to take advantage of the best
practices and tools described in
Better Sales Forecasting Through Process and
Technology: No Crystal Ball Required (July 2012), which provide sellers with real-
time data on their performance results vis-à-vis quota. The most advanced SPM
deployments allow sales reps to perform quick what-if scenarios that delineate
their exact income potential should any particular sales opportunity or set of
deals close during the current selling cycle, as well as how incentive programs
such as President’s Club or gamified internal competitions will play out. This
kind of visibility can serve as a strong motivator, considering the fact that 98% of
Best-in-Class companies confirm the value of financial compensation as a prime
motivator for the sales persona. This knowledge management capability is also
the one in which Xactly customers most often report their adoption, with a
63% rate, compared with 38% among all other organizations.
Supporting Best Practices with Enabling Technologies
Now let’s turn to how Best-in-Class companies invest in specific SPM platforms
and applications to turn these best practices into measurable business value. In
Figure 3 we look at four specific technology enablers that are deployed more
often by Best-in-Class organizations than by Industry Average or Laggard firms:
CRM compensation integration: Since the customer relationship
management (CRM) platform is the legitimate standard sales home port
for most enterprises, and money is the clear leading motivator of sales
behavior, it makes sense to marry these two functions. Aberdeen’s
research shows that Best-in-Class companies are 32% more likely than
All Others (66% vs. 50%) to integrate real-time compensation and quota
data or a commission estimator into the CRM system of record. By
doing so, the strongest-performing enterprises enable their reps to play
out how their compensation will be affected by closing (or failing to
close) various deals in their pipeline.
Aberdeen’s PACE Methodology
Aberdeen applies a methodology
to benchmark research that
evaluates the business Pressures,
Actions, Capabilities, and
Enablers (PACE) that indicate
corporate behavior in specific
business processes:
Pressures — external forces
that impact an organization’s
market position,
competitiveness, or business
operations.
Actions — the strategic
approaches that an
organization takes in response
to industry pressures.
Capabilities — the business
process competencies
(process, organization,
performance, and knowledge
management) required to
execute corporate strategy.
Enablers — the key
functionality of technology
solutions required to support
the organization’s enabling
business practices.
Better Tools, Better Process, Better Performance: Best-in-Class SPM
Deployments Mirrored by Xactly Customers
Page 4
© 2013 Aberdeen Group. Telephone: 617 854 5200
www.aberdeen.com Fax: 617 723 7897
Figure 3: Enabling SPM Technologies Support Peak Sales
Effectiveness Results
Source: Aberdeen Group, November 2012
Performance dashboards or scorecards, also preferably
integrated into the CRM, provide a quick visual status update to savvy
end-users who want to rapidly digest the information they need to
run their personal or group book of business. It works out best for all
stakeholders if such dashboards are configurable all the way down to
the individual user level, so that individual reps can select which data
points — commission estimates, quota attainment, gamification status
updates — are in front of them, and preferably with no distinction
between the device or location of the end-user. This technology
enabler also represents the highest adoption rate among Xactly
customers of the four presented here, with 55% of them doing so,
compared with 53% among the other 90% of survey respondents.
Best-in-Class firms are 23% more likely than Average companies (53%
vs. 43%) to use quota planning or management technologies to
develop aggressive-but-attainable quotas and territories for their reps,
as well as to address the need to give all reps a reasonable chance at a
fairly-sized book of business. Considering that the average reported
cost to replace a B2B sales rep is $35,360, ensuring that as many of
the front line team members have an achievable result and stay
engaged and profitably employed by the enterprise, is well worth
careful planning. Xactly customers are less likely than both the Best-
in-Class and other companies (41% vs. 42%) to deploy quota planning;
they are encouraged to enjoy the benefits of adoption, particularly if
their existing SPM platform can be integrated with this type of tool for
seamless management- and rep-level access.
66%
65%
53%
43%
56%
65%
43%
38%
39%
44%
43%
29%
20%
30%
40%
50%
60%
70%
CRM or SFA includes
compensation
module or
commission
estimator
Performance
dashboards /
scorecards for
both managers
and reps
Quota planning/
management solution
Compensation
management
solution
Percentage of Respondents
n = 312
Best-in-Class
Industry Average Laggard
Better Tools, Better Process, Better Performance: Best-in-Class SPM
Deployments Mirrored by Xactly Customers
Page 5
© 2013 Aberdeen Group. Telephone: 617 854 5200
www.aberdeen.com Fax: 617 723 7897
Sales Mobility: No Longer a Nice-to-Have
As reported in Aberdeen’s Sales Mobility: How Best-in-Class Remote Sellers Are
Replacing “See” with “Do” (April 2012), today’s most successful enterprise field
sales staff and account managers are fully enabled with processes, platforms,
devices, and technical support to ensure that peak sales performance, especially
among that data set’s Best-in-Class cohort (sidebar), is ensured regardless of the
physical location or time of day when sales reps perform their jobs. In the
context of the current SPM research, a majority of companies either currently
or plan within the year to support their team with mobile access to sales
compensation data, with Best-in-Class firms leading All Others by 17% (48% vs.
41%). Why is mobile access to earnings data so important? Because we want
our sales reps to see the “if–then” potential of closing that last-minute deal
regardless of where they are working. For example, a successful but tired rep
who is traveling at month-end may log into the CRM from the road, discover
that one more small customer up-sell will vault them into a higher commission
payment plan for the remainder of the quarter, and use their final hours of sales
cycle time to squeeze enough revenue out of their territory to hit that elevated
number — rather than close up shop, ignorant of the missed opportunity. And
this incremental revenue certainly helps their company, as well as internal and
external stakeholders, count on additional revenue overall. In this area, Xactly
customers out-pace the Best-in-Class, with 63% currently deploying the
approach, compared with just 15% among other firms. In Table 1, we look at
the performance advantages associated with this protocol, comparing a number
of sales effectiveness KPI results among users and non-adopters.
Table 1: “Show Me the Money” — an Anywhere, Any Time, Any
Device Must-Have
Sales Effectiveness Metric
Mobile Access to
Sales
Compensation
Data
All Others
Customer retention rate 77% 67%
Annual sales employee turnover 15.1% 20.6%
Average deal size or contract
value
$650k $279k
Annual improvement in sales
employee time-to-productivity
4.1% 0.0%
Source: Aberdeen Group, November 2012
Sales Motivation: Is it Just the Money?
Salespeople are only in it for the money, right? While fully 98% of Best-in-
Class firms predictably indicate individual financial compensation as a top-
three sales motivator, we see in Figure 4 that when we move beyond the
cash, even this classically hard-edged job role is highly susceptible to the value
of being told, “Job well done,” as well as to the challenge of internal
competition. Best-in-Class companies indicate that internal recognition for
Sales Mobility: Best-in-Class
Defined
Aberdeen research published
in
Sales Mobility: How Best-in-
Class Remote Sellers Are
Replacing “See” with “Do”
(April 2012) features a Best-
in-Class group of survey
respondents, defined as the
top 20% of performers:
109% of overall sales
quota achieved by the
sales organization during
the last completed
calendar or fiscal year,
compared with 73%
among Industry Average
firms and 41% within
Laggards
8.1% year-over-year
increase in lead conversion
rate (sales-accepted lead
to close); vs. a 2.1%
increase for Industry
Average firms and 6.1%
decrease among Laggards
4.6% average year-over-
year improvement in
customer renewal rate, vs.
a 0.3.% improvement for
the Industry Average and a
2.5% decline among
Laggard respondents
Best-in-Class: Top 20% of
aggregate performance
scorers
Industry Average: Middle 50%
of aggregate performance
scorers
Laggard: Lower 30% of
aggregate performance
Better Tools, Better Process, Better Performance: Best-in-Class SPM
Deployments Mirrored by Xactly Customers
Page 6
© 2013 Aberdeen Group. Telephone: 617 854 5200
www.aberdeen.com Fax: 617 723 7897
strong performance matters greatly to the sales function, followed by tangible
cash and non-cash rewards, as key motivators of the most highly desired sales
behaviors.
Figure 4: Top Non-Financial Sales Motivators — Cash Is King, But
Tell Me You Love Me
Source: Aberdeen Group, November 2012
Does this mean that salespeople actually have … feelings?! Indeed, yes. Consider
this common scenario in a typical sales organization: a number of high-
performing reps are consistently beating quota, making President’s Club, earning
good money … so what is the next step in their professional development? The
current research teaches us that “great players don’t often make great
managers” — only 18% of all respondents prioritize a promotional track to sales
management, perhaps knowing that many sales leaders earn less than their top
reps — so how can we keep our strongest sellers engaged? By instituting formal
recognition programs and competitive campaigns that reward leadership and
winning within a team environment.
This brings up the subject of the relatively new Sales Performance Management
focus on gamification
, which is defined as the use of game mechanics to motivate
or reward distinct behaviors. While only 12% of survey respondents currently
report an active gamification initiative, 23% of them (31% among the Best-in-
Class) indicate a plan to implement one within the next 12 months. Gamification
is a natural fit for the sales function — it represents another dimension in which
these naturally competitive team members can one-up each other — and is
adopted by the same 12% of Xactly customers as among all companies. Fifty-six
percent (56%) of these companies, however, consider public recognition a top
motivator around reps’ ability to achieve quarterly sales goals, compared with
36% among non-Xactly users. Hence, gamification adoption is likely to rise.
The other motivator under discussion here is competition. While the Human
Resources team inside a typical company may not always get excited about
creating employee competitions in which there are identified winners and
losers, the sales function is a natural fit for tapping into the competitive spirit
that has long been associated with the job role. In Figure 5, we note that
companies indicating the use of competition as an actively deployed motivator
57%
35%
21%
18%
15%
15%
10%
20%
30%
40%
50%
60%
Internal
recognition
for positive
performance
Competition
with other
team members
Learning and
developing
new skills
Promotional
opportunities
within the
company
Team-based
financial
compensation
Employee
engagement
program
aligned to
company
values
Percentage of Respondents
n = 312
Best-in-Class
Fast Facts
Best-in-Class companies
average 105% total team
attainment of quota,
compared with 86% for
Industry Average and 54%
among Laggards
Best-in-Class firms close an
average of 29% of sales-
accepted leads; the number
drops to 24% and 19%
among Industry Average and
Laggards respectively
The percentage of sales reps
achieving quota grew by
8.8% among the Best-in-
Class and 1.0% for Industry
Average companies; Laggards
report an average 2.1%
decrease
Better Tools, Better Process, Better Performance: Best-in-Class SPM
Deployments Mirrored by Xactly Customers
Page 7
© 2013 Aberdeen Group. Telephone: 617 854 5200
www.aberdeen.com Fax: 617 723 7897
for sales results see more first-year reps and all reps overall achieving their
individual sales quota numbers. In the case of Xactly’s customers, they are 16%
more likely (58% vs. 50%) to identify themselves as active adopters of this
practice.
Figure 5: Competition — an Effective Motivator of Sales Over-
Achievement
Source: Aberdeen Group, November 2012
Does Teamwork Matter?
Finally, let’s consider the references above to cash-oriented and non-cash
rewards in the context of teamwork. Figure 6 teaches us that the classic
assumption that salespeople are only motivated by their own personal
compensation, and achievement, is not supported by the data. The majority of
all survey respondents, and particularly the Best-in-Class, provide
organization-wide financial rewards for overall accomplishment of corporate
goals; these targets can vary from hitting revenue numbers to achieving
defined levels of customer satisfaction. Forty-eight percent (48%) of
respondents also provide non-cash incentives on a company-wide basis, with a
slightly higher percentage of Best-in-Class firms doing so. These incentives can
be tied into the gamification process described above, and serve to further the
point that while money remains the prime motivator and delivery model of an
individual’s sales remuneration, it is wise to consider rewarding teamwork
both via payroll and non-cash models. Looking at the Xactly users within the
research, they report an average score of 2.81 on a 1 to 5 scale of focusing on
teamwork as an essential sales effectiveness ingredient — “1” equaling an
“every man for himself” environment and “5” representing a total “one for all,
all for one” scenario “ which ranks lower than the 2.95 average among all
survey respondents. As more aggressive users of SPM tools, however, this
sub-set of companies sees more reps achieving quota (Figure 1 above) and
60%
49%
56%
43%
40%
45%
50%
55%
60%
Reps
achieving
quota
First-year
reps on
quota
Percentage of Attainment
n = 312
Competitive Motivators All Others
Fast Facts
The Best-in-Class report a
16% higher average sales
quota than all other firms:
$1.208M vs. $1.043M
Best-in-Class companies
raised average sales quota
13.7% since last year, vs.
8.1% among all others
Best-in-Class firms are 15%
more likely than Laggards
(69% vs. 60%) to onboard /
train sales staff specific to
individual job roles
Better Tools, Better Process, Better Performance: Best-in-Class SPM
Deployments Mirrored by Xactly Customers
Page 8
© 2013 Aberdeen Group. Telephone: 617 854 5200
www.aberdeen.com Fax: 617 723 7897
their average overall team attainment of quota — 78% vs. 77% among non-
Xactly users — doesn’t suffer as a result.
Figure 6: Business ROI of Rewarding Teamwork on the Sales Team
Source: Aberdeen Group, November 2012
Conclusion: Sales Effectiveness is Worth the Care and
Feeding
Readers have no doubt experienced the classic view of B2B sales people: they are
cutthroat, selfish, and motivated only by their own W-2, with no loyalty to their
co-workers or their employer beyond WIIFM — what’s in it for me.
Figure 7: Sales Employee Satisfaction
Source: Aberdeen Group, November 2012
A different story, however, is revealed by the research, and exemplified by the
Best-in-Class companies within the data. Consider the value, proven here, of
92%
51%
69%
52%
70%
46%
40%
55%
70%
85%
100%
Organization-wide
financial rewards
Organization-wide
non-financial rewards
Percentage of Respondents
n = 312
Best-in-Class Industry Average Laggard
3.16
2.88
3.03
2.64
2.59
2.35
2.00
2.50
3.00
3.50
Overall
sales
employee
satisfaction
Overall
sales team
satisfaction
with compensation
Average on 1-5 scale
n = 312
Best-in-Class Industry Average Laggard
Fast Facts
What is the “ideal” amount
of sales turnover? Best-in-
Class firms report 9.7%;
Industry Average 10.1%;
Laggards 12.3%
What is the average fully-
loaded cost of sales rep?
$152k among Best-in-Class
organizations; $148k for
Industry Average; $138k
among Laggards
Are Best-in-Class companies
larger than others, and
therefore more able to
invest in SPM technologies?
Actually, they are 18%
smaller than Industry
Average and Laggard firms,
measured by revenue
Better Tools, Better Process, Better Performance: Best-in-Class SPM
Deployments Mirrored by Xactly Customers
Page 9
© 2013 Aberdeen Group. Telephone: 617 854 5200
www.aberdeen.com Fax: 617 723 7897
emphasizing teamwork, career growth, non-financial rewards, and many other
softer sides of managing salespeople most effectively. In reality, the most
successful sales and sales operations leaders put energy and resources into
developing long-term, happy front-line employees. We see in Figure 7 the
clear link between sales staff satisfaction and peak performance. Sales leaders
with the strongest results around quota attainment, revenue growth, and
shortening the sales cycle are selecting, on-boarding, training, motivating,
incentivizing, and of course compensating their sales team members — and
managers — with a holistic view toward creating employees who are both
productive and satisfied. When it comes to compensation, Best-in-Class and
even Industry Average companies report better-than-neutral average
satisfaction with how much their teams are paid: in these uncertain economic
times, this is an enviable and ultimately profitable position to attain.
In the context of Xactly customers’ performance, the percentage of these
firms indicating strong overall and compensation satisfaction rates among their
sales teams is strong, with 73% and 61%, respectively, ranking at four or five
on the Figure 7 scales, equal to the 74% and 61% levels among all other firms.
If “a happy sales force is a successful one,” the performance of this customer
base remains strong, as evidenced by the opening data in Figure 1 above, as
well as by the additional metric provided in the sidebar.
Xactly Customers’ Performance
vs. All Others
In addition to the performance
metrics showcased in Figure 1,
Xactly’s customers achieved
stronger performance around
these sales effectiveness KPIs, in
comparison with the other 90%
of responding companies:
30% lower sales employee
turnover (15.0% vs. 21.4%)
26% shorter sales time-to-hire
(2.1 vs. 2.8 months)
22% shorter sales time-to-
productivity (3.6 vs. 4.6
months)
19% shorter average sales
cycle (4.02 vs. 4.98 months)
2.8% annualized growth in
average deal size, vs. 0.8%
Better Tools, Better Process, Better Performance: Best-in-Class SPM
Deployments Mirrored by Xactly Customers
Page 10
© 2013 Aberdeen Group. Telephone: 617 854 5200
www.aberdeen.com Fax: 617 723 7897
For more information on this or other research topics, please visit
www.aberdeen.com
.
Related Research
Breaking the Laws of Physics: Shortening
the Last Sales Mile Through Workflow
Automation; April 2013
CRM 2013: Generating Business Value
throughout the Enterprise; April 2013
Motivate, Incent, Compensate, Enable:
Sales Performance Management Best
Practices; January 2013
CRM 2013: Manufacturing Success
through Mobilized, Integrated, and
Flexible Deployments; January 2013
Collaborate, Listen, Contribute: How Best-
in-Class Sales Teams Leverage Social
Selling; November 2012
Train, Coach, Reinforce: Best Practices in
Maximizing Sales Productivity; October
2012
Better Sales Forecasting Through Process
and Technology: No Crystal Ball Required;
July 2012
Sales Intelligence: What B2B Sellers Need
To Know Before the Call; June 2012
Partner Relationship Management:
Channeling Better Sales Results; March
2012
Sales Mobility: How Best-in-Class Remote
Sellers Are Replacing “See” with “Do”;
March 2012
Author: Peter Ostrow, Vice President and Research Group Director; Customer
Management, Sales Effectiveness
() LinkedIn Twitter
For more than two decades, Aberdeen's research has been helping corporations worldwide become Best-in-Class.
Having benchmarked the performance of more than 644,000 companies, Aberdeen is uniquely positioned to provide
organizations with the facts that matter — the facts that enable companies to get ahead and drive results. That's why our
research is relied on by more than 2.5 million readers in over 40 countries, 90% of the Fortune 1,000, and 93% of the
Technology 500.
As a Harte-Hanks Company, Aberdeen’s research provides insight and analysis to the Harte-Hanks community of local,
regional, national and international marketing executives. Combined, we help our customers leverage the power of
insight to deliver innovative multichannel marketing programs that drive business-changing results. For additional
information, visit Aberdeen or call (617) 854-5200, or to learn more about Harte-Hanks, call
(800) 456-9748 or go to .
This document is the result of primary research performed by Aberdeen Group. Aberdeen Group's methodologies
provide for objective fact-based research and represent the best analysis available at the time of publication. Unless
otherwise noted, the entire contents of this publication are copyrighted by Aberdeen Group, Inc. and may not be
reproduced, distributed, archived, or transmitted in any form or by any means without prior written consent by Aberdeen
Group, Inc. (2013a)