electro-osmotic grouting technique for liquefaction-mitigation of low permeability silty soils
Bạn đang xem bản rút gọn của tài liệu. Xem và tải ngay bản đầy đủ của tài liệu tại đây (4.13 MB, 243 trang )
ELECTRO-OSMOTIC GROUTING TECHNIQUE
FOR LIQUEFACTION-MITIGATION OF LOW
PERMEABILITY SILTY SOILS
by
WEIWEI JIA
September 2006
A dissertation submitted to the Faculty of the Graduate School of
the State University of New York at Buffalo
in partial fulfillment of the requirements for the degree of
Doctor of Philosophy
Department of Civil, Structural and Environmental Engineering
UMI Number: 3226603
3226603
2006
UMI Microform
Copyright
All rights reserved. This microform edition is protected against
unauthorized copying under Title 17, United States Code.
ProQuest Information and Learning Company
300 North Zeeb Road
P.O. Box 1346
Ann Arbor, MI 48106-1346
by ProQuest Information and Learning Company.
ABSTRACT
Electro-osmotic grouting is a new foundation improvement technique proposed to
treat low permeability, liquefiable silty soils underneath existing structures for the
purpose of liquefaction-mitigation. This technique uses a d.c. current to introduce water
soluble grout materials and reactants into the silty soils. Setting time of injected grouts
can be controlled by adjusting the concentration and sequence of introduction of various
components.
Both experimental and numerical studies were performed in this research.
Experiments were conducted to prove the feasibility of electro-osmotic injection under 1-
D and 3-D conditions, to quantify the increase of liquefaction resistance in silty soils due
to electro-osmotic grouting, and to design grout mixes feasible for electro-osmotic
grouting. Numerical analyses were performed to simulate grout flows under a 3-D
condition, to determine the rate and extent of grout penetration, and to estimate power
consumption in electro-osmotic grouting.
Study shows that electro-osmotic grouting is a promising technique. Colloidal
silica and sodium silicate grouts can be injected into low permeability sility soils at the
rate of about
cm/s per v/cm, and liquefaction resistance of the silty soils increased
signicantly after injection.
5
10
−
Thesis Advisor: Professor Sabanayagam Thevanayagam
ii
ACKNOWLEDGEMENTS
I wish to express my deepest appreciation to my academic advisor – Dr.
Sabanayagam Thevanayagam, for his invaluable guidance, suggestions, as well as
support and continuous encouragement, without which this work would not be possible.
Conducting this research work under his guidance was a rewarding experience. I believe I
will always benefit from it in my future work and study.
My sincerely appreciation also goes to Professor Shahid Ahmad and Professor
Amjad Aref for their encouragement and support throughout the study.
I would like to say thanks to graduate students T. Shenthan and T.
Kanagalingam, who helped a lot in carrying out cyclic and monotonic triaxial tests,
and provided valuable suggestions and recommendations in the completion of the
dissertation. Shenthan also reviewed the whole dissertation and provided valuable
comments.
My deepest gratitude also goes to my parents and my aunt, for their
assistance and encouragement for the successful completion of this study.
Funding for this research work is provided by MCEER Hospital Project. The
financial support is greatly appreciated.
Finally, I dedicate this work to my wife, Huifen Zhu.
iii
TABLE OF CONTENTS
CONTENTS PAGE
ABSTRACT ii
ACKNOWLEDGMENT iii
TABLE OF CONTENTS iv
LIST OF TABLES ix
LIST OF FIGURES xi
NOTATIONS xv
I. INTRODUCTION 1
1.1 Background 1
1.2 Scope of Study 3
1.3 Organization 4
II. LITERATURE REVIEW 6
2.1 Liquefaction Related Phenomena 6
2.1.1 Introduction 6
2.1.2 Liquefaction 6
2.1.3 Ground Failure Associated with Liquefaction 11
2.2 Current Soil Improvement Techniques For Liquefaction Remediation 15
2.3 Traditional Grouting Techniques 18
2.3.1 Grouting 18
2.3.2 Permeation Grouting 21
2.3.2.1 Materials for Permeation Grouting 23
2.3.2.1.1 Materials for Suspensions 23
2.3.2.1.2 Chemical Grouting and Chemical Grouts 24
2.3.2.2 Sodium Silicate Based Grouts 26
2.3.2.3 Groutability 29
2.3.2.4 Cost of Permeation Grouting 30
2.3.2.5 Case Histories of Liquefaction-mitigation with
Permeation Grouting 31
2.4 Electro-Kinetic Phenomena And Their Applications 31
2.4.1 Electro-kinetic Phenomena 31
2.4.1.1 Electro-Osmosis 31
2.4.1.2 Electro-Phoresis 33
2.4.1.3 Streaming Potential 34
iv
2.4.1.4 Electro-Migration 34
2.4.2 Boundary Conditions of Electro-Osmotic Flow 35
2.4.3 Application of Electro-Kinetic Phenomena 37
2.4.3.1 Electro-Kinetic Remediation of Fine-Grained
Contaminated Sites 38
2.4.3.2 Injection of Ions and Nutrients 39
2.4.3.3 Electro-Kinetic Barriers 39
2.4.3.4 Stabilization of Excavations or Fine-Grained Soils 40
2.4.3.5 Dewater and Consolidation of Fine Grained
Soils, Waste Sludge, and Minerals 41
III. ELECTRO-OSMOTIC GROUTING 43
3.1 Introduction 43
3.2 Electrolysis Reactions 45
3.3 General Species Conduction Theory Under Electric Field 47
3.3.1 Diffusion 48
3.3.2 Electro-Osmosis 48
3.3.3 Electro-Migration 49
3.3.4 Hydraulic Flow 50
3.3.5 Species Conduction Under One- Dimensional Coupled Field 50
3.4 Species Conduction in Electro-osmotic Injection 51
3.5 Factors Affecting Electro-Osmotic Injection 55
3.5.1 Change of Soil Properties During Electro-Osmotic Injection 56
3.5.2 Factors Affecting Power Consumption in Electro-Osmotic Grouting 57
3.6 Proposed Strategies for Field Implementation 58
3.6.1 Vertical Layout and its Application – Single-Borehole Layout 59
3.6.2 Vertical Layout and its Application – Multiple-Borehole Layout 60
3.6.3 Horizontal Layout and its Application 60
IV. GROUT MIX DESIGN 65
4.1 Introduction 65
4.2 Grout Materials 66
4.2.1 Sodium Silicate 66
4.2.2 Colloidal Silica – Nyacol 215 and LUDOX SM-30 69
4.2.3 Acrylamide Grout 71
4.3 Gelling Time Tests on LUDOX SM-30 73
4.3.1 Test Procedure 73
4.3.2 Observations 74
4.3.3 Results 75
4.4 Conclusions and Comments 77
v
V. 1-D FEASIBILITY STUDY ON ELECTRO-OSMOTIC INJECTION 79
5.1 Introduction 79
5.2 Materials and Experimental Setup 79
5.2.1 Soil 79
5.2.2 Grout Materials 80
5.2.3 Electrode Material 80
5.2.4 Experimental Setup 81
5.3 Experiments 82
5.3.1 Experimental Procedure 84
5.3.2 Measurements 85
5.4 Results 86
5.4.1 Injection of Sodium Silicate 86
5.4.2 Injection of Colloidal Silica 89
5.4.3 Injection of with AV-100 91
5.5 Conclusions 94
VI. UNDRAINED BEHAVIOR AND LIQUEFACTION
POTENTIAL OF GROUTED SOIL 95
6.1 Introduction 95
6.2 Materials 95
6.2.1 Soil 95
6.2.2 Grout Materials 95
6.3 Electro-Osmotic Injection 96
6.3.1 Experimental Setup 97
6.3.1.1 Specimen Mold 97
6.3.1.2 Electro-osmotic Cell 98
6.3.1.3 Experimental Setup 99
6.3.2 Test Procedure 100
6.4 Undrained Triaxial Test 102
6.4.1 Experimental Setup 102
6.4.2 Test Procedure 104
6.5 Sodium Silicate (Grade N
®
)Treated Specimens 106
6.5.1 Undrained Cyclic Strength 106
6.5.1.1 Experiments 106
6.5.1.2 Results 107
6.5.2 Undrained Monotonic Strength 108
6.5.2.1 Experiments 108
6.5.2.2 Results 109
6.6 Colloidal Silica (LUDOX SM-30) Treated Specimens 112
6.6.1 Undrained Cyclic Strength 112
6.6.1.1 Experiments 112
6.6.1.2 Results 113
6.6.2 Undrained Monotonic Strength 114
6.6.2.1 Experiments 114
vi
6.6.2.2 Results 115
6.7 Application of Lab Test Result in Practical Design 116
6.7.1 Introduction 116
6.7.2 Proposed Relationship for
versus - Ungrouted Soils 117
CS
N
601
)(
L
E
6.7.3 Proposed Relationship for
versus - Grouted Soils 121
CS
N
601
)(
L
E
6.7.4 Practical Application of Correlation Chart 124
6.8 Conclusion 125
VII. THEORETICAL STUDY ON THE GROUT FLOW IN 3-D
ELECTRO-OSMOTIC INJECTION 126
7.1 Introduction 126
7.2 Flow Field Analogy 129
7.2.1 Hydraulic Flow 131
7.2.2 Electric Flow 133
7.2.3 Electro-osmotic Flow 135
7.2.4 Concept of Analogy 135
7.2.5 Equivalent Flow Field Equations 137
7.3 Guidelines for Simulation of Electro-osmotic Grouting 139
7.4 Application of the Analogy 141
7.4.1 MODFLOW 132
7.4.2 The Electric Field and Electro-osmotic Flow Field 142
7.4.3 Hydraulic Flow Model 142
7.4.4 Numerical Solution 144
7.5 Cost of Electro-Osmotic Injection 145
7.5.1 Theoretical Analysis On Unit Power Consumption 145
7.5.2 Parametric Study on Unit power consumption 147
7.6 Conclusion 147
VIII. 3-D FEASIBILITY TEST OF ELECTRO-OSMOTIC INJECTION 152
8.1 Introduction 152
8.2 Experimental Program 153
8.2.1 Materials 153
8.2.1.1 Soils 153
8.2.1.2 Grout Material 153
8.2.2 Experimental Setup 154
8.2.3 Test Procedure 155
8.2.4 Control Test 155
8.3 Test Result 156
8.4 Theoretical Study of the 3-D Bench Scale Test 159
8.4.1 Numerical Model of the Electro-Osmotic and Electric
Current Flow 160
8.4.2 The Hydraulic Flow Model 160
8.4.3 Numerical Solution to The Hydraulic Flow Problem 161
vii
8.4.4 Analysis 161
8.5 Conclusion 162
IX. FEASIBILITY STUDY OF FIELD APPLICATION OF
ELECTRO-OSMOTIC GROUTING – AN EXAMPLE 164
9.1 Introduction 164
9.2 Sample Site 165
9.2.1 Liquefaction Potential at the Site 167
9.2.2 Rationale for Selection of Electro-Osmotic Grouting for
Liquefaction-mitigation 170
9.3 Post-Treatment Cyclic Resistance 171
9.4 Post Treatment Bearing Capacity 172
9.4.1 Foundation Design Loads 172
9.4.2 Post-Treatment Soil Compression Strength 174
9.4.3 Design Requirement of Grouted Zone 175
9.5 Implementation Of Electro-Osmotic Grouting 176
9.5.1 Construction Procedure 176
9.5.2 Grouting Pipes 179
9.5.3 Power Voltage Selection 179
9.5.4 Equipment 179
9.5.5 Sequence of Injection 180
9.5.6 Grout Mix Setting Time 182
9.5.7 Cost of Implementation 182
9.6 Estimate Of Grouting Duration And Grout Penetration 184
9.6.1 Hydraulic Flow Model 184
9.6.2 Penetration and Injection Duration 184
9.7 Quality Control Of Electro-Osmotic Grouting 187
9.8 Conclusion 187
X. CONCLUSIONS 189
XI. RECOMMENDATIONS FOR FUTURE RESEARCH 192
REFERENCES 194
APPENDIX A TEST SUMMARY OF THE 1-D ELECTRO-
OSMOTIC INJECTION FEASIBILITY STUDY 205
APPENDIX B: TEST SUMMARY OF THE STUDY ON
UNDRAINED BEHAVIOR AND LIQUEFACTION
POTENTIAL OF GROUTED SOIL 210
APPENDIX C: TEST SUMMARY OF THE 3-D ELECTRO-
OSMOTIC INJECTION FEASIBILITY STUDY
224
viii
LIST OF TABLES
Table 1.1 Conventional Liquefaction-mitigation Techniques 2
Table 2.1 Cost Estimates for Current Grouting Techniques 21
Table 2.2 Limits of Penetration of Cement into Granular Soils 29
Table 2.3 Relationships Between the Viscosities of 29
Table 3.1 Standard Reduction Potentials at 25
o
C 45
Table 3.2 Advantages and Disadvantages of Proposed Strategies 61
Table 4.1 Commonly Used Chemical Grouts 65
Table 4.2 Grout Materials Used in the Study 66
Table 4.3 Specifications of N
® Sodium Silicate 68
Table 4.4 Specifications of Calcium Chloride 68
Table 4.5 Specifications of Nyacol
® 215 Colloidal Silica 70
Table 4.6 Specifications of LUDOX SM-30 Colloidal Silica 70
Table4.7 Specifications of AV-100 72
Table 4.8 Jar-Test Gel State Codes (Sydansk 1990) 75
Table 4.9 Gel Test on Colloidal Silica – LUDOX SM-30 76
Table 5.1 Grout Injection Feasibility Test 82
Table 5.2 Soil pH, Conductivity, and Strength 83
Table 6.1 The Size, Electric Gradients, and Durations of Injection
of Two Kinds of Specimens 100
Table 6.2 Undrained Cyclic Triaxial Tests on N
®
Sodium Silicate
Treated Specimens 107
Table 6.3 Test Parameters for Undrained Cyclic Triaxial Tests on
ix
N
®
Sodium Silicate Treated Specimens 107
Table 6.4 Undrained Compression Triaxial Tests On N
®
Sodium
Silicate Treated Specimens 109
Table 6.5 Test Parameters for Undrained Compression Triaxial
Tests on N
®
Sodium Silicate Treated Specimens 109
Table 6.6 Undrained Cyclic Triaxial Tests on LUDOX SM-30 Colloidal Silica
Treated Specimens 112
Table 6.7 Test Parameters for Undrained Cyclic Triaxial Tests on
LUDOX SM-30 Colloidal Silica Treated Specimens 112
Table 6.8 Undrained Compression Triaxial Tests on LUDOX SM-30
Colloidal Silica Treated Specimens 114
Table 6.9 Test Parameters for Undrained Compression Triaxial
Tests on LUDOX SM-30 Colloidal Silica Treated Specimen 114
Table 7.1 Flow Analogies (Modified from Harr 1962) 136
Table 7.2 Flow Analogies 143
Table 8.1 Flow Analogies 160
Table 9.1 Design Parameter for the Sample Site 163
Table 9.2 Soil Factor of Safety against Liquefaction and
Required (N
1
)
60CS
for Liquefaction-mitigation Purpose 169
Table 9.3 Foundation Design Loads 173
Table 9.4 Flow Analogies 184
x
LIST OF FIGURES
Figure 2.1 Tilted buildings - Niigata Earthquake, Japan, 1964 8
Figure 2.2 Tilted Buildings - Kocaeli, Turkey, Earthquake of
August 17, 1999 9
Figure 2.3 Sheffield Dam Suffered a Flow Failure Triggered by the
Santa Barbara Earthquake in 1925 10
Figure 2.4 Tension Cracks on the Banks of the Motagua River
Following the 1976 Guatemala Earthquake 10
Figure 2.5 Sand Boils in Loma Prieta Earthquake, USA, 1989 11
Figure 2.6 Schematic Diagram of a Lateral Spread (Youd 1992) 12
Figure 2.7 Diagram of a Flow Failure Caused by Liquefaction
and Loss of Strength of Soils Lying on a Steep Slope 13
Figure 2.8 Diagram of Structure Tilted Due to Loss of
Bearing Strength. 14
Figure 2.9 Diagram of Horizontal Ground Oscillation Caused by
Liquefaction in the Cross-Hatched Zone Decoupling the
Surface Layers From the Underlying Ground. 14
Figure 2.10 Applicable Grain Size Ranges for Liquefable Soil
Improvement Method 19
Figure 2.11 Conceptual Diagram of Soil Solidification by
Compaction Grouting 20
Figure 2.12 Conceptual Diagram of Soil Densification by
Permeation Grouting 22
Figure 2.13 Two-Shot and One-Shot Methods of Chemical Grouting 28
Figure 2.14 Electro-Kinetic Phenomena 32
Figure 2.15 Schematic Diagram of Electro-Kinetic Remediation 38
Figure 2.16 Schematic Diagram of Flow Barrier for Chemical
Contaminant Using Electro-Osmosis 41
Figure 3.1 Schematic Diagram of Electro-Osmotic Injection 43
xi
Figure 3.2 Electro-Kinetics under Electro-Osmotic Injection 51
Figure3.3 Transport of Silicate in Electro-Osmotic Injection 54
Figure 3.4 Electro-Osmotic Injection 62
Figure 3.5 Strategies of Field Application 63
Figure 4.1 Equipments for Setting time Test 74
Figure 4.2 Typical Progress of Gelation of the Colloidal Silica
Grout Mix with Different
Concentrations. 75
2
CaCl
Figure 4.3 Setting time Test on Colloidal Silica 77
Figure 5.1 Gradation of the Sand, Silt, and Soil Mix 80
Figure 5.2 1-D Electro-Osmotic Injection Test 81
Figure5.3 1-D Electro-Osmotic Injection Feasibility Test
on Sodium Silicate 87
Figure 5.4 1-D Electro-Osmotic Injection Feasibility Test on
Colloidal Silica (Nyacol 215) 89
Figure 5.5 1-D Electro-Osmotic Injection Feasibility Test on AV-100 92
Figure 6.1 Gradation of #55 Sand, #90 Silt, and the Soil Mix 96
Figure 6.2 Schematic Diagram of Specimen Mold (a) 97
Figure 6.3 Schematic diagram of Electro-Osmotic Cell (a) 98
Figure 6.4 Schematic Diagram of the Experimental Setup
of Electro-Osmotic Injection 99
Figure 6.5 GEOCOMP Experimental Setup 102
Figure 6.6 GDS Experimental Setup 103
Figure 6.7 The Pressure Panel 103
Figure 6.8 Undrained Cyclic Test Result (CSR = 0.2,
σv
0
’ =100 kPa.) 108
Figure 6.9 Undrained Triaxial Compression Strength of
Silicate-Treated Specimen 111
Figure 6.10 Undrained Cyclic Test Result (CSR = 0.2,
σv
0
’ =100 kPa.) 113
Figure 6.11 Undrained Triaxial Compression Strength
xii
of Colloidal Silica Treated Specimens 115
Figure 6.12 Relationship Between Relative Density and
601
)(N
For Clean Sand 117
Figure 6.13 Relationship Between
and for Clean Sand 118
r
D
L
E
Figure 6.14 Relationship Between
and for Clean Sand 118
601
)(N
L
E
Figure 6.15 Assumed Relationship Between Relative Density and
601
)(N For Silty Sand With Fines Content Lower Than 120
th
FC
Figure 6.16 Relationship Between
and 120
eqrc
D )(
L
E
Figure 6.17 Relationship Between
and 121
CS
N
601
)(
L
E
Figure 6.18
versus e Relationship for Silty Soils 122
L
E
Figure 6.19 Relationships Between
and for
601
)(N
L
E
Treated and Un-treated Soil 123
Figure 6.20
Values for Pre- and Post-Grouted Soil 124
CS
N
601
)(
Figure 7.1 Field Application Strategy 1- Vertical Grouting 128
Figure 7.2 Simplified flow problem 128
Figure 7.3 Example Configuration of Electro-osmotic Grouting 140
Figure 7.4 Hydraulic Model for Simulation of Electric Field in Figure 7.3 140
Figure 7.5 Numerical Simulation of an Electro-Osmotic Injection Problem 141
Figure 7.6 Flow lines and extent of penetration 144
Figure 7.7 Unit power consumption versus Voltage 148
Figure 7.8 Unit power consumption versus Soil Electric Conductivity 148
Figure 7.9 Unit power consumption versus Soil Electro-Osmotic Permeability 149
Figure 7.10 Unit power consumption versus Soil Porosity 149
Figure 7.11 Unit Cost versus Voltage 150
Figure 7.12 Unit Cost versus Soil Electric Conductivity 150
Figure 7.13 Unit Cost versus Soil Electro-Osmotic Permeability 151
Figure 7.14 Unit Cost versus Soil Porosity 151
Figure 8.1 Experimental Setup of Bench Scale Test 152
Figure 8.2 Gradation of the Sand, Silt, and Soil Mix 153
Figure 8.3 Schematic Diagram of the Experimental Setup of
Bench Scale Test 154
xiii
Figure 8.4 Current versus Time – Bench Scale Test 156
Figure 8.5 Cumulative Grout Flow versus Time – Bench Scale Test 157
Figure 8.6 Unit Power Consumption versus Time – Bench Scale Test 157
Figure 8.7 Cumulative Grout Flow versus Time - Control Test 157
Figure 8.8 Grouted Soil Column Around the Anode 158
Figure 8.9 Numerical Model of the Bench Scale Test 159
Figure 8.10 Hydraulic Flow Lines 161
Figure 8.11 Test and Theoretical Results of the Bench Scale Test 163
Figure 8.12 Grout Flow Lines and Penetration at 1 Day 163
Figure 9.1 Plan and Elev. of a Hospital Office Building 167
Figure 9.2 (N
1
)
60CS
of Sandy Silt – Pre-treatment Value and
Value Required for Liquefaction-mitigation 169
Figure 9.3 (N1)60cs of Pre- and Post Treated Soil 171
Figure 9.4 (N1)60CS of Sandy Silt – Pre-treatment Value, Post-Treatment
Value, and Value Required for Liquefaction-mitigation 172
Figure 9.5 Typical Tributary Area of Wall Footings 174
Figure 9.6 Injection Pattern – Elevation 177
Figure 9.7 Injection Pattern – Plan 178
Figure 9.8 Flow Lines in a Flow Field 180
Figure 9.9 Staged Injections 181
Figure 9.10 Typical Penetration of 2-Point Injection 185
Figure 9.11 Typical Penetration of 3-Point Injection 185
Figure 9.12 Penetration of Injection 186
xiv
NOTATIONS
e
i = Electrical potential gradient
c = Concentration of species
CSR = Cyclic stress ratio
D = Dielectric constant of the fluid
D = Diffusion coefficient of species in free solution at infinite dilution
*D = Effective diffusion coefficient of species
r
D = Relative density
eqrc
D )( = Equivalent clean sand relative density
E
= Electric potential
L
E = Energy to reach +/- 5% strain in soil
e = Void ratio
F = Faraday’s constant
FC = Fines content
th
FC = Threshold fines content
e
i = Electrical potential gradient
i = Electrical potential gradient
I
= Electrical current
i
J = The mass flux of the ith chemical species in soil pore fluid
k , = Soil hydraulic permeability
h
k
e
k = Soil electro-osmotic permeability
xv
601
)(N = Corrected SPT blow counts
CS
N
601
)( =Corrected SPT blow counts equivalent to clean sand
'
p = Mean effective confining pressure
R
= Universal gas constant
SPT = Standard penetration test
t = Time
T
= Absolute temperature
V = Electric voltage
n
= Soil porsity
η
= Viscosity of fluid
ε
= Strain
τ
= Tortuosity
ς
= Zeta potential
σ
= Electric conductivity of fluid
*
σ
= Effective electric conductivity of pore fluid
σ
= Stress
xvi
Chapter 1
INTRODUCTION
1.1 BACKGROUND
Liquefaction-induced loss of soil strength and associated ground failure can bring
great damages to buildings and structures built on it. At sites where liquefaction potential
exists, the basic options may be: abandoning the site, living with the risk of liquefaction,
or implementing liquefaction remediation measures to minimize the risk. There are many
existing structures built on soils of high liquefaction and deformation potential. For
critical structures built on liquefiable soils, such as hospitals and lifelines, the only option
available is to improve the soil to mitigate its liquefaction potential, and the demand for
such improvements is very urgent, since it is necessary that these critical buildings
function well during earthquakes. The reason is apparent: hospitals are necessary to take
care the injured people during earthquakes, and water supply systems are necessary for
domestic use and to put out fires caused by the earthquake, etc.
Traditional foundation improvement methods are usually not feasible for treating
soil underneath existing structures due to poor site accessibility and the undesirable level
of noise and vibration caused by the working machine to occupants and equipment inside
the structures (Table 1.1) (Thevanayagam et al. 2002).
Among current ground improvement techniques for liquefaction remediation,
permeation grouting may be the most effective one when accessibility to the soil is highly
limited, such as soils under existing structures. Permeation grouting may also be the only
1
option available when less complicated densification methods are not applicable due to
the objectionable level of noise and vibration these methods may produce. But when silt
content of soil is higher than 10 to 15%, even permeation grouting is ineffective. The low
permeability of silty soils makes it impractical, if not impossible, to effectively inject the
grouts by permeation. New technology needs to be developed to treat the liquefiable low
permeability silty soils underneath existing structures.
Table 1.1 Conventional Liquefaction-mitigation Techniques
(From Thevanayagam et al. 2002)
Soil Type
Technique
Sand Silty
sand
Silt
Accessibility
(Beneath Existing
Structures)
Dynamic Compaction Yes * * No
Densification
Vibro-Densification Yes * * No
Densification/
Drainage/
Reinforcement
Vibro-Stone Column Yes * * No
Permeation Grouting Yes (Fines
≤5%)
** No Yes
Compaction Grouting Yes Yes Marginal Yes
Soil Mixing Yes Yes Yes No
Solidification
Jet Grouting Yes Yes Yes No
Electro- Osmotic Grouting
(This study)
** Yes Yes Yes
* = feasible with supplementary wick drains; ** = uncertain
To meet such a demand, a new permeation grouting technique based on electro-
osmotic injection of binding agents and additives into silty soils is presented in this
dissertation.
When a d.c. (direct current) voltage is applied across a saturated soil, the
following phenomena occur (Mitchell 1993): (i) pore fluid flows from anode to cathode
2
(called electro-osmosis), (ii) positively charged dissolved ions flow from anode to
cathode, and negatively charged dissolved ions flow from cathode to anode (called
electro-migration). Electrolysis
Reactions at the electrodes may also induce changes in
the pH and ion concentrations, and hence affect the soil properties and flow of ions and
pore fluid. Past experience with clayey soils indicate that the electro-osmotic fluid flow
velocity is in the order of
cm/s/V/cm or larger (Mitchell 1993). Experience in
electro-kinetic treatment of contaminated soils (Acar et al. 1992, Acar et al. 1994, Acar et
al. 1996, Chen et al. 1999) indicates that pore fluid and electrode chemistry significantly
affect the pore fluid chemistry and flow behavior. With due consideration of these
factors, it may be possible to use d.c. current to introduce water-soluble grouts and
hardening agents into low permeable silty soils by judiciously introducing various grout
components near the electrodes. By controlling the concentrations and sequence of
introduction of various components, and by careful selection of grouting material and
reactants, the hardening time of the introduced grout mix can be controlled.
5
10
−
1.2 SCOPE OF STUDY
This dissertation presents the results of experimental and numerical studies
performed to evaluate the feasibility of electro-osmotic injection, to study the level of
improvement that could be achieved by electro-osmotic injection, and to assess the
feasibility of field application of this new technique. Laboratory tests involved the
development of test devices and procedure for electro-osmotic injection, the design of
test methods to evaluate the feasibility of electro-osmotic injection under 1-D and 3-D
conditions, and the development of test devices and procedure to evaluate the increase of
3
liquefaction resistance in silty soils due to electric-osmotic grouting. Laboratory study
also involved selection of grout materials and reactants, and design of the appropriate
grout mix feasible for electro-osmotic injection. Numerical analyses were performed to
simulate grout flows under a 3-D condition, to determine the rate and extent of grout
penetration, and to estimate power consumption in electro-osmotic grouting.
The results indicated that selected grouts can be injected into low permeability
sility soils at a reasonable rate, and liquefaction resistance of the silty soils increased
signicantly after injection.
1.3 ORGANIZATION
Chapter 2 of this dissertation presents a brief historical review of liquefaction
phenomena and traditional ground improvement techniques for liquefaction-mitigation. A
brief introduction of electro-kinetic phenomena is also included in this chapter. Chapter 3
focuses on the new electro-osmotic grouting technique. Electrolysis reactions and species
conduction during electro-kinetic processing of soils, species conduction during electro-
osmotic injection, and factors affecting the implementation of the electro-osmotic
injection are discussed in this chapter. Proposed strategies for field implementation of the
technique are also provided in this chapter. Chapter 4 introduces the grout materials and
reactants investigated in the study. Grout mix specifically designed for electro-osmotic
grouting is also discussed in this chapter. Chapter 5 describes the experimental program
to study the feasibility of 1-D electro-osmotic injection, including the electro-osmotic
injection device, test procedure, and measurements and observations performed in the
study. A group of 1-D electro-osmotic injection tests were conducted and presented in
4
this chapter. A total of three types of grout materials were investigated. Chapter 6
presents the results of undrained triaxial tests on pre- and post-electro-osmotic treated
specimens. Both monotonic tests and cyclic tests were conducted to evaluate the increase
in soil resistance to flow liquefaction and cyclic mobility due to electro-osmotic grouting.
Chapter 7 presents the theoretical study of grout movement under a 3-D electric field.
Numerical methods were proposed to simulate grout movement in electro-osmotic
grouting. Factors affecting the implementation electro-osmotic injection and construction
cost are further discussed in this chapter. Chapter 8 presents the results of a 3-D bench
scale electro-osmotic injection test, which was used to evaluate the feasibility of
implementation of the new technique in the field. Numerical analysis is conducted to
simulate the bench scale test and to analyze the test results. To demonstrate the
applicaton of this new technique, a sample design of electro-osmotic grouting for
liquefaction-mitigation of silty soils underneath a hypothetical two-story hospital
building is presented in Chapter 9. Conclusions based on the current study and
recommendations for future study are presented in Chapters 10 and 11, respectively.
5
Chapter 2
LITERATURE REVIEW
2.1 LIQUEFACTION RELATED PHENOMENA
2.1.1 Introduction
Since the Good Friday earthquake in Alaska and the Niigata earthquake in Japan
in 1964 (Eckel 1970, Bartlett et al. 1992, Harmada et al. 1992, National Research Council
1968), liquefaction has attracted the attention of researchers and engineers all over the
world. Spectacular examples of liquefaction damage, including slope failures, bridge and
building foundation failures, and flotation of buried structures were observed in both
earthquakes (Eckel 1970, Bartlett et al. 1992, Harmada et al. 1992, National Research
Council 1968). Thereafter, liquefaction phenomena have been studied extensively by
many researchers and engineers (Finn et al. 1995). In the same time, ground improvement
techniques have been developed for liquefaction-mitigation and many of these techniques
have been applied successfully (Welsh 1987, Kramer et al. 1991, Port and Harbor
Research Institute 1997, Cooke et al. 1999).
2.1.2 Liquefaction
Liquefaction is a phenomenon wherein shear resistance of sediments below the
water table decreases and the sediments behave as a viscous liquid rather than a solid
when subjected to monotonic, cyclic, or dynamic loading at constant volume (Eckel
1970, Bartlett et al. 1992, Harmada et al. 1992, National Research Council 1968). The
6
types of sediments most susceptible are clay-free deposits of sand and silts; occasionally,
gravel liquefies. Liquefaction phenomena that result from this process can be divided into
two main groups: flow liquefaction and cyclic mobility.
Flow liquefaction can occur when the shear stress required for static equilibrium
of a soil mass (the static shear stress) is greater than the shear strength of the soil in its
liquefied state. The static or dynamic loads may simply bring the soil to a state at which
its strength drops sufficiently to allow the static stress to produce the flow failure. Once
triggered, the strength of the soil is no longer sufficient to withstand the static stresses.
The large deformations produced by flow liquefaction are actually driven by static shear
stresses. Flow liquefaction is often characterized by large and rapid movements, which
can produce disastrous effects. The bearing capacity failures of Kawagishi-cho apartment
buildings during the Niigata Earthquake 1964 in Japan (Figure 2.1), the bearing capacity
failure of buildings in Kocaeli earthquake 1999 in Turkey (Figure 2.2), and the flow
slides failures of Sheffield Dam (Figure 2.3), are examples of flow liquefaction.
As these case histories illustrate, flow failures can involve the flow of
considerable volumes of material which undergoes very large movements that are
actually driven by static stresses. The disturbance needed to trigger flow liquefaction can
be very small in some instances.
Cyclic mobility is another liquefaction phenomena, which occurs when the static
shear stress is less than the shear strength of the liquefied soil. Deformations due to cyclic
mobility develop incrementally because of the static and dynamic stresses that exist
7
during an earthquake. Lateral spreading, a common result of cyclic mobility, can occur
on gently sloping and on virtually flat ground close to rivers and lakes. The 1976
Guatemala earthquake caused lateral spreading along the Motagua River (Figure 2.4). It
can be observed that the cracks parallel to the river in the picture to the right.
On level ground, because static horizontal shear stress that could drive lateral
deformation do not exist, level-ground liquefaction can produce large, chaotic movement
known as ground oscillation during earthquake shaking. But it produces little permanent
lateral soil movement. The high pore water pressure induced by liquefaction can cause
pore water to flow rapidly to the ground surface.
This flow can occur both during and
after an earthquake. If the flowing pore water rises quickly enough, it can carry sand
particles through cracks up to the surface, where they are deposited in the form of sand
volcanoes or sand boils (Figure 2.5, Loma Prieta, USA, 1989).
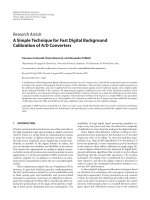
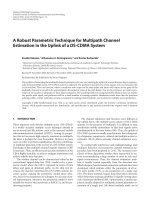
Figure 2.1 Tilted buildings - Niigata Earthquake, Japan, 1964
(
M=7.5, 310 of the 1500 reinforced concrete buildings in Niigata City were damaged; 200
buildings on shallow Foundations or Friction Piles in loose sand/silty sand settled without
significant structural damage due to liquefaction. Same type of buildings built on firm
strata at 20 m deep did not suffer damage.
8