research on fabrication and the physical properties of the multi-component ceramics based on pzt and the relaxor ferroelectric materials
Bạn đang xem bản rút gọn của tài liệu. Xem và tải ngay bản đầy đủ của tài liệu tại đây (5.19 MB, 52 trang )
HUE UNIVERSITY
COLLEGE OF SCIENCES
LE DAI VUONG
RESEARCH ON FABRICATION AND THE PHYSICAL PROPERTIES
OF THE MULTI-COMPONENT CERAMICS BASED ON PZT AND THE
RELAXOR FERROELECTRIC MATERIALS
Major: Solid State Physics
Code: 62.44.01.04
ABSTRACT OF THE THESIS
Hue, 2014
The thesis had implemented at College of Sciences, Hue University
Academic Supervisor: Assoc. Prof. Dr. Phan Dinh Gio
Reviewer 1:
Reviewer 2:
Reviewer 3:
This thesis will be reported at Hue University
Date & Time … / …./…./….
1
INTRODUCTION
For more than 50 years, the ferroelectric materials are one of the most the
important materials and have been intensively investigated in both
fundamental research and applications. The reason is that they exist in many
important physical effects such as ferroelectric, piezoelectric, photovoltaic,
non-linear optical, pyroelectric effects, etc. These materials have the ability
for application in manufacturing of capacitors, high capacity memory, power
ultrasonic transducers used in biology, chemistry, pharmacology, and
piezoelectric transducers [3], [5], [35], [36], [81].
The important and main materials of applications often have the
perovskite structures, ABO
3
. That is the Pb(Zr,Ti)O
3
(PZT) ceramics, and
PZT doped ‘‘soft’’and ‘‘hard’’ such as La, Ce, Nd, Nb, Ta, and Mn, Fe,
Cr, Sb, In. In addition to these families, there is a wide variety of complex
perovskite forms resulting from multiple ionic substitutions. Many of the
materials in the complex perovskite family are known to be relaxor
ferroelectrics. The general formula for the complex perovskite is:
(A’A’’…A
n’
)BO
3
or A(B’B’’ B
n’
)O
3
, and their dielectric, piezoelectric and
ferroelectric properties of ceramics may be improved for high power
applications [3], [5], [16], [18], [30], [31], [37], [56], [57], [76], [81]. The
characteristics of relaxor ferroelectric materials are a high dielectric constant,
a broad ferroelectric- paraelectric transition (the diffuse phase transition) and
a strong frequency dependency of the dielectric properties. In addition, above
the Curie temperature of several tens of degrees still have spontaneous
polarization and hysteresis loops [5], [5], [58], [81].
Recently, the materials scientists have been intensively investigating the
application of multi-component ceramic systems combining the normal
ferroelectric PZT and relaxor ferroelectric materials such as: Pb(Zr,Ti)O
3
–
Pb(Zn
1/3
Nb
2/3
)O
3
(PZT–PZN) [23], [24], [30], [31], [35], [42], [90];
Pb(Zr,Ti)O
3
–(Mn
1/3
Nb
2/3
)O
3
(PZT-PMnN) [4], [15], [52]; Pb(Zr,Ti)O
3
–
Pb(Mn
1/3
Sb
2/3
)O
3
(PZT-PMS) [5], [60], [80], [83]; Pb(Zr,Ti)O
3
–
Pb(Zn
1/3
Nb
2/3
)O
3
–Pb(Mg
1/3
Nb
2/3
)O
3
(PZT–PZN–PMN) [13]; Pb(Zr,Ti)O
3
–
Pb(Zn
1/3
Nb
2/3
)O
3
– Pb(Mn
1/3
Nb
2/3
)O
3
(PZT–PZN–PMnN) [29], [34], [64],
2
[84], [87]. These ceramics often have low dielectric loss (tanδ), large
dielectric constant ε, high mechanical quality factor (Q
m
), high
electromechanical coupling factor (k
p
) [3], [5], [29], [34], [64], [84], [87].
Recent research has demonstrated that the PZT–PZN–PMnN quaternary
ceramics (by combining PZT-PZN and PZT-PMnN ceramics) have excellent
piezoelectric properties: the high Q
m
, the low tanδ and the large k
p
, the high
remanent polarization, and the large dielectric constant [29], [34], [64], [75],
[84], [87] satisfy the requirements for practical application in piezoelectric
transformers, ultrasonic motors.
However, the sintering temperature of the ceramics is quite high (> 1150
o
C)
[29], [34], [64], which leads to evaporation of PbO during the sintering
process, resulting in reduced properties of ceramic compositions and
environmental pollution. Therefore, lowering sintering temperature of PZT
based ceramics is very necessary. In order to reduce the sintering temperature
at which satisfactory densification could be obtained, various material
processing methods such as the 2-stage calcination method [5]; hot-pressed
method [3], [5], [32]; high energy mill [5]; liquid phase sintering [13], [15],
[26], [23], [33], [35], [41], [53]; using nano power [2], [17], [22] have been
performed. Among these methods, liquid phase sintering is basically an
effective method for aiding densification of specimens at low sintering
temperature. Many researchers have successfully decreased the sintering
temperature of PZT-based ceramics by using various additives such as
Li
2
CO
3
(735 °C), Bi
2
O
3
(820 °C), B
2
O
3
(450 °C), CuO-PbO (790 °C), etc.
In some cases, these additives can facilitate a lower sintering temperature,
but decrease simultaneously the piezoelectric properties of ceramics due to
the formation of piezoelectrically inactive phases in the grain boundary
regions. Therefore, the research and fabrication ceramics sintered at low
temperature, while improving or not reducing the piezoelectric properties of
ceramics system is very important [16], [23], [44], [75], [80].
Thus, the PZT - PZN - PMnN ceramics is very attractive for both
fundamental research and applications. From the above fact, we have chosen
dissertation topic is “Research on fabrication and the physical properties
3
of the multi-component ceramics based on PZT and the relaxor
ferroelectric materials”.
The objective of the thesis is: (i) Fabrication and research the effects of
Pb(Zr
0,47
Ti
0,53
)O
3
on the structure, microstructure and the physiscal properties of
xPb(Zr
0,47
Ti
0,53
)O
3
- (0,925-x)Pb(Zn
1/3
Nb
2/3
)O
3
- 0,075Pb(Mn
1/3
Nb
2/3
)O
3
ceramic
systems. (ii) To study the effect of Zr/Ti ratio in PZT on the structure, and the
propertiesof the PZT - PZN - PMnN ceramics, determine PZT content which
ceramics have good electrical properties and the relaxor ferroelectric
characteristics. (iii) To study the characteristic properties of the Fe
2
O
3
doped
PZT - PZN - PMnN ceramics. (iv) To study the effect ofCuOon the sintering
behavior and electrical properties of PZT–PZN–PMnN ceramics.
Research objects: The main research objects of the dessertation were the
PZT - PZN - PMnN multi-component ceramic systems and the PZT - PZN -
PMnN doped CuO, Fe
2
O
3
ceramics. The ceramic samples have been
prepared in our laboratory by ourself.
Experimental methods: To obtain the above objectives, we have used the
conventional ceramic technology and the B-site oxide mixing technique
(BO) for preparing the ceramic samples.
Scientific significance and practical: The thesis is a fundamental
research have oriented applications. The systematic research of the dielectric,
piezoelectric and ferroelectric properties contribute further understanding of
the physical properties of the multi-component ceramics based on PZT and
the relaxor ferroelectric materials, Pb(Zn
1/3
Nb
2/3
)O
3
and Pb(Mn
1/3
Nb
2/3
)O
3
.
The results of the thesis will open up prospects for the fabrication of
electronic ceramic materials in our country, particularly the feasibility of
application of ceramic materials for fabricating ultrasonic sensors, ultrasonic
cleaners.
The layout of the thesis: The thesis is presented in four chapters including
118 pages.
Chapter 1. LITERATURE REVIEWS
4
Chapter 1 presents literature reviews in dissertation research, as a basis
for research and explains the survey results of physical properties of
materials such as: ferroelectric phase transition, hysteresis loops, domain
ferroelectric. Some characteristics of the PZT based ferroelectric ceramics
and the relaxor ferroelectric materials (PZN, PMnN). In addition, Raman
spectroscopy has also been introduced to explain the experimental results for
the next section.
Chapter 2. FABRICATION, STRUCTURE AND MICROSTRUCTURE
OF PZT –PZN – PMnN CERAMICS
2.1. Fabrication of PZT – PZN– PMnN ceramics
The PZT – PZN – PMnN ceramcis has been fabricated by the
conventional method and the B-site Oxide mixing technique (BO) includes
the following the sample groups:
Group 1: xPb(Zr
0,47
Ti
0,53
)O
3
– (0,925-x)Pb(Zn
1/3
Nb
2/3
)O
3
– 0,075Pb(Mn
1/3
Nb
2/3
)O
3
+
0,7 % kl Li
2
CO
3
(0,65 ≤ x ≤ 0,9); (MP: MP65, MP70, MP75, MP80, MP85
và MP90). (2.1)
Group 2:0,8Pb(Zr
y
Ti
1-y
)O
3
– 0,125Pb(Zn
1/3
Nb
2/3
)O
3
– 0,075Pb(Mn
1/3
Nb
2/3
)O
3
+
0,7 % kl Li
2
CO
3
(0,46 ≤ y ≤ 0,51); (MZ: MZ46, MZ47, MZ48, MZ49,
MZ50 và MZ51). (2.2)
Group 3: 0,8Pb(Zr
0,48
Ti
0,52
)O
3
– 0,125Pb(Zn
1/3
Nb
2/3
)O
3
– 0,075Pb(Mn
1/3
Nb
2/3
)O
3
+
0,7 % kl Li
2
CO
3
+ z % kl Fe
2
O
3
(0,0 ≤ z ≤ 0,35); (MF: MF0, MF1, MF2,
MF3, MF4, MF5 và MF6). (2.3)
Group 4: 0,8Pb(Zr
0,48
Ti
0,52
)O
3
– 0,125Pb(Zn
1/3
Nb
2/3
)O
3
– 0,075Pb(Mn
1/3
Nb
2/3
)O
3
+
w % kl CuO (0,0 ≤ w ≤ 0,175); (MC: MC0, MC1, MC2, MC3, MC4, MC5
và MC6). (2.4)
Firstly, the mixture of (Zn,Mn)Nb
2
(Zr,Ti)O
6
(BO) [33], [51] was prepared by
reactions of ZnO, MnO
2
, Nb
2
O
5
, ZrO
2
and TiO
2
at temperature of 1100
o
C for 2h.
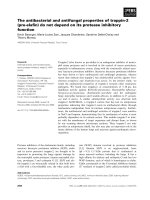
According to the results thermal analysis (DTA) and thermogravimetric analysis
(TGA) of (Zn,Mn)Nb
2
(Zr,Ti)O
6
power (Figure 2.1) can see that the formation
reaction occurs when the temperature exceeds 978
o
C. However, experimental
results showed that (Zn,Mn)Nb
2
(Zr,Ti)O
6
power was calcined at temperature
5
of 1100
o
C, the PZT-PZN-PMnN ceramics had the good electrical properties,
similarly to reports of methods [33].
Secondly, (Zn,Mn)Nb
2
(Zr,Ti)O
6
and PbO were weighed and milled for
20 h. The powders were calcined at temperature 850
o
C for 2 h, producing
the PZT–PZN–PMnN compound. Then, 0,7wt% Li
2
CO
3
was mixed with the
calcined PZT–PZN–PMnN powder and then, powders milled for 20h. The
ground materials were pressed into disk 12mm in diameter and 1.5mm in
thick under 2 ton/cm
2
. The samples were sintered in a sealed alumina
crucible with PbZrO
3
+ 10 % kl ZrO
2
coated powder at temperature 950
o
C
for 2 h. Where, the purity of reagent grade oxide powders are above 99 %.
Figure 2.1. TG and DTA curve of (Zn,Mn)Nb
2
(Zr,Ti)O
6
2.2. Structure and microstructure of PZT – PZN – PMnN ceramics
2.2.1. Structure and microstructure of MP sample group
The X-ray diffraction analysis results (Figure 2.6) showed that all
samples have pure perovskite phase with tetragonal structure. When
increasing PZT content, the tetragonality c/a ratio increases (insert picture in
Figure 2.6). According to the PbZrO
3
–PbTiO
3
phase diagram, at room
temperature Pb(Zr
0.47
Ti
0.53
)O
3
is of the tetragonal phase (space group P4mm)
[24], [25], while Pb(Mn
1/3
Nb
2/3
)O
3
is cubic structure [34], [60] and the PZN
composition was determined to be the rhombohedral (space group R3m) [3],
[24]. Therefore, with increasing molar fraction of PZT, the crystal symmetry
of ceramics should change due to the tetragonal distortions of PZT.
Sample Temperature (°C)
10008006004002000
TG |c (mg)
1
0
-1
-2
-3
HeatFlow (mW)
0
-10
-20
-30
-40
dTG |c (mg/min)
0.05
0
-0.05
-0.1
T: 239.63 (°C)
Exo
Δm (mg) -2.552
Δm (%) -6.208
T: 341.73 (°C)
T: 544.04 (°C)
T: 240.19 (°C)
T: 342.15 (°C)
T: 964.15 (°C)
T: 978.83 (°C)
6
SEM image analysis results show that the sample group of the MP have
particle density of ceramic is quite dense and are closely-packed (Figure 2.8).
The average grain size and the density of samples are increased with an
increasing amount of PZT and reach maximum (∼ 1,04 µm, 7.81 g/cm
3
,
respectivety) at the PZT content of 0.8 mol and then rapidly decrease. The
grain size and the density of ceramics have a strong effect on dielectric,
piezoelectric and ferroelectric properties of ceramic materials. The
relationships between the grain size and the density of ceramics and electrical
properties are discussed in the next section.
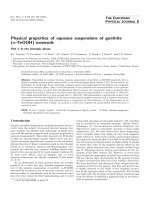
2.2.2. Structure and microstructure of MZ sample group
Figure 2.10 shows X-ray diffraction patterns (XRD) of the PZT–PZN–
PMnN ceramics with the variation of Zr/Ti ratio content. All the samples
showed a tetragonal perovskite phase. The tetragonal structures can be
determined from the double (002)
T
and (200)
T
peaks at 2θ ≈ 44.5
o
(insert
20 30 40 50 60 7 0
43 44 45 46
(2 00 )
T
In tensity (a .u)
2 θ (Degree)
(0 02 )
T
Intensity (a.u)
2 θ (Degree )
30 0
20 2
22 0
21 1
11 2
20 1
10 2
11 1
11 0
10 1
10 0
00 1
20 0
1
2
3
4
5
6
M Z4 6 - 1
M Z4 7 - 2
M Z4 8 - 3
M Z4 9 - 4
M Z5 0 - 5
M Z5 1 - 6
00 2
Figure 2.10. X-ray diffraction patterns
of MZ sample group
Figure 2.12. Microstructures of
MZ48 sample
Figure 2.8. SEM image of MP80
sample
Figure 2.6. X-ray diffraction patterns
of MP sample group
0
10 0
20 0
30 0
40 0
50 0
60 0
2 0 2 5 30 3 5 4 0 45 5 0 5 5 60 6 5 70
0 .6 0.7 0.8 0.9
1.0 10
1.0 15
1.0 20
1.0 25
1.0 30
T h e c /a ra tio
P Z T c o n te nt (m o l)
M P9 0
M P8 5
M P8 0
M P7 5
M P7 0
M P6 5
2 θ (D e gre e)
In te nsity (a.u )
7
picture in Figure 2.10). The c/a ratio decreases with increasing Zr/Ti ratio,
indicating that the tetragonality of PZT-PZN-PMnN ceramics decreased
when Zr increased. With increasing Zr content (decreasing of Ti content),
the average grain size and the density of samples increases and reaches the
maximum value at Zr/Ti ratio of 48/52, then decreases.
In order to determine chemical composition of the PZT-PZN-PMnN
ceramics, the EDS spectrum is analyzed and shown in Figure 4.14. As shown
in Figure 2.14, the EDS spectrum clearly identifies that the Pb, Zr, Ti, Nb,
Zn and Mn elements are composed in PZT-PZN-PMnN ceramics. Based on
the EDS analysis, it can be confirmed that the qualitative and quantitative
chemical composition of the PZT-PZN-PMnN ceramic are quite good.
Chapter 3. STUDY DIELECTRIC, FERROELECTRIC AND
PIEZOELECTRIC PROPERTIES OF PZT–PZN–PMnN CERAMICS
3.1. Dielectric properties of PZT–PZN–PMnN ceramics
3.1.1. Thedielectric constant of MP, MZsamplegroups at room temperature
In order to study the dielectric properties of PZT–PZN–PMnN ceramics,
the dielectric constant (ε) and dielectric loss (tanδ) of the ceramics at room
temperature was calculated from the capacitance (C
s
) of the MP, MZ sample
groups measured at frequency of 1kHz shown in Table 3.1.
When the content of PZT increases from 0.65 to 0.8 mol, values of
dielectric constant ε increase and reach maximum (ε = 1230) at 0.8 mol PZT,
Figure 2.14. EDS spectrum of PZT-PZN-PMnN ceramics
Nb
Pb
O
Ti
Zr
Nb
Ti
Mn
Zn Pb
Pb
8
and then rapidly decreased. At this contant, the dielectric loss tanδ of 0.007
(Table 3.1). Table 3.1 shows the dielectric constant ε of MZ samples in the
range from 758 to 1319 and dependence of Zr/Ti ratio. When the ratio of
Zr/Ti increases the values of ε increase and reaches a maximum (ε = 1319)
at Zr/Ti = 48/52,and then decreases. While the dielectric loss tanδ desreases
with increasing Zr/Ti ratio. The minimum values of tanδ of 0.005 was
obtained at Zr/Ti = 48/52 and then increased. The increasing of dielectric
constant can be explained by increasing grain size effect [81].
Table 3.1. The average values of dielectric constant
and dielectric loss
tan
of the sample groups MP, MZ at room temperature and at 1kHz
Samples
tanδ
Samples
tanδ
MP65
1130 ± 3
0,007
MZ46
1109 ± 4
0,007
MP70
1134 ± 2
0,008
MZ47
1227 ± 2
0,007
MP75
1152 ± 2
0,008
MZ48
1319 ± 2
0,005
MP80
1226 ± 2
0,007
MZ49
1162 ± 2
0,006
MP85
1154 ± 2
0,09
MZ50
1146 ± 3
0,006
MP90
1143 ± 3
0,01
MZ51
758 ± 4
0,007
Figure 3.1 shows the dependence of the dielectric constant ε and dielectric
loss tanδ on the temperature of MP (Figure 3.1 (a)), MZ (Figure 3.1 (b)) the
sample groups measured at frequency of 1kHz. As seen in Figure 3.1, the
dielectric properties exhibited characteristics of the relaxor ferroelectric
material in which the phase transition temperature occurs within a broad
temperature range. This is one of the characteristics of ferroelectrics with
Figure 3.1 Temperature dependence of the dielectric constant and
dielectric loss at 1 kHz of MP (a), MZ (b) sample groups
0 50 100 150 200 250 300 350
0
4000
8000
12000
16000
20000
0.00
0.04
0.08
0.12
0.16
0.20
0.24
0.28
0.32
0.36
0.40
Dielectric constant, ε
Temperature (
0
C)
Dielectric loss, tan δ
(a)
MP65
MP70
MP75
MP80
MP85
MP90
0
4000
8000
12000
16000
20000
50 100 150 200 250 300 350
0.00
0.04
0.08
0.12
0.16
0.20
1 MZ46
2 MZ47
3 MZ48
4 MZ49
5 MZ50
6 MZ51
1
2
5
6
4
3
(b)
Dielectric constant, ε
Temperature (
0
C)
Dielectric loss, tan δ
9
disordered perovskite structure. It is different compare with the PbTiO
3
ferroelectric materials [1], [3], [81].
The plot of ln(1/ε – 1/ε
max
) versus ln(T – T
m
) of PZT-PZN-PMnN
ceramics at 1 kHz is shown in figure 3.2. The slopes of the fitting curves are
used to determine the γ value. For MP samplegroups, the values of γ decrease
from 1.88 to 1.70 (Figure 3.2(a)) and the MZ sample groups, the values of γ
increase from 1.74 to 1.94 (Figure 3.2(b)). The temperature T
m
of the MP
ceramic samples increases with increasing PZT content and in the range of
206
o
C to 275
o
C and ε
max
increased to a maximum value of 18371 when the
PZT is 0.8 mol and then decreased. Because of the different phase
transformation temperatures of PZN (T
m
≈ 140
o
C) [25], [74] and PZT (T
C
≈
390
o
C) [74], so the phase transition temperature of the PZT–PZN–PMnN
ceramics should exhibit a significant dependence on PZT content [74]. For
MZ sample groups, with the increasing Zr content, the maximum of ε
max
increase and reach biggest (ε
max
= 19473) at the Zr/Ti ratio is 48/52. The
Curie temperature decreases with the increasing Zr content because the
Curie temperature of PbZrO
3
is about 232
o
C [71] and it is lower than that of
PbTiO
3
, 490
o
C [3], [74].
3.1.3. The dependence of the dielectric properties versus the frequency
Figure 3.3, 3.4 show the temperature dependence of the dielectric
constant ε and dielectric loss tanδ of the MP80 and M48 samples measured
at frequency of 1kHz, 10kHz, 100kHz and 1MHz, respectively. We can see
that the shape of the ε peaks was broad, which is typical of a case diffuse
transition with frequency dispersion. When the measured frequency
-1 0 1 2 3 4 5
MP90 → γ
6
= 1.70
MP85 → γ
5
= 1.77
MP80 → γ
4
= 1.83
MP75 → γ
3
= 1.85
MP70 → γ
2
= 1.86
MP65 → γ
1
= 1.88
Fit
Ln(1/ ε−1/ ε
max
)
Ln(T-T
m
)
(a)
Figure 3.2 Plot of ln (1/ε – 1/ε
m
) versus ln(T - T
m
) of MP (a), MZ (b)
sample groups
-1 0 1 2 3 4 5
(b)
MZ46 → γ
1
= 1.74
MZ47 → γ
1
= 1.83
MZ48 → γ
1
= 1.85
MZ49 → γ
1
= 1.93
MZ50 → γ
1
= 1.94
MZ51 → γ
1
= 1.90
Fit
Ln(1/ ε−1/ ε
max
)
Ln(T-T
m
)
10
increased, the maximum of ε
max
was decreased and shifted to higher
temperature while dielectric loss increased near the Curie point, which is
typical of a relaxor material [81].
3.2. Ferroelectric properties of PZT – PZN – PMnN ceramics
3.2.1 The effect of PZT content and Zr/Ti ratio on ferroelectric properties
of PZT – PZN – PMnN ceramics at room temperature
Figure 3.7, 3.8 show the forms of ferroelectric hysteresis loops of the
sample groups measured at room temperature. From ferroelectric hysteresis
loops of the sample groups, the remanent polarization P
r
and the coercive
field E
c
were determined, as shown in figure 3.9. The P
r
reaches the highest
value (34.5 µC/cm
2
) at PZT content of 0.8 mol and Zr/Ti ratio of 48/52. At
contents, the coercive field E
c
reaches value 9.0 kV/cm. This result is in good
agreement with the studied dielectric properties of the samples.
-25 -20 -15 -10 -5 0 5 10 15 20 25
-40
-30
-20
-10
0
10
20
30
40
MP65
MP70
MP75
MP80
MP85
MP90 MP90
MP65
MP80
MP75
MP70
MP85
Polarization, P (µC/cm
2
)
Field , E (kV/cm)
Figure 3.7 Hysteresis loops of MP
sample group
Figure 3.8 Hysteresis loops of MZ
sample group
-30 -25 -20 -15 -10 -5 0 5 10 15 20 25 30
-50
-40
-30
-20
-10
0
10
20
30
40
50
M Z46
M Z47
M Z48
M Z49
M Z50
M Z51
Polarization, P (µC/cm
2
)
Field , E (kV/cm)
Figure 3.3. Temperature dependence of
dielectric constant ε and dielectric loss
tanδ of MP sample group at different
frequencies
Figure 3.4. Temperature dependence of
dielectric constant ε and dielectric loss
tanδ of MZ sample group at different
frequencies
0
2000
4000
6000
8000
10000
12000
14000
16000
18000
20000
50 100 150 200 250 300 350
0.00
0.05
0.10
0.15
0.20
0.25
0.30
0.35
0.40
MZ48
1kHz
10kHz
100kHz
1000kHz
Dielectric constant, ε
Temperature (
0
C)
Dielectric loss, tan δ
0.0
0.1
0.2
0.3
0.4
0.5
0.6
0 50 100 150 200 250 300 350
0
2000
4000
6000
8000
10000
12000
14000
16000
18000
20000
MP80
1kHz
10kHz
100kHz
1000kHz
Dielectric constant, ε
Temperature (
0
C )
Dielectric loss, tan δ
11
3.2.2 The temperature dependence of ferroelectric properties of PZT –
PZN – PMnN ceramics
The effect of temperature on ferroelectric properties of ceramics is studied
by hysteresis loops of the MZ48 sample (Figure 3.10) measured at different
temperatures from 30
o
C to 280
o
C. When the temperature increased from
room temperature to 120 °C, the remanent polarization P
r
increased. When the
temperature rises above 120 °C, the remanent polarization P
r
and the coercive
field E
c
decreased (Figure 3.11). The reason is when the temperature increases,
the oxygen vacancies in the perovskite structure will move and significantly
increase the conductivity of the material which should increase the dielectric
loss. The size of the hysteresis loops depend on dielectric loss of the material.
Therefore, the dielectric loss increases, the size of the hysteresis loops
increases, the remanent polarization P
r
and the coercive field E
c
increases[81].
When the temperature increases (above 120
o
C), large thermal motion energy,
bipolar disorder increased, the hysteresis loops narrowed, the remanent
polarization P
r
and the coercive field E
c
decreases.
Figure 3.9. The P
r
and the E
c
as a function of PZT contents (a) and Zr/Ti
ratios (b)
0.45 0.46 0.47 0.48 0.49 0.50 0.51 0.52
6
7
8
9
10
11
12
13
14
15
16
17
18
10
15
20
25
30
35
40
(b)
Zr content (mol)
Remanent polarization, P
r
(µC/cm
2
)
Coercive field , E
c
(kV/cm)
0.60 0.65 0.70 0.75 0.80 0.85 0.90 0.95
8
9
10
11
12
13
14
10
15
20
25
30
(a)
PZT content (mol)
Remanent polarization, P
r
(µC/cm
2
)
Coercive field , E
c
(kV/cm)
-30 -20 -10 0 10 20 30
-60
-40
-20
0
20
40
60
3 0
o
C
4 0
o
C
5 0
o
C
6 0
o
C
8 0
o
C
1 0 0
o
C
1 2 0
o
C
1 4 0
o
C
1 6 0
o
C
1 8 0
o
C
2 0 0
o
C
2 2 0
o
C
2 4 0
o
C
2 6 0
o
C
2 8 0
o
C
Polariza tion, P ( µ C /cm
2
)
Field , E (kV/cm )
Figure 3.10 Hysteresis loops of MZ48
Figure 3.11. Temperature dependence of
2
4
6
8
10
12
14
16
18
0 50 100 15 0 200 25 0 300
0
5
10
15
20
25
30
35
40
45
E
C
Rem anent polarization, P
r
(µ C/cm
2
)
P
r
Coercive field , E
c
(kV/cm )
T em pe rature (
o
C )
12
3.3. Piezoelectric properties PZT- PZN-PMnN ceramics
To determine piezoelectric properties of ceramics, resonant vibration
spectrum of sample groups were measured at room temperature. From these
resonant spectra, electromechanical coefficients k
p
, k
t
, k
31
, piezoelectric
coefficients d
31
, mechanical quality factor Q
m
were determined (Figure 3.16). As
seen in Figure 3.16 (a), piezoelectric properties were strongly influenced by
the composition of the ceramics. As the increase in PZT content not only
enhanced the electrical properties, but also increased the mechanical
properties of ceramics. The values of k
p
, k
t
, k
31
, d
31
and Q
m
reach maximum
(k
p
= 0.58, k
t
= 0.48, k
31
= 0.34, d
31
= 130 and Q
m
= 1034) at 0.8 mol PZT,
and then rapidly decreased with increasing x content. These results are
consistent with the literature [74].
For MZ sample group (Figure 3.16 (b)), when the amount of Zr/Ti ratio
is lower than 48/52, the k
p
, k
t
, k
31
, d
31
are rapidly increased with increasing
Zr/Ti ratio, while the mechanical quality factor Q
m
and the dielectric loss
tanδ are lightly decreased. This is probably related to characteristics of the
increasing grain size. As is well known, the increased grain size makes
domain reorientation easier and severely promotes domain wall motion,
which could increase the piezoelectric properties [81].
Hình 6. S
ự phụ thuộc của tr
ường kháng E
c
và đ
ộ
phân c
ực dư P
r
theo nhi
ệt độ của gốm PZT
-PZN-
PMnN.
Figure 3.16 The values of k
p
, k
t
, k
31
, d
31
, Q
m
and tanδ of the PZT-PZN-PMnN
ceramic as a function of PZT contents (a) and Zr/Ti ratios (b)
0.2
0.3
0.4
0.5
0.6
0.6 0.7 0.8 0.9
600
700
800
900
1000
1100
1200
1300
1400
60
80
100
120
140
160
k
p
k
t
k
31
Piezoelectric coefficients, d
31
(pC/N)
Mechanical quality factor, Q
m
Electromechanical coefficients, k
p
, k
t
, k
31
PZT content (mol)
Q
m
d
31
(a)
0.2
0.3
0.4
0.5
0.6
0.7
0.45 0.46 0.47 0.48 0.49 0.50 0.51 0.52
800
1000
1200
1400
1600
60
80
100
120
140
160
k
p
k
t
k
31
Q
m
Piezoelectric coefficients, d
31
(pC/N)
Mechanical quality factor, Q
m
Electromechanical coefficients, k
p
, k
t
, k
31
Zr content (mol)
(b)
d
31
13
Chapter 4. STUDY THE EFFECTS OF CuO, Fe
2
O
3
ON
PROPERTIES OF PZT–PZN–PMnN CERAMICS
4.1. Effect of Fe
2
O
3
on properties of PZT-PZN-PMnN ceramics
To improve the mechanical quality factor Q
m
and dielectric loss tanδ of
PZT-PZN-PMnN ceramics, Fe
2
O
3
doping were mixed into the PZT-PZN-
PMnN ceramics.
4.1.1. Effect of Fe
2
O
3
on structure, microstructure of PZT-PZN-PMnN ceramics
Figure 4.1 shows X-ray diffraction patterns (XRD) of the PZT–PZN–
PMnN ceramics at the different contents of Fe
2
O
3
. All samples have
perovskite phase with tetragonal structure. When increasing of Fe
2
O
3
content, the tetragonality c/a ratio increases as shown in insert figure 4.1(a).
It can be determined from the (002)
T
and (200)
T
double peaks at 2θ ≈ 44.5
o
(figure 4.1(b)).
Figure 4.3 shows the SEM micrographs of the fracture surface of the
samples as Fe
2
O
3
addition. It is seen from the micrographs that the grain size
grows with the increase of Fe
2
O
3
addition. Below the 0.25 wt% Fe
2
O
3
, the
grain sizes increase and the grain boundaries present regular shapes.
However, when the addition of Fe
2
O
3
is higher than 0.25 wt%, a few cavities
appeared between the grains (MF5, MF6 samples).
43.0 43.5 44.0 44.5 45.0 45.5 46.0
(b)
M6
M2
M1
(002)
T
(200)
R
(200)
T
M0
M5
M4
M3
M2
M1
M0
2 θ (D egree)
Intensity (a.u.)
20 30 40 50 60 70
0.0 0 .1 0 .2 0 .3 0.4
4.0 0
4.0 2
4.0 4
4.0 6
4.0 8
4.1 0
4.1 2
1.0 10
1.0 15
1.0 20
1.0 25
1.0 30
F e
2
O
3
con ten t (% wt )
a
c
a ,c (A
o
)
c /a
c /a ra tio
0 M F 0
1 M F 1
2 M F 2
3 M F 3
4 M F 4
5 M F 5
6 M F 6
0
300
202
220
211
112
201
102
111
110
101
100
001
200
1
2
3
4
5
6
002
(a)
R10 0
R11 1
2 θ (D egree)
Intensity (a.u.)
Figure 4.1 The XRD patterns of PZT–PZN–PMnN ceramics
14
Figure 4.3 Microstructures of samples with the different Fe
2
O
3
contents
4.1.2.Effect of Fe
2
O
3
on dielectric properties of PZT-PZN-PMnN ceramics
Figure 4.4 shows the dependence of dielectric constant
and dielectric
loss tan
of the ceramics versus temperature at frequency of 1 kHz. With
increasing Fe
2
O
3
doping, the ε
max
increased to a maximum value of (24500)
when the Fe
2
O
3
content is 0.25wt% and then decreased. This can be
explained by increasing grain size effect [81]. Corresponding Fe
2
O
3
content
increases, T
m
temperature of ceramics lightly decreased from 244 to 234
o
C
(Figure 4.5).
MF
0
MF
5
MF
2
MF
3
MF
6
MF
4
0.05
0.10
0.15
0.20
0.25
0.30
0.35
0.40
50 100 150 200 250 300 350
0
5000
10000
15000
20000
25000
MF0
MF1
MF2
MF3
MF4
MF5
MF6
Dielectric loss, tanδ
Dielectric constant, ε
Temperature (
o
C)
3
4
0.0 0.1 0.2 0.3 0.4
220
230
240
250
260
Fe
2
O
3
content (% wt)
Curie temperature, T
m
(
o
C )
Figure 4.4 Temperature dependence of
the dielectric constant and dielectric
loss at 1 kHz of samples
Figure 4.5 The temperature T
m
of
Fe
2
O
3
-doped PZT–PZN–PMnN
ceramic samples
20 0 40 0 6 0 0 8 0 0 10 0 0
In te n s ity (a .u )
Ram an S h ift ( cm
-1
)
A
1
(3 LO )
R
h
E (4 LO )
R
1
E (2 LO )
A
1
(2 TO )
E + B
1
E (2 TO )
A
1
(1 TO )
M 0
M 6
260
262
264
266
268
270
272
274
135
140
145
150
155
160
0.0 0.1 0.2 0.3 0.4
180
190
200
210
220
230
560
580
600
620
640
660
680
700
E(4LO), R
1
(cm
-1
)
Silent E +B
1
E + B
1
(cm
-1
)
R
1
A
1
(1TO)
A
1
(2TO)(cm
-1
)
Fe
2
O
3
content
E(4LO)
E(2TO
1
)
E(2TO
1
)(cm
-1
)
200 400 600 800 1000
Intens ity (a.u)
Ram an Shift (cm
-1
)
A
1
(3L O)
R
h
E(4LO )
R
1
E(2LO )
A
1
(2T O)
E + B
1
E(2TO )
A
1
(1T O)
M 0
M 6
(a)
260
262
264
266
268
270
272
274
135
140
145
150
155
160
0.0 0.1 0.2 0.3 0.4
180
190
200
210
220
230
560
580
600
620
640
660
680
700
E(4LO), R
1
(cm
-1
)
Silent E +B
1
E + B
1
(cm
-1
)
R
1
A
1
(1TO)
A
1
(2TO)(cm
-1
)
Fe
2
O
3
content
E(4LO)
E(2TO
1
)
E(2TO
1
)(cm
-1
)
(b)
15
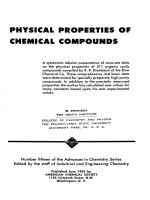
Figure 4.8(a) shows the Raman scattering spectra of Fe
2
O
3
-doped PZT–
PZN-PMnN ceramics measured at room temperature. Compared with
PbTiO
3
[1] and Pb(Zr,Ti)O
3
[64], the vibration bands in the Raman scattering
spectra of Fe
2
O
3
-doped PZT–PZN–PMnN samples seem wider and more
dispersive. It can be seen from this figure that the silent mode at about 268
cm
-1
shifts to a low frequency as the Fe
2
O
3
doping increases. Dilsom [18]
assumed that the decrease in frequency with increasing Fe
2
O
3
contents is due
to the difference in the atomic mass of Zr (91.22 g), Ti (47.87 g), Nb (92.90
g), Zn (65.39 g), and Mn (54.94 g) when they are replaced by Fe (56 g) in
the B site. The shift of the silent mode to a low frequency due to Fe
2
O
3
content increases the average energy of the B–O bonding hence T
m
of the
ceramics are decreased [91].
The value of γ gives information on the phase transition diffuse
characterized. The values of γ increases with increase of Fe
2
O
3
contents
0 1 2 3 4 5
-28
-24
-20
-16
-12
-8
-4
0
M 0 → γ
0
= 1.88
M 1 → γ
0
= 1.90
M 2 → γ
0
= 1.91
M 3 → γ
0
= 1.93
M 4 → γ
0
= 1.94
M 5 → γ
0
= 1.79
M 6 → γ
0
= 1.67
Fit
Ln(1/ ε -1/ ε
m
)
Ln(T-T
m
)
0.0 0.1 0.2 0.3 0.4
30 .6
30 .8
31 .0
31 .2
31 .4
69
70
71
72
51
52
53
54
55
98
10 0
10 2
10 4
45
48
51
54
Fe
2
O
3
content (% wt)
FW HM (cm
-1
)
(E+B
1
)
E(4LO)
R
1
E (2TO
1
)
A
1
(1TO)
Figure 4.9 Ln(1/
−1/
max
) as a function of ln(T
−T
max
) of samples FWHM
of the PZT-PZN-PMnN samples as a function of Fe
2
O
3
16
(Figure 4.9(a)). It is found that the full width at half maximum (FWHM) of
the B–O vibrations exhibit an obvious increase, leading to a strong
composition disorder (Figure 4.9(b)). However, when the Fe
2
O
3
content is
higher than 0.25 wt%, the value of γ and FWHM decreases. This can be
explained by the solubility limit of Fe ion in the PZT-PZN-PMnN ceramics.
4.1.3. Effect of Fe
2
O
3
on piezoelectric properties of PZT-PZN-PMnN ceramics
To determine piezoelectric properties of ceramics, resonant vibration
spectra of samples were measured at room temperature (Figure 4.11). From
these resonant spectra, piezoelectric parameters of samples were determined
(Figure 4.12).
Figure 4.11. Spectrum of radial resonance (a) and thick resonance (b) of MF4
sample
Figure 4.12 shows the electromechanical coupling factor (k
p
, k
t
), the
piezoelectric constant (d
31
), the mechanical quality factor Q
m
and dielectric
loss tanδ change as a function of the amount of Fe
2
O
3
. The mechanical
quality factor (Q
m
) and the dielectric loss (tanδ) of the Fe
2
O
3
-doped PZT–
PZN–PMnN ceramics markedly improved, as shown in Fig. 4.12. As the
Fe
2
O
3
content in the PZT–PZN–PMnN ceramics was increased up to 0.25
wt%, the Q
m
value increased steadily up to 1450 while dielectric loss tanδ
decreased steadily down to the lowest value (tanδ =0.003) because the Fe
ions at the (Ti, Zr, Nb) sites in the lattice acted as acceptors. As can be seen
in Figure. 4.12, the k
p
, k
t
and the d
31
show a similar variation with increasing
Fe
2
O
3
content. When the content of Fe
2
O
3
is lower than 0.25 wt%, the k
p
, k
t
and the d
31
were increased with increasing Fe
2
O
3
content. The optimized
values for k
p
of 0.64, k
t
of 0.51 and d
31
of 155 pC/N were obtained at content
Fe
2
O
3
= 0.25 wt%. This is probably related to characteristics of the increasing
grain size.
1 2 3 4 5 6 7 8
0
1000
2000
3000
4000
5000
6000
7000
8000
Z ( Ω )
(b)
Frequency, f (M Hz)
10
0
10
1
10
2
10
3
10
4
10
5
10
6
200 210 220 230 240 250
-100
-80
-60
-40
-20
0
20
40
60
80
100
Z ( Ω )
Frequency, f (kHz)
(a)
θ (D egree)
17
4.1.4. Effect of Fe
2
O
3
on ferroelectric properties of PZT-PZN-PMnN ceramics
From the form of feroelectric hysteresis loops of the Fe
2
O
3
doped PZT-
PZN-PMnN samples measured at room temperature, the remanent
polarization P
r
and the coercive field E
c
were determined, as shown in Table
4.5.
Table 4.5. The characterize parameters of ferroelectric properties (P
r
, E
c
) of Fe
2
O
3
doped PZT-PZN-PMnN
Samples
MF0
MF1
MF2
MF3
MF4
MF5
MF6
E
C
(kV/cm)
9,8
9,8
8,4
9,0
8,6
8,7
10,5
P
r
(µC/cm
2
)
34,5
34,1
35,6
36,0
37,0
35,0
26,0
A sharp increase in P
r
was observed for MF
0
-MF
4
samples, reaches the
highest value (37 µC/cm
2
) with MF4 sample, and then decreases. This result
is in good agreement with the studied dielectric and piezoelectric properties
of the samples. While, the coercive field E
c
decreases with increasing of
Fe
2
O
3
content. The minimum value of the E
c
is 8.6 kV/cm were obtained at
content of Fe
2
O
3
= 0.25 wt%.
4.2. Effect of CuO on the sintering behavior and electrical properties of
PZT–PZN–PMnN ceramics
4.2.1. Effect of CuO on the sintering behavior of PZT–PZN–PMnN ceramics
Many material scientists are interested in research [29], [34], [64], [87] in
PZT−PZN−PMnN ceramics due to their large dielectric constant ε, large
electromechanical coefficient k
p
, large polarization P
r
, high mechanical quality
-30 -25 -20 -15 -10 -5 0 5 10 15 20 25 30
-60
-50
-40
-30
-20
-10
0
10
20
30
40
50
60
M F1
M F2
M F3
M F4
M F5
M F6
P (µC/cm
2
)
E (kV/cm)
MF
Figure 4.13 Hysteresis loops of Fe
2
O
3
-
doped PZT-PZN-PMnN ceramics
Figure 4.12. The k
p
, k
t
, d
31
, Q
m
, and tanδ
as a function of Fe
2
O
3
contents
0.40
0.44
0.48
0.52
0.56
0.60
0.64
0.68
0.72
0.0 0.1 0.2 0.3 0.4
600
800
1000
1200
1400
1600
1800
2000
60
80
100
120
140
160
0.002
0.004
0.006
0.008
0.010
0.012
0.014
0.016
k
t
k
p
The piezoelectric constant d
31
(pC/N)
The mechanical quality factor, Q
m
Electromechanical coupling factor, k
p
, k
t
Tanδ
Fe
2
O
3
content (%wt)
Q
m
d
31
Dielectric loss tanδ
18
factor Q
m
, and suitabilityfor the application of ultrasound transducers. However,
the sintering temperature of this ceramic system is quite high (1150 °C), [29],
[64]. The most common and effective method to reduce the sintering
temperature of PZT based ceramics is using various additives such as
BiFeO
3
, CuO, CuO-ZnO, Li
2
CO
3
, Bi
2
O
3
, LiBiO
2
, B
2
O
3
, CuO-PbO, Cu
2
O-
PbO to create low-temperature liquid phases of ceramics [5], [13], [15], [16],
[20], [23], [33], [35], [41], [44], [53]. In this section, we have chosen the
CuO doped 0,8Pb(Zr
0,48
Ti
0,52
)O
3
- 0,125Pb(Zn
1/3
Nb
2/3
)O
3
-
0,075Pb(Mn
1/3
Nb
2/3
)O
3
ceramics sintered at 800
o
C; 830
o
C; 850
o
C and 870
o
C.
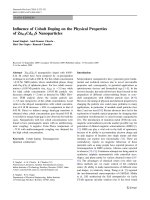
Figure 2.14 shows the densities as a function of sintering temperature for
PZT-PZN-PMnN ceramics with various CuO additions. With increasing
sintering temperature and CuO content, the density increases and reaches the
maximum value (7.91 g/cm
3
) at 850
o
C and 0.125 wt % CuO content, before
the density starts to decrease. The sintering temperature of undoped PZT-
PZN-PMnN ceramics was higher 1150 °C (the density of 7.83 g/cm
3
). From
the phase diagram of Hitoshi Kitaguchi [17] has shown that CuO and PbO
form the liquid phase at point eutectic 789°C. So when CuO doped in PZT-
PZN-PMnN ceramics, CuO reacted with PbO and formed a liquid phase
during the sintering, which assisted the densi
fication of the specimens.
Thus,
the addition of CuO improved the sinterability, reduced the sintering
Sample
M0-1150
D
(g/cm
3
)
ε
tanδ
k
p
M01
7,85
1217
0,007
0,57
M02
7,83
1108
0,007
0,56
M03
7,81
1209
0,006
0,55
M04
7,85
1168
0.007
0,55
TB
7,83
1219
0,007
0,56
Table 4.7. Thedensity,
, tan
, k
p
of
M0-1150 sample
Figure 2.14. The density of PZT-PZN-
PMnN ceramics with di
ff
erent amounts
of CuO additive sintered at 800
o
C,
830
o
C, 850
o
C, 870
o
C
19
temperature by 300 °C compared with pure samples and increasing density
of the ceramic samples.
4.2.2. Effect of CuO on electrical properties of PZT–PZN–PMnN ceramics
4.2.2.1 Effect of CuO on structure, microstructure of PZT–PZN–PMnN ceramics
In order to determine chemical composition of the CuO doped PZT-
PZN-PMnN ceramics, the EDS spectrum is analyzed and shown in Figure
4.20. From Figure 4.20 shows the presence of Pb, Zr, Ti, Nb, Zn, Mn and Cu
elements of the CuO doped PZT-PZN-PMnN ceramics. As seen in Figure
4.21 that all the samples with the addition of CuO had a tetragonal structure
as indicated by the splitting of (002) and (200) peaks at 2θ ≈ 44
0
. This result
suggests that Cu
2+
ions are substituted for B-site of perovskite structure
ABO
3
which lead to the distortion of crystal lattice.
The microstructure of MC4 sample (0,125 wt % CuO) becomes dense and
large grain size (1,2 µm, Figure 4.22). It is sample large density of ceramic
(7.91 g/cm
3
).
Figure 4.21 X-ray diffraction
patterns of the MC samples
2 0 2 5 30 3 5 4 0 45 5 0 5 5 6 0 6 5 70
1 0 0
0
0: 0 .0 0 0 w t% C u O
1: 0 .0 5 0 w t% C u O
2: 0 .0 7 5 w t% C u O
3: 0 .1 0 0 w t% C u O
4: 0 .1 2 5 w t% C u O
5: 0 .1 5 0 w t% C u O
6: 0 .1 7 5 w t% C u O
1
6
0 0 1
1 0 1
3 0 0
2 2 0
2 1 1
1 1 2
2 0 1
1 0 2
1 1 1
2 0 0
0 0 2
R 1 0 0
R 3 0 0
R 2 2 0
R 2 1 1
R 2 1 0
R 1 1 1
R 2 0 0
2 θ (D eg re e )
In te n s ity (a .u.)
1
2
3
4
5
Figure 4.22 Microstructures of MC4
sample
Nb
Pb
O
Ti
Zr
Nb
Ti
Mn
Cu Cu Pb Pb
Figure 4.20. EDS spectrum of CuO doped PZT-PZN-PMnN ceramics
20
4.2.2.2 Effect of CuO on dielectric properties of PZT-PZN-PMnN ceramics
Figure 4.23 shows temperature dependence of dielectric constant ε and
dielectric loss tanδ as a function of CuO content. With increasing CuO doping,
the T
m
temperature of PZT-PZN-PMnN ceramics become lower, the peak of the
dielectric spectrum moves toward low temperature corresponding to T
m
temperature. The composition with 0.125 wt % CuO content shows highest peak
dielectric constants (12000), which appears at about 266
o
C.
Figure 4.24 shows the values of γ at 1 kHz are found from 1.63 to 1.86
indicating transitions are of diffuse type. The value of γ shows that the
material is highly disordered.
4.2.2.3. Effect of CuO on piezoelectric properties of PZT-PZN-PMnN ceramics
From these resonant spectra, piezoelectric parameters of samples were
determined (Figure 4.26). Figure 4.26 shows the electromechanical coupling
factor (k
p
, k
t
), the piezoelectric constant (d
31
), the mechanical quality factor
Q
m
and dielectric loss tanδ change as a function of the amount of CuO. When
the amount of CuO is lower than 0.125 wt %, the values of k
p
, k
t
, d
31
, ε and
Q
m
are rapidly increased with increasing content of CuO, while the dielectric
loss tanδ are strong decreased. The largest values for k
p
of 0.55, k
t
of 0.46,
0
2000
4000
6000
8000
10000
12000
14000
50 100 150 200 250 300 350
0.0
0.2
0.4
0.6
0.8
1.0
1.2
MC0
MC1
MC2
MC3
MC4
MC5
MC6
Dielectric constant, ε
Dielectric loss, tan δ
Temperature (
0
C)
0 1 2 3 4 5
M 0 → γ
0
= 1.63
M 1 → γ
1
= 1.74
M 2 → γ
2
= 1.77
M 3 → γ
3
= 1.84
M 4 → γ
4
= 1.86
M 5 → γ
5
= 1.77
Ln(T-T
m
)
Ln(1/ ε− 1/ ε
m ax
)
M 6 → γ
6
= 1.62
F it
Figure 4.23. Temperature dependence
of dielectric constant ε and dielectric
loss of the MC sample group at 1 kHz.
Figure 4.24. Plot of ln(1/ε – 1/ε
m
)
versus ln(T - T
m
) of MC sample
groups
Figure 4.23. Temperature dependence
of dielectric constant ε and dielectric
loss of the MC sample group at 1 kHz.
21
d
31
of 112 pC/N, Q
m
of 1174 and minimum value of the dielectric loss tanδ
is 0.006 were obtained at content of CuO = 0.125 % wt. These are probably
related to characteristics of the density and the increasing grain size and the
mechanism of the CuO hard doping in PZT - PZN - PMnN ceramics.
4.3. Fabrication ultrasonic cleaner on PZT-PZN-PMnN based ceramics
The PZT - PZN - PMnN + 0,10 % kl CuO ceramic sintered at 850 °C have
good electrical properties for fabrication ultrasonic transducers. Therefore,
we used of the PZT-PZN-PMnN doped CuO ceramics for fabricating
ultrasonic cleaners. On that basis, we successfully fabricated an ultrasonic
cleaner (Figure 4.31) with working frequency of 40.26 kHz. From the effects
of cavitacy (figure 4.32), the power of ultrasonic cleaner determined about
40 W.
Figure 4.31. the ultrasonic cleaner
finished
Figure 4.32. The operation image of
ultrasonic cleaning
22
CONCLUSIONS
The thesis is presented in four chapters with the research results obtained
as follows:
- We have used the conventional ceramic technology and the B-site oxide
mixing technique (BO) for preparing the ceramic samples. We have
successfully synthesized 4 types of sample groups (MP, MZ, MF and MC)
of PZT-based ceramics and the relaxor ferroelectric materials (PZN, PMnN)
with perovskite structure. The sample components were systematic and had
a high repeatability. We used the method of X-ray diffraction analysis,
scanning electron microscopy, Raman spectroscopy and EDS spectrum to
check quality of the ceramic samples.
- The characteristic parameters of dielectric, piezoelectric ferroelectric
properties of PZT - PZN - PMnN ceramics have been investigated.
Experimental results showed that the electical properties of PZT - PZN -
PMnN ceramics are optimal at PZT content of 0.8 mol and Zr/Ti ratio of
48/52. At these contents the ceramics have good electrical properties: d
31
=
140 pC/N; k
p
= 0.62; k
t
= 0.51, Q
m
= 1112, tanδ = 0.005 and P
r
= 34,5µC/cm
2
.
- On the basis of the experimental results of the effects of temperature and
frequency on the dielectric, ferroelectric, piezoelectric properties of ceramics
has proven that the PZT - PZN - PMnN quaternary ceramics are relaxor
ferroelectrics.
- The results of studies on the effects of Fe
2
O
3
doping on the electrical
properties of PZT – PZN – PMnN ceramics have proved that Fe
2
O
3
is hard
doping in PZT - PZN – PMnN ceramics. The hard characteristics of Fe
2
O
3
doped PZT - PZN – PMnN ceramics have shown that the dielectric loss of
ceramic decreased, the mechanical quality factor of ceramic increased.
Moreover, Fe
2
O
3
doping also increased the average particle size and
significantly improve the dielectric, piezoelectric and ferroelectric properties
of ceramics.
23
- Successful use of CuO reduced significantly the sintering temperature of
the PZT-PZN -PMnN ceramics. With CuO content of 0.125 wt%, temperature
sintering of ceramics decreased from 1150
o
C to 850
o
C. Thus the sintering
temperature of ceramics decreased 300
o
C compared to samples without CuO
(density of 7.91g/cm
3
, ε = 1179, k
p
= 0.55, Q
m
= 1174 and tanδ = 0.006).
- Applications of the PZT-PZN-PMnN doped CuO ceramics for
fabricating ultrasonic cleaners have been successful with working frequency
of 40.26 kHz and the power of ultrasonic cleaner about 40 W.
LIST OF PUBLICATIONS
1) Phan Đ
ình Gi
ớ vàLê Đại Vương(2011),Tính chất điện môi, sắt điện của gốm PZT-
PZN-PMnN. Tạp chí khoa học, Đại học Huế, Số 65, tr. 53-61.
2) Phan Đ
ình Gi
ớ và Lê Đại Vương (2011), Ảnh hưởng của nồng độ PMnN đến cấu
trúc và các tính chất áp điện của gốm PZT-PZN-PMnN. Tạp chí khoa học, Đại học
Huế, Số 65, tr. 63-71.
3) Phan Đ
ình Gi
ớ, Nguyễn ThịBích Hồng,Lê Đại Vương (2012),Ảnh hưởng của tỉ số
nồng độ Zr/Ti đến các tính chất vật lý của hệ gốm PZT-PZN-PMnN. Tạp chí Khoa
học và Công nghệ 50 (1A),tr. 112-118.
4) Phan Đ
ình Gi
ớ, Nguyễn Văn Quý,Lê Đại Vương (2012),Sựphụ thuộc nhiệt độ của
một sốtính chất vật lý của hệgốm PZT-PZN-PMnN.Tạp chí Khoa học và Công nghệ
50 (1A), tr. 235-240.
5) Phan Đ
ình Gi
ớ,Lê Đại Vương, Nguyễn ThịTrường Sa(2013), Ảnh hưởng của thời
gian thiêu kết đến một số tính chất của hệ gốm áp điện PZT-PZN-PMnN thiêu kết ở
nhiệt độ thấp, Tạp chí khoa học, Đại học Huế, Tập 87, Số9, (2013), tr. 45-51.
6) Phan Đ
ình Gi
ớ, Lê Đại Vương và Nguyễn Quang Long (2013),Nghiên cứu, chế tạo
máy rửa siêu âm trên cơ sở hệ gốm PZT - PZN – PMnN, Hội nghị toàn quốc lần thứ
3 Vật lý kỹ thuật và ứng dụng (CAEF-2013), Huế, 8-12 tháng 10 năm 2013.
7) Phan Đ
ình Gi
ớ, Lê Đại Vương, Hồ Thị Thanh Hoa, Ảnh hưởng của CuO đến nhiệt
độthiêu kết của gốm áp điện PZT-PZN-PMnN,Hội nghị Vật lý chất rắn và Khoa học
vật liệu toàn quốc lần thứ 8 (SPMS-2013) – Thái Nguyên 4-6/11/2013 (đ
ã
đư
ợcTạp
chí Khoa học và Công nghệ 50 nhận đăng 5/6/2014).
8) Lê Đại Vương, Đỗ Văn Quảng, Phan Đ
ình Gi
ớ (2013), Ảnh hưởng của nhiệt độ
thiêu kết đến cấu trúc và các tính chất điện của gốm PZT-PZN-PMnN pha tạp Fe
2
O
3
,
Tạp chí khoa học, Đại học Huế, Tập 87, Số 9, (2013), tr. 225-231.
9) Lê Đại Vương, Hồ Thị Thanh Hoa, Nguyễn Thị Thu Hà, Phan Đ
ình Gi
ớ (2012),
Ảnh hưởng của chế độ ủ đến một số tính chất vật lý của hệ gốm PZT-PZN-PMnN.
Tạp chí khoa học, Đại học Huế, Tập 73, số 4, tr. 253-261.