- Trang chủ >>
- Khoa Học Tự Nhiên >>
- Vật lý
physical properties of aqueous suspensions of goethite nanorods
Bạn đang xem bản rút gọn của tài liệu. Xem và tải ngay bản đầy đủ của tài liệu tại đây (679.66 KB, 18 trang )
DOI 10.1140/epje/i2003-10078-6
Eur. Phys. J. E 13, 291–308 (2004)
THE EUROPEAN
PHYSICAL JOURNAL E
Physical properties of aqueous suspensions of goethite
(α-FeOOH) nanorods
Part I: In the isotropic phase
B.J. Lemaire
1
,P.Davidson
1,a
,J.Ferr´e
1
, J.P. Jamet
1
, D. Petermann
1
, P. Panine
2
,I.Dozov
3
, and J.P. Jolivet
4
1
Laboratoire de Physique des Solides, UMR CNRS 8502, Bˆatiment 510, Universit´e Paris-Sud, 91405 Orsay, France
2
European Synchrotron Radiation Facility, B.P. 220, 38043 Grenoble, France
3
Nemoptic, 1 rue Guynemer, 78114 Magny-les-Hameaux, France
4
Laboratoire de Chimie de la Mati`ere Condens´ee, UMR CNRS 7574, Universit´e Paris 6, 4 Place Jussieu, 75252 Paris, France
Received 22 July 2003 and Received in final form 1 December 2003 /
Published online: 21 April 2004 –
c
EDP Sciences / Societ`a Italiana di Fisica / Springer-Verlag 2004
Abstract. Depending on volume fraction, aqueous suspensions of goethite (α-FeOOH) nanorods form a
liquid-crystalline nematic phase (above 8.5%) or an isotropic liquid phase (below 5.5%). In this article, we
investigate by small-angle X-ray scattering, magneto-optics, and magnetometry the influence of a magnetic
field on the isotropic phase. After a brief description of the synthesis and characterisation of the goethite
nanorod suspensions, we show that the disordered phase becomes very anisotropic under a magnetic field
that aligns the particles. Moreover, we observe that the nanorods align parallel to a small field (< 350 mT),
but realign perpendicular to a large enough field (> 350 mT). This phenomenon is interpreted as due to the
competition between the influence of the nanorod permanent magnetic moment and a negative anisotropy
of magnetic susceptibility. Our interpretation is supported by the behaviour of the suspensions in an
alternating magnetic field. Finally, we propose a model that explains all experimental observations in a
consistent way.
PACS. 61.30 v Liquid crystals – 64.70.Md Transitions in liquid crystals – 75.50.Ee Antiferromagnetics
– 82.70.Kj Emulsions and suspensions
1 Introduction
Liquid-crystalline suspensions of mineral particles have re-
cently been the subject of renewed interest because they
may combine the fluidity and anisotropy of liquid crys-
tals with the specific magnetic and transport properties of
mineral compounds [1]. Since their discovery by H. Zocher
in 1925 [2], mineral liquid crystals (MLCs) have also pro-
vided convenient experimental systems to test statistical-
physics theories of phase transitions such as the Onsager
model [3, 4]. Moreover, mineral low-dimensionality com-
pounds can provide very original building blocks com-
pared to the ones produced by usual organic synthesis [5].
In some cases, MLCs, such as laponite clay or V
2
O
5
aqueous suspensions are already employed in the indus-
try [6–8].
As an illustration of these general ideas, we recently
reported in a letter the very unusual magnetic proper-
ties of the nematic suspensions of goethite (α-FeOOH)
nanorods [9]. Goethite is one of the most common and sta-
ble iron oxides. It was already used by the cavemen to pro-
duce the ochre colour for their wall paintings and it is still
a
e-mail:
being used nowadays in the paint industry [10]. Goethite
can be produced as nanorods through “chimie douce”
techniques (i.e. low-temperature solution chemistry) and
dispersed in water in reasonable amounts to form stable
suspensions [11]. We have shown that these suspensions
form a nematic phase that aligns in very weak magnetic
fields. Moreover, both in the nematic and isotropic phases,
the nanorods orient parallel to the field at low field intensi-
ties but reorient perpendicularly in higher fields. It should
be noted that some of the magneto-optical effects in the
isotropic phase reported here were already studied long
ago by Majorana and by Cotton and Mouton at the be-
ginning of the 20th century [12]. However, it seems that
they worked on suspensions of mixed iron oxides and they
did not discuss their observations in the general context
of liquid crystals that were then very recently discovered.
We have described and discussed these unexpected phe-
nomena in detail in two papers. The first and present one
is mostly devoted to the study of the magnetic proper-
ties of the isotropic phase of the suspensions. The second
one deals with the isotropic/nematic phase transition and
with the effects of applying a magnetic field or an electric
field to nematic suspensions.
292 The European Physical Journal E
L
a
≈
25 nm
L
b
≈
150 nm
L
c
≈
10 nm
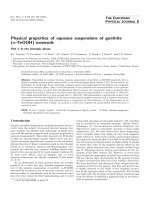
Fig. 1. Dimensions and crystallographic structure of goethite
nanorods. The structure is made up of chains of oxygen octa-
hedra with an iron atom at the centre of each octahedron and
a hydrogen atom bonded to it.
The outline of this article is as follows. In the next
section, we describe the chemical synthesis and colloidal
stability of the suspensions of goethite nanorods. We also
recall the crystallographic structure, the optical and mag-
netic properties of goethite, and we determine the nanorod
size and polydispersity distributions. Section 3 describes
the various setups used in this study. Our experimental
results about the magnetic properties of the isotropic sus-
pensions are detailed and briefly discussed in Section 4.
A simple model is then given in Section 5 to account for
these quite unusual observations.
2 Synthesis and characterisation of
suspensions of goethite nanorods
2.1 Synthesis
Goethite suspensions were synthesised by following an al-
ready described procedure [11]. A molar solution of NaOH
is added, under stirring, to 400 ml of a decimolar solution
of Fe(NO
3
)
3
until pH ≈ 11 is reached. An ochre ferrihy-
drite precipitate instantly forms. The suspension is left
for ten days at room temperature. It is then centrifuged
(10000 rpm for 10 minutes), the precipitate is recovered
and redispersed in distilled water. This operation, which
aims at removing unnecessary ions, is repeated twice. The
suspension is again centrifuged and the precipitate is re-
dispersed in 3 M HNO
3
in order to electrostatically charge
the surface of the particles by proton adsorption. Finally,
the suspension is rinsed three times to bring the pHback
to about 3. The final volume of the suspension is adjusted
so that the concentration is large enough to reach the ne-
matic/isotropic phase equilibrium (i.e. a volume fraction
between 6 and 11% for different syntheses). The suspen-
sion demixes within a day into typically 5 ml of each phase;
it will be called “synthesis batch” in the following.
The synthesis product was characterised by powder X-
ray diffraction. The solid part of a sample of the synthesis
batch was recovered by centrifugation, then dried under
nitrogen atmosphere, and powdered. Its diffractogram was
recorded and identified to that of pure goethite. In par-
ticular, no traces of haematite (α-Fe
2
O
3
, a very stable
and common iron oxide) were found. The crystallographic
structure of goethite can be represented in the Pnma or-
thorhombic space group (Fig. 1). The unit-cell parameters
are a =0.995 nm, b =0.302 nm, c =0.460 nm. (Actu-
ally, this structure is also sometimes represented in the
Pbnm space group, with a =0.460 nm, b =0.995 nm,
c =0.302 nm.) Oxygen atoms form a hexagonal compact
lattice along the c-direction and the Fe
3+
cations occupy
half of the octahedric sites. The structure can also be de-
scribed as the stacking of double chains of oxygen octahe-
dra occupied by Fe
3+
cations, oriented in the b-direction.
These double chains are linked to adjacent ones by corner-
sharing and hydrogen bonds. Electron microscopy images
and in situ electron diffraction show that the goethite par-
ticles obtained under these synthesis conditions are rect-
angular parallelepipeds with length L
b
, width L
a
,and
thickness L
c
, respectively oriented along the b, a,andc
crystallographic axes.
2.2 Colloidal stability
The electrostatic repulsion between particles must be as
large as possible to ensure the stability of goethite suspen-
sions against flocculation. This is achieved when the sur-
face electric charge is large and the ionic strength as low as
possible. These two parameters, that depend on pH, must
be known to reach a reasonable description of the thermo-
dynamic properties of the suspensions. The surface charge
of goethite nanorods was measured as a function of pHac-
cording to an already described method [11,13,14]. At low
pH, hydroxo –OH groups adsorb protons to form –OH
+
2
aquo groups, whereas, at high pH, other –OH groups lose
protons to form oxo –O
−
groups. Therefore, the particles
are globally positively charged at low pH and negatively
charged at high pH. The isoelectric point was observed
around pH ≈ 9. The pH of the suspensions was adjusted
around 3 where the measurement of the surface charge
density gave σ ≈ 0.2C·m
−2
.ThepH should not be de-
creased below 3, because goethite particles would dissolve
in too acidic conditions. For our experiments, samples of
various concentrations were prepared by dilution from the
synthesis batch with solutions of nitric acid at pH = 3. The
ionic strength of the synthesis batch is essentially due to
the NO
−
3
ions, the molarity of which was also measured
and found to be (4.5±0.5) ×10
−2
M in the nematic phase
and (3.0±0.5)×10
−2
M in the isotropic phase. In order to
detect any particle aggregation due to the high concentra-
tion of the synthesis batch, samples were prepared in flat
glass capillaries of 50 µm thickness and observed by opti-
cal microscopy. The suspension looked homogeneous and
no aggregates were observed. This was further confirmed
by transmission electronic microscopy.
All samples were stored in glass vessels, tightly capped
and wrapped in teflon tape. Most samples could be kept
for more than a year, but we have noted slight changes
on the timescale of months. For instance, we noticed that
both volume fractions of the nematic and isotropic phases
at coexistence slowly drifted with time, from initial values
of 8.5% and 5.5% respectively, to 12.5% and 8.5% after a
B.J. Lemaire et al.: Physical properties of aqueous suspensions of goethite (α-FeOOH) nanorods (Part I) 293
year. This suggests that sideways aggregation of the parti-
cles may take place to some extent. Moreover, we actually
performed several syntheses of goethite suspensions that
led to materials with similar properties. However, the de-
tailed examination of these properties showed that there
are subtle differences between the various batches. For in-
stance, the colour of some batches turned progressively
dark red after months, which could be due to the progres-
sive transformation of goethite into haematite, another
thermodynamically more favoured iron oxide. Therefore,
all experiments described in this work were performed
starting from the same synthesis batch, within a year.
2.3 Determination of the particle dimensions
The dimensions of the particles and their polydispersity
are of course very important parameters to understand
the properties of the colloidal suspensions. A single ex-
perimental technique can hardly give all this information
and we therefore had to combine various X-ray scattering
and electron microscopy techniques. X-ray scattering tech-
niques are particularly useful because they perform com-
plete ensemble averages of the particles and do not require
any particular sample treatment. The electron microscopy
techniques allow one to appreciate, in direct space, the
morphology and crystallographic quality of the particles,
their polydispersity, and their possible aggregation.
The powder X-ray diffraction lines, used above to iden-
tify goethite as the only reaction product, are broadened
by the small size of the particles [15]. Thanks to the Scher-
rer formula, the line broadening of an (hkl) reflection is
related to the size of the particles in the [hkl] direction:
L
hkl
=
0.9λ
∆(2θ)cosθ
hkl
,
where λ =0.1542 nm is the X-ray wavelength, ∆(2θ)is
the full width at half-maximum of the (hkl) diffraction
line corrected for experimental resolution, and 2θ
hkl
is the
diffraction angle. This reasoning is based on the assump-
tion that goethite particles are actually single crystals,
which is confirmed, for most particles in a batch, by elec-
tron microscopy. The (200) reflection directly gives the
apparent mean width, L
a
≈ 29 nm. However, the (00l)
lines being too weak, one must consider the (10l) lines, us-
ing the approximate formula: L
c
≈ L
10l
cos
arctan
lc
a
,
which gives L
c
≈ 12 nm. Unfortunately, the particle length
could not be evaluated in the same way because the (0l0)
lines are either too weak or superimposed onto other lines.
Particle dimensions can also be obtained by small-
angle X-ray scattering techniques [15]. In a very dilute
suspension, inter-particle interferences can be neglected;
in other words, the structure factor S(q)isequalto1(q is
the scattering vector modulus, q =
4π sin θ
λ
). Moreover, the
particles are isotropically distributed and the scattered in-
tensity reads
I(q)=N|F (q )|
2
ρ
e
g
− ρ
e
0
2
I
e
,
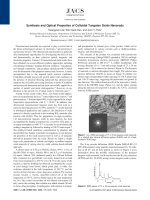
Fig. 2. Transmission electron microscopy (TEM) image of a
diluted goethite suspension.
where N is the number of particles, ρ
e
g
and ρ
e
0
are the
electron densities of goethite and water respectively, I
e
is
the intensity scattered by an electron, represents the
ensemble average over all the possible particle orienta-
tions, and F (q ) is the Fourier transform of the particle
volume (form factor). The form factor of parallelepipedic
particles is well known [16] and, according to the q-range
probed, the various particle dimensions can in principle
be measured. SAXS experiments on the ID2 beamline of
the European Synchrotron Radiation Facility have been
performed on diluted samples. The samples were diluted
enough that their scattering curves superimpose after cor-
rection by a multiplicative factor that only accounts for
the dilution. This demonstrates that inter-particle inter-
ferences are indeed negligible. The SAXS curves could be
fitted by the theoretical form factor in the whole q-range
probed. However, the fit is not very sensitive to the parti-
cle length and thickness, so that it only provides the width,
L
a
≈ 22 ±10 nm, in a reliable way. Moreover, polydisper-
sity effects prevented the observation of a minimum in the
form factor that could have given a precise measure of the
particle thickness.
Another type of SAXS experiment gave us, by chance,
an idea of the particle length. In the course of the study of
nematic samples aligned in a magnetic field (see, Part II,
this issue p. 309), we observed that the SAXS patterns
of a few samples displayed very weak but sharp diffrac-
tion peaks at very small angles. These peaks arise from
a very small proportion of smectic domains in these sam-
ples. Had the suspensions of goethite particles been quite
monodisperse, they would probably have shown a smec-
tic phase, as observed for monodisperse suspensions of
viruses [17, 18]. In these smectic domains, the particles
stack in layers with a period close to their length, L
b
.At
the ionic strength mentioned above (I =4.5 × 10
−2
M),
the Debye length is rather small (≈ 2 nm) and negligible
compared to L
b
, within our experimental accuracy. The
smectic period then gives us L
b
≈ 160 ± 10 nm.
Figure 2 shows an example of transmission electron
microscopy image of a drop of diluted goethite suspen-
sion left to dry on a microscopy grid. When examined
294 The European Physical Journal E
0 100 200 300
0.0
0.1
0.2
0.3
fraction (%)
Length L
b
(nm)
0 1020304050
0.0
0.1
0.2
0.3
b)
a)
Width L
a
(nm)
fraction (%)
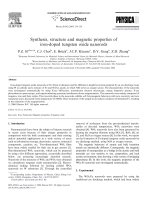
Fig. 3. Size distributions of goethite nanorods obtained from
TEM images. Solid lines are fits to a truncated Gaussian statis-
tics of standard deviation ∆ν =0.4 (Eq. (1)). a) Nanorod
length; b) nanorod width.
carefully, it appears that most of the particles are sin-
gle crystals. They lie on their largest face of (001) indices,
which allowed us to measure their length and width distri-
butions shown in Figure 3 (400 particles were measured).
Both distributions are Gaussian, with averages of 105 and
18 nm, respectively and standard deviations ∆L/L ≈ 0.4.
Another measurement gave averages of 118 and 24 nm,
respectively. The standard deviation defines the size poly-
dispersity of particles which is very large here. This fea-
ture must be considered in order to account quantitatively
for most experimental results, as will be shown in the
next sections. (Note that log-normal distributions are of-
ten found for suspensions of nanoparticles, and it is likely
that it was so, right after the synthesis of goethite. How-
ever, the subsequent centrifugations and dispersions may
have removed some of the smaller particles together with
the supernatants.) Finally, scanning electron microscopy
images yielded an average length of 150 nm and an average
width of 27 nm.
In summary, considering the large experimental errors
and polydispersities affecting the particle dimensions, we
shall use in the following a mean length L
b
= 150±25 nm,
width L
a
=25± 10 nm, and thickness L
c
=10± 5nm.
The particles will be modelled as homothetic rectangular
parallelepipeds scaled by a factor ν that obeys a Gaussian
statistics of standard deviation ∆ν =0.4, truncated at
ν =0:
P (ν)=
e
−(ν−1)
2
/(2∆ν
2
)
∞
0
dνe
−(ν−1)
2
/(2∆ν
2
)
, for ν>0 ,
P (ν)=0, for ν<0 . (1)
This means that we assume the same distributions for
the particle length, width, and thickness.
With the truncated Gaussian statistics, the average
particle surface can be calculated:
s
m
= s
0
∞
0
dνP(ν)ν
2
,
where s
0
=2(L
a
L
b
+ L
a
L
c
+ L
b
L
c
)=1.1 × 10
−14
m
2
is
the surface of a particle of average dimensions (ν = 1).
We find s
m
=1.17s
0
=1.3 ×10
−14
m
2
.
The average particle volume V
m
is obtained in a similar
way:
V
m
= V
∞
0
dνP(ν)ν
3
,
where V = L
a
L
b
L
c
=3.7 × 10
−23
m
3
is the volume of
a particle of average dimensions (ν = 1). We find V
m
=
1.5V =5.6 × 10
−23
m
3
.
2.4 Magnetic properties of goethite nanorods
Since the aim of this work was to investigate the very pecu-
liar magnetic properties of goethite nanorod suspensions,
it was first necessary to examine the magnetic structure of
bulk goethite, a typical antiferromagnetic material. This
structure was determined by performing neutron diffrac-
tion experiments on natural single crystals [19]. The two
main sub-lattices are oriented along the b-axis (i.e. the
nanorod length) which is the antiferromagnetic axis. The
structure of goethite is based on double chains of octa-
hedra occupied by iron atoms. Their spins are parallel
within a chain but there is an antiferromagnetic coupling
between neighbouring chains. The magnetic properties of
goethite particles depend on their size. For instance, the
N´eel temperature T
N
[20, 21], above which the material
becomes paramagnetic, varies between 325 and 400 K.
For the particles considered in this work, T
N
≈ 350 K,
but the size polydispersity should also result in a dis-
persion of the N´eel temperature. The anisotropy energy
is very large so that the so-called “spin-flop” transition
only occurs at a field intensity of 20 T at 4.2 K [19]. At
room temperature, this threshold field should be some-
what smaller but still not smaller than several teslas.
Indeed, we checked that the magnetisation depends lin-
early on the field in the whole range explored (0–1.5 T).
In natural goethite, the parallel and perpendicular sus-
ceptibilities, χ
and χ
⊥
, show the classical behaviour ex-
pected for an antiferromagnetic material. The magnetic-
susceptibility anisotropy, ∆χ = χ
− χ
⊥
, is negative; it
decreases with temperature until it vanishes at T
N
.
Previous studies of natural and synthetic particles also
report that small goethite nanorods bear a weak ferromag-
netic moment oriented along the b-axis [19, 22]. A likely
explanation of this behaviour is that the moment arises
from non-compensated surface spins [23]. In the follow-
ing, this experimental observation will prove very impor-
tant for the interpretation of the magnetic behaviour of
goethite suspensions.
B.J. Lemaire et al.: Physical properties of aqueous suspensions of goethite (α-FeOOH) nanorods (Part I) 295
Table 1.
Crystalline goethite
Density ρ
g
4370 kg · m
−3
Molar mass M
g
88.85 g · mol
−1
Optical indices (at 632.8 nm)
n
a
2.24
n
b
= n
c
2.38
Goethite nanorods
Dimensions
Length L
b
150 ± 25 nm
Width L
a
25 ± 10 nm
Thickness L
c
10 ± 5nm
Polydispersity distribution P (ν) Gaussian
Standard deviation ∆L
i
/L
i
0.4
Average volume V
m
5.6 × 10
−23
m
3
Average surface s
m
1.3 × 10
−14
m
2
Magnetic susceptibility
χ (295 K) (1.7 ± 0.2) × 10
−3
Goethite suspensions
pH3
Ionic strength
Isotropic phase (3.0 ± 0.5) × 10
−2
M
Nematic phase (4.5 ± 0.5) × 10
−2
M
Electrical surface charge σ 0.2 C · m
−2
We performed additional measurements of the mag-
netic susceptibility of goethite powder at room temper-
ature with a SQUID magnetometer. The sample was
prepared by drying a drop of the synthesis batch at
180
◦
C. We found that the magnetisation depends lin-
early on the field, giving a (dimensionless) susceptibility
χ =(1.7 ± 0.2) × 10
−3
and no remanent magnetisation
was detected. This latter point is due to the fact that
the particles in the suspension adopt random magnetisa-
tion directions in zero-field, as ferrofluids do. Upon dry-
ing, the macroscopic magnetisation of the sample would
remain null, in agreement with the random orientation
of nanorods, in dried samples, observed by electron mi-
croscopy.
2.5 Optical properties of goethite nanorods
A large part of our studies is devoted to the magneto-
optical properties of goethite suspensions. First, we briefly
summarise here the optical properties of goethite crystals
reported in the literature. Since, to our knowledge, there
is no measurement of the refractive indices performed at
the wavelength (632.8 nm) of our He-Ne laser (see next
section), we interpolated between the values reported at
589 nm and 671 nm [24,25], assuming a monotonous varia-
tion. In this wavelength region, the nanorods have a uniax-
ial negative birefringence with n
a
=2.24 along their width
and n
b
= n
c
=2.38 along their length and thickness. The
intrinsic birefringence is then ∆n
int
=0.14. Note that the
optical anisotropy is uniaxial with symmetry axis oriented
along the width rather than the length of the particles.
Finally, Table 1 summarises the chemical and physical
properties of the suspensions of goethite nanorods men-
tioned in this section.
3 Experimental section
3.1 Sample preparation
Most samples were kept in optical flat glass capillaries
(VitroCom, NJ, USA) of inner thickness 20, 30, 50 or
100 µm. The thickness of each glass wall is equal to that of
the sample. The width of the capillaries is about ten times
their thickness. They are filled by capillarity except for the
most concentrated samples that had to be sucked in with
a small vacuum pump. Then, the capillaries are flame-
sealed at each end. Such samples can usually be kept for
years. They are particularly well suited for observations by
optical microscopy. We found that the 50 µm thick cap-
illaries were also suitable for SAXS experiments in spite
of the glass absorption. Lindemann glass cylindrical cap-
illaries were not adapted to X-ray diffraction because of
their minimum diameter of at least 200 µm, which results
in a much too strong absorption due to the large iron con-
centration of the suspensions. However, Lindemann glass
capillaries of 1.5 mm diameter were used for SQUID mag-
netisation measurements at different temperatures.
The volume fractions of the suspensions were deter-
mined by measuring the weight loss of samples heated at
180
◦
C for two hours. (At higher temperatures, goethite
dehydrates into haematite.) Dilutions were performed by
adding weighted amounts of solutions of nitric acid at pH
= 3. Concentrated samples were obtained by drying in an
oven until they reached the desired weight.
For a given synthesis batch, if polydispersity is negli-
gible and if there is no temporal evolution, a very prac-
tical way to be sure of the sample concentrations is to
start from biphasic suspensions because their nematic and
isotropic phases always have the same volume fractions,
respectively φ
N
and φ
I
, at thermodynamic equilibrium.
φ
N
is the smallest volume fraction that can be observed
in the nematic phase, whereas φ
I
is the largest volume
fraction an isotropic phase can reach. In the case of very
polydisperse samples, such as the present ones, this rea-
soning fails because fractionation effects occur. However,
all experiments described here were performed, using alto-
gether only a very small amount of the suspension. Under
these conditions, the volume fractions φ
N
=8.5 ± 0.5%
and φ
I
=5.5 ± 0.5% seem to be reproducible within ex-
perimental accuracy.
3.2 SAXS experiments
3.2.1 Experimental description
The SAXS measurements were performed on the High-
Brilliance beamline (ID2) of the European Synchrotron
Radiation Facility located in Grenoble, France. The scat-
tering setup consists in a pinhole geometry, with a very low
296 The European Physical Journal E
divergence and a typical camera length of 10 m. Beam size
at the sample position was about 0.1×0.1mm
2
. The highly
monochromatic incident wavelength was λ =0.0995 nm.
The scattered photons were recorded on a 2-dimensional
detector composed of a FreLoN CCD camera optically
coupled to a Thomson X-ray image intensifier having an
active diameter of 20 cm. This combination provided a
useful range of scattering vector modulus, 0.02 q
0.6nm
−1
. The standard procedure for data acquisition,
treatment and correction is described elsewhere [26].
A strong, highly homogeneous, and stable magnetic
field could be applied at the sample position. The field
was generated by a set of two stacks of five NdFeB per-
manent magnets of size 5 × 8 × 1cm
3
each. This allowed
us to easily vary the field strength from 0.001 T up to
1.7 T by adjusting the distance between the two stacks.
The magnetic-field intensity is a function of the gap be-
tween the two stacks of magnets and was measured using
a1mm
2
calibrated Hall effect probe. The field homogene-
ity in the sample region has been explored and the field
lines distortions exhibit a standard deviation less than 1%
overa1cm
3
volume at 1 T. The magnetic field could be
applied in a direction either perpendicular or parallel to
the X-ray beam. The combination of the two magnetic-
field orientations has allowed us to completely explore the
reciprocal space of the goethite suspensions.
3.2.2 Interpretation of the SAXS patterns
The X-ray intensity scattered at small angles by ly-
otropic nematic suspensions of rod-like particles very often
arises from interferences among particles perpendicularly
to their main axis. A diffuse peak is then observed that
corresponds to the liquid-like positional order of the par-
ticles in the plane perpendicular to the director (n). The
position of this peak usually scales as φ
1/2
and gives the
average distance between particles. More generally, the
distribution of scattered intensity in the reciprocal plane
perpendicular to n is directly related to the Fourier trans-
form of the pair distribution function of the rods. The
isotropic phase of goethite suspensions shows the same
qualitative features (apart from the anisotropy) in the
vicinity of the nematic phase, but the positional order has
a smaller range. In this SAXS study, we are mostly inter-
ested in the orientation of the particles with respect to the
field, which is directly inferred from the orientation of the
scattering, and in S
2
, the nematic order parameter. S
2
is
the second moment of f(θ), the orientational distribution
function (ODF) of the particles (θ is the angle between a
rod and the nematic director). The n-th moment of f(θ)is
S
n
=
dΩf(θ) P
n
(cos θ) , (2)
where Ω =(θ, ψ) is the solid angle and P
n
the n-th or-
der Legendre polynomial (P
0
=1,P
1
(X)=X, P
2
(X)=
3X
2
−1
2
, etc.). We will mainly use S
1
and S
2
.
Assuming locally-well-aligned rod-like particles scat-
tering in an equatorial torus and neglecting finite-size ef-
fects, Leadbetter et al. obtained S
2
from an azimuthal
scan I(ψ) of the scattered intensity via the inversion of
the following relation, in a now classical way [27, 28]:
I (ψ)=C (q)
π/2
ψ
dθ sin θ
f (θ)
cos
2
ψ
tan
2
θ − tan
2
ψ
, (3)
where C(q) describes the contributions of the positions
and the form factor of the particles. In the case of a dipo-
lar symmetry, f(θ) must be replaced by [f(θ)+f(π−θ)]/2.
In order to invert the previous relation, one can assume the
Maier-Saupe form [29, 30] for the ODF:f (θ)=
1
Z
e
m cos
2
θ
,
where Z is the orientational partition function and m is a
fit parameter directly related to S
2
. m can take positive
values, in the case of an usual nematic phase, or negative
values in the case of an “antinematic” phase of negative
S
2
(i.e. a phase in which the rods tend to align perpendic-
ular to a given direction [30]). m = 0 corresponds to the
isotropic phase. We obtain
I (ψ)=C (q)
i erf (
√
m cos ψ)
4π erf (i
√
m)cosψ
e
m cos
2
ψ
(m>0) ,
(4)
I (ψ)=C (q)
erf
i
|m|cos ψ
4πierf
|m|
cos ψ
e
m cos
2
ψ
(m<0) ,
(4
)
where erf is the error function. Fitting the azimuthal scan
of the scattered intensity by these expressions yields m
and then S
2
by using the following relations:
S
2
=
3
4m
2i
√
m
√
πerf (i
√
m)
e
m
− 1
−
1
2
(m>0) ,
(5)
S
2
=
3
4m
2
|m|
√
πerf
|m|
e
m
− 1
−
1
2
(m<0) .
(5
)
Another approach [31], suggested by Deutsch, still re-
lies on Leadbetter’s relation but does not involve any as-
sumption of the ODF; it directly relates S
2
to the az-
imuthal scan through the following relation:
S
2
=1−
3
π/2
0
dψI (ψ)
sin
2
ψ +sinψ cos
2
ψ ln
1+sin ψ
cos ψ
2
π/2
0
dψI (ψ)
.
(6)
A comparison between these two methods shows that
they actually give the same values of S
2
(± 0.01 differ-
ence), well within the error bars of ± 0.05, as long as the
signal-to-noise ratio is good enough.
3.3 Magnetic-field–induced birefringence experiments
The most sensitive method to measure linear birefrin-
gence, ∆n, of the samples as a function of the volume
B.J. Lemaire et al.: Physical properties of aqueous suspensions of goethite (α-FeOOH) nanorods (Part I) 297
a)
b) c) d)
e) f) g) h)
B
B
-200 -180 -160 -140 -120 -100 -80 -60 -40 -20 0 20
215
220
225
230
235
240
245
250
255
i
)
Scattered intensity (a.u.)
Azimuthal angle
60 80 100 120 140 160 180 200 220 240 260 280 300
0
50
100
150
200
250
j
)
Scattered Intensity (a.u.)
Azimuthal angle
Fig. 4. Small-angle X-ray scattering (SAXS) patterns of an isotropic suspension (φ =5.5%), recorded with the magnetic
field perpendicular to the X-ray beam (a-d) and parallel to the beam (e-h) at different field intensities: a), e): B =0T;
b), f): B =0.25 T; c), g): B =0.4T;d),h):B =1.4 T. i), j): Azimuthal scans (solid square symbols) of the scattered intensity
in b), d), respectively, and their fits by equations (3, 4) (see text) shown as examples.
fraction and of magnetic-field intensity and frequency, uses
a setup with a photoelastic modulator, as already de-
scribed [32, 33]. This setup consists of the following ele-
ments: a He-Ne laser source (λ = 633 nm), a vertical po-
lariser, a photoelastic birefringent modulator whose main
optical axis lies at 45
◦
from the vertical direction and oscil-
lating at a frequency f = 50 kHz, the sample of thickness
d immersed in a horizontal magnetic field applied perpen-
dicular to the light beam, an analyser rotated by 45
◦
,and
a photomultiplier. A lock-in amplifier measures the com-
ponent of the photomultiplier signal I
f
at the modulation
frequency, which is related to the birefringence by the fol-
lowing equation:
I
f
= I
0
sin
2π∆nd
λ
,
where I
0
is kept constant and determined through cali-
bration of the experiment. We have checked that the in-
fluence of the linear dichroism can be neglected in the re-
lation between the signal I
f
and the birefringence, for field
intensities up to 800 mT at the highest volume fraction
(φ =5.5%). (The linear dichroism was measured sepa-
rately with a very similar setup.)
The magnetic field was produced by three different
magnets. We first used small coils in Helmholz configu-
ration, which produced a constant field of about 6 mT
and a 20 µs characteristic switching time, to evaluate the
relaxation time of the angular distribution of the particles.
We also used an electromagnet for producing an a.c. field
with a sawtooth-like time variation, at a frequency low
enough (0.02 Hz) to consider that the orientational dis-
tribution function was always at equilibrium. Then, the
birefringence evolved in phase with the field. The birefrin-
gence was plotted as a function of the magnetic-field inten-
sity. To measure the birefringence at a higher frequency,
we used a nitrogen-cooled coil that produced fields up to
27 mT at 1 kHz. At high enough frequency, we observed
that the birefringence saturates. We then measured its
value as a function of the rms field intensity.
298 The European Physical Journal E
4Results
The isotropic phase of goethite suspensions is easier to
study than the nematic phase for three main reasons:
i) the orientation and relaxation times are far shorter in
the isotropic phase, ii) the nematic texture needs to be
well defined by removing topological defects iii) the ne-
matic anchoring at the surfaces of the sample must be
controlled, at least to some extent. In other words, the
isotropic phase is usually homogeneous and is much less
sensitive to surface effects than the nematic phase.
4.1 Study by SAXS of the orientation reversal upon
magnetic-field increase
The SAXS patterns of a sample of an isotropic suspen-
sion, at different field intensities and for both parallel and
perpendicular configurations, are shown in Figure 4. We
consider here an isotropic suspension at phase coexistence
(φ =5.5%) because it is the most concentrated one and
therefore it shows the largest effects. All X-ray scattering
patterns recorded with the magnetic field parallel to the
X-ray beam are actually isotropic, demonstrating that the
phase keeps uniaxial symmetry around the magnetic-field
direction at all field intensities. Let us now examine the
SAXS patterns recorded in the perpendicular configura-
tion. As expected, in the absence of field, the scattering
pattern is also isotropic. In contrast, at low field inten-
sity (250 mT), the scattering pattern becomes anisotropic.
The diffuse ring due to the liquid-like positional order of
the nanorods concentrates in the vertical direction, i.e.
perpendicular to the field direction. This shows that the
nanorods then tend to point along the field direction. Un-
expectedly, upon a further field increase (around 400 mT),
the SAXS pattern becomes isotropic again. Moreover, at
still higher field intensities (1400 mT), the diffuse ring is
very much aligned along the horizontal direction, which
proves that the nanorods strongly tend to orient perpen-
dicular to the field. At this stage, the SAXS pattern looks
quite like that of a nematic phase and the optical texture
of the sample is still completely homogeneous. To the best
of our knowledge, this is the first example of what is some-
times called an “antinematic” phase, but it is induced here
by the field. Moreover, we do not observe the nucleation
of any other phase.
The values of the nematic order parameter, S
2
, were
extracted from the SAXS patterns, as a function of field
intensity (Fig. 5). S
2
increases from zero in zero-field to
reach a maximum of about 0.05 at B ≈ 250 mT. S
2
then
decreases back to zero at B ≈ 400 mT, takes negative val-
ues beyond, and reaches about −0.35 at 1.4 T. More di-
luted (down to φ ≈ 1%) isotropic suspensions display the
same qualitative behaviour but with smaller absolute val-
ues of S
2
. All these suspensions displayed isotropic SAXS
patterns for the same value (around 400 mT) of the mag-
netic field.
0.0 0.2 0.4 0.6 0.8 1.0 1.2 1.4
-0.4
-0.3
-0.2
-0.1
0.0
S
2
lock-in setup
compensator
SAXS
B (T)
Fig. 5. Evolution of the nematic order parameter S
2
of an
isotropic suspension (φ =5.5%) versus field intensity, mea-
sured with three different techniques: with SAXS, with a mi-
croscope using a compensator, with the field-modulation tech-
nique described in the text.
4.2 Measurement of the field-induced birefringence
4.2.1 Determination of the specific birefringence
For a dilute suspension (φ<1%) of particles, much
smaller than the wavelength of light, the birefringence is
given by
∆n = ∆n
sat
φS
2
, (7)
where ∆n
sat
is the specific birefringence [34]. The specific
birefringence can be estimated from the expression
∆n
sat
=
n
s
2
n
2
b
− n
2
s
n
2
s
+ N
b
(n
2
b
− n
2
s
)
−
1
2
n
2
a
− n
2
s
n
2
s
+ N
a
(n
2
a
− n
2
s
)
+
n
2
c
− n
2
s
n
2
s
+ N
c
(n
2
c
− n
2
s
)
, (8)
where n
s
is the refraction index of the solvent and N
a
,
N
b
,andN
c
are the depolarising factors [35] that can be
calculated by considering the particles either as ellipsoids
or parallelepipeds. The values obtained in both cases are
very similar: N
a
=0.28, N
b
=0.02 and N
c
=0.70 for
ellipsoids of dimensions 150, 25 and 10 nm; N
a
=0.29,
N
b
=0.05 and N
c
=0.66 for parallelepipeds of the same
dimensions. Therefore, comparable values are obtained for
the specific birefringence: ∆n
sat
=0.71 for ellipsoids and
∆n
sat
=0.64 for parallelepipeds.
The specific birefringence was also estimated by mea-
suring the optical path difference introduced by a nematic
sample (φ = 8.5%) held in an optical flat glass capillary
of thickness e =20µm, submitted to a magnetic field of
intensity B = 110 mT. The measurement was performed
in white light (of average wavelength 550 nm), and gives
e∆n = 1286 ±4 nm. The nematic order parameter of this
sample was independently determined by X-ray scatter-
ing: S
2
=0.95± 0.05, which yields: ∆n
sat
=0.80 ±0.04 in
reasonable agreement with the values predicted above.
B.J. Lemaire et al.: Physical properties of aqueous suspensions of goethite (α-FeOOH) nanorods (Part I) 299
4.2.2 Birefringence measurement with an optical
compensator
The main interest of this method is that the homogeneity
of the samples can be directly checked while performing
the measurement of the birefringence, using a Derek com-
pensator, under the microscope. As expected, the evolu-
tion of the nematic order parameter follows that already
observed by SAXS (Fig. 5). The birefringence measured
at B = 900 mT (∆n = −0.016±0.002) is actually huge for
an isotropic phase. This is due not only to the large spe-
cific birefringence and volume fraction of the suspension,
but also to its large nematic order parameter S
2
= −0.35
(S
2
saturates at −0.5, in this orientation).
Let us briefly discuss the order of magnitude of the
birefringence. At low field, the field-induced birefringence
is proportional to B
2
, as usual. We find that the coeffi-
cient ∆n/B
2
=0.03 T
−2
in the case of goethite suspen-
sions, compared to 1.5 × 10
−7
T
−2
for suspensions of the
Tobacco mosaic virus [36], 1.1 ×10
−7
T
−2
for suspensions
of the fd virus [37] and 6.5 ×10
−3
T
−2
for suspensions of
V
2
O
5
ribbons (unpublished data). The field-induced bire-
fringence is therefore some 5 orders of magnitude larger for
goethite suspensions than for usual suspensions of organic
rod-like particles.
4.2.3 Orientation kinetics of the isotropic suspensions
Before using the magnetic-field modulation technique in
order to measure the sample birefringence, it is first nec-
essary to check that the orientation kinetics of the suspen-
sions are fast enough to follow the field sweeping rate. Per-
manent magnets were used to apply a constant field giving
rise to a large birefringence. A small superimposed tran-
sient field, created by Helmholtz coils, allowed us to esti-
mate birefringence decay times larger than 1 ms. Exper-
iments were performed on samples in the isotropic phase
at coexistence (φ = 5.5%) which are the most viscous. Ex-
ponential decays of the birefringence were recorded upon
a small drop of the magnetic-field intensity from 43 to
37 mT (data not shown). The time constant of the sus-
pension was measured to be τ =10.2±0.3 ms. This means
that, in order to perform field sweeps with about 500 data
points per cycle, the field frequency has to be much less
than 0.2 Hz for the system to remain in quasi-static con-
ditions.
4.2.4 Birefringence measurements with the magnetic-field
modulation setup
Compared to the previous technique using an optical com-
pensator, this setup gives much more accurate measure-
ments of the optical path difference (e∆n, where e is the
sample thickness), allowing us to measure a birefringence
variation as small as ∆n =10
−8
for a 100 µm thick capil-
lary. The birefringence of the suspensions was measured as
a function of the magnetic-field intensity at various con-
centrations in the isotropic phase (0.001 <φ<0.055).
-0.4 -0.2 0.0 0.2 0.4
-0.5
0.0
0.5
1.0
φ
=0.61%
φ
=2.0%
φ
=5.5%
∆
n / max(
∆
n)
B (T)
Fig. 6. Birefringence curves (at various volume fractions) mea-
sured with the optical-modulation technique versus field inten-
sity, rescaled in order to show their superposition over a decade
of volume fraction.
0.0 0.2 0.4 0.6 0.8 1.0
-200
0
200
400
0.02 Hz
4 Hz
40 Hz
400 Hz
∆
n (arbitrary unit)
t/T (fraction of period)
Fig. 7. Birefringence curves (φ =5.5%) measured with the
field modulation technique, versus time, at different frequencies
(T is the period of the magnetic field), at constant B
eff
=
35 mT.
Whatever the concentration was, all the curves looked sim-
ilar (Fig. 6). Moreover, considering the approximations in-
volved in the derivation of equations (5–7), all three tech-
niques, i.e. magnetic-field modulation setup, optical com-
pensator and X-ray scattering show the same behaviour
of the nematic order parameter (Fig. 5). (In Fig. 5, the
small discrepancies between curves obtained by different
techniques might be due to the very different durations of
the experiments: 1 h with the optical compensator, 15 s
with the lock-in amplifier, 10 min for X-ray scattering,
and to the different sizes of the samples: 20 or 50 µm.
Also, the measures were made at λ = 633 nm with the
modulation setup and in white light with the optical com-
pensator.) The curves can be rescaled by a factor that
depends on the concentration and that strongly increases
at the isotropic/nematic phase transition. At small fields,
the birefringence scales as B
2
, as expected for this class
of lyotropic nematic phases [36, 38].
We have also performed birefringence measurements
at various frequencies (0.02 Hz <f < 1000 Hz) at a
small magnetic-field intensity, B = 35 mT. Since the
300 The European Physical Journal E
0.0 0.2 0.4 0.6
0.0
0.1
0.2
B (T)
M (A.m
2
.kg
-1
)
Fig. 8. Magnetisation (per kg of dried mass) versus field in-
tensity of a nematic suspension (φ =8.5%) frozen either in a
1 T field (solid squares) or in a 0.1 T field (solid circles) as
measured with the SQUID magnetometer. Straight lines are
linear fits to the data.
birefringence rise and decay happen on a time scale of
about 10 ms, we expect that the particles will not have
time to follow the field at high frequencies, which should
induce a regime of constant birefringence. Indeed, the
modulation amplitude of the birefringence decreases as
the frequency increases and becomes even negligible be-
yond 400 Hz (Fig. 7). At the same time, the curves un-
dergo a phase shift upon increasing frequency. (The cusp-
like shape of the birefringence curve at 0.02 Hz is due
to the quadratic dependence of the birefringence on B,
in quasi-static conditions, whereas the rounded shapes of
the other curves are due to the nanorod reorientation time
lag.) These attenuation and phase shift are typical of an
intrinsic dynamical phenomenon that cannot follow the
field variation. Moreover, the continuous component of
the birefringence decreases with the frequency; it becomes
negative beyond 20 Hz and does not change any more be-
yond 400 Hz. Therefore, the particles that were aligned
parallel to the field at low frequency (∆n > 0) reorient
perpendicularly to the field at high frequency (∆n < 0).
The birefringence was also measured as a function of the
field for various concentrations at 400 Hz. It is now nega-
tive but it still scales as B
2
at low fields and diverges at
the I/N transition.
4.3 Static magnetic measurements
4.3.1 Magnetic anisotropy
The origin of the puzzling behaviour described above
clearly lies in the individual magnetic properties of the
goethite nanorods, because this behaviour is observed in
the isotropic phase even at high dilutions. The magnetic
properties of the nanorods were thus investigated with a
SQUID magnetometer in the nematic phase. In order to
measure anisotropic properties and to prevent the parti-
cles from realigning in the field, the solvent (i.e. water)
was frozen below 273 K in various field intensities. Fig-
ure 8 shows the phase magnetisation versus field inten-
sity of a sample (m =7.9 mg) of a nematic suspension
(φ =8.5%) frozen in a 1 T field. At such a field intensity,
all the nanorods are oriented perpendicularly to the field.
The curve obtained is a straight line that extrapolates to
the origin and its slope represents the perpendicular sus-
ceptibility of the phase. The curve recorded on the same
suspension frozen in a 0.1 T field is also a straight line
but its slope is smaller and it clearly does not extrapolate
to the origin. Its slope roughly represents the parallel sus-
ceptibility of the phase. These linear behaviours show that
the anisotropy energy is very large; the spin-flop transi-
tion is known to occur at very high fields and was never
reached in our samples. Taking into account the values
of the nematic order parameters in both orientations and
the dependence (assumed linear) on temperature, we es-
timated the value of the anisotropy of magnetic suscepti-
bility: ∆χ ≈−3 ×10
−4
. It is very important to note that
this quantity is negative.
4.3.2 Remanent magnetic moment
The remanent magnetisation that is measured in the par-
allel orientation is in fact smaller than the sum of the re-
manent moments of all the nanorods. Indeed, even though
the moments are roughly all parallel (S
2
≈ 0.95), they can-
not all point in the same direction for entropic reasons. In
the classical Langevin description, it can be shown that
the remanent magnetisation M of the suspension is pro-
portional to
µ
2
B/k
B
T , where is the average on the
size distribution P (ν). We measured M ≈ 4 × 10
−8
Am
2
,
which leads to (µ
2
)
1/2
≈ 1.43 × 10
−20
Am
2
≈ 1500 µ
B
,
where µ
B
is the Bohr magneton. In this respect, the size
polydispersity should also be considered. We have seen in
Section 2.3 that the nanorod size polydispersity can be
modelled by a Gaussian distribution of standard devia-
tion ∆ν =0.4. Moreover, following N´eel [23], we assume
that the nanorod remanent moment, µ
ν
, is due to non-
compensated surface spins and that it therefore scales as
µ
ν
= µν
2
. Then, we find
µ
2
=
∞
0
dνP(ν) ν
4
µ
2
=2.05 µ
2
,
µ
m
= µ =
∞
0
dνP(ν) ν
2
µ =1.17µ,
where µ is the moment of a nanorod of average dimensions.
The average moment is then µ
m
≈ 1300 µ
B
and the mo-
ment of a nanorod of average dimensions is µ ≈ 1100 µ
B
.
Actually, these values are quite comparable to that of the
magnetisation induced by a magnetic field of magnitude
B =0.1T,i.e. χV
m
B/µ
0
≈ 800 µ
B
.
4.3.3 First moment of the ODF
A major consequence of the existence of a nanorod re-
manent moment is that both the nematic and isotropic
B.J. Lemaire et al.: Physical properties of aqueous suspensions of goethite (α-FeOOH) nanorods (Part I) 301
01234
0.00
0.01
0.02
M (A.m
2
/kg)
B (T)
Fig. 9. Remanent magnetisation (per kg of dried mass) of
an isotropic suspension (φ =5.5%) versus the field intensity
applied during suspension freezing. The solid line is a fit by
the model described in Section 5 (Eqs. (9) and (19)).
phases, submitted to a magnetic field, will lose the mirror
symmetry perpendicular to the field. (Note that we use
here a classical image where a magnetic moment is rep-
resented by a vector.) This may be quantified by trying
to measure the first moment of the ODF, S
1
. To illus-
trate this point, we have measured the magnetisation in
zero-field of a sample of isotropic suspension (φ =5.5%)
frozen in a field B
c
. Then, the measured magnetisation M
is only due to the dipolar moments of the particles and we
can plot it as a function of the field B
c
under which the
suspension was frozen (Fig. 9). Let us call ρ the number
density of particles in the suspension, then M is the av-
erage of the projections of the remanent moments of the
particles on the nematic director: M = ρµ cos θ.Ifwe
neglect here the nanorod polydispersity, then
M = ρµ
dΩf(θ)cosθ = ρµS
1
. (9)
As expected, S
1
takes strictly positive values because
the dipolar moments tend to point in the same direction as
the field. S
1
varies linearly with the field at low field inten-
sities (B<100 mT), reaches a maximum around 250 mT,
and then slowly decreases. This experimental curve and
the previous experimental results will be interpreted in
the next section.
5Model
In this section, we present a model to describe the prop-
erties of the isotropic phase of goethite suspensions in a
magnetic field. The zero-field magnetisation and the bire-
fringence being respectively proportional to the first and
second moments of the orientational distribution func-
tion (Eqs. (7) and (9)), the model consists in giving ex-
pressions of the magnetic energy and of the free energy
of a suspension, in deriving the ODF, and finally the
moments of this ODF. This approach was already used
to study the magnetisation and the birefringence of fer-
rofluid suspensions [34a] and the birefringence of liquid
M
θ
Induced
magnetisation
longitudinal
moment
H
χ
⊥
H
⊥
χ
H
µ
Fig. 10. Schematic representation of the remanent and in-
duced magnetic moments of a goethite nanorod.
crystals [39]. We combine here the models for ferrofluids
and liquid crystals, since both terms of the magnetic en-
ergy of goethite particles, the dipolar-moment term and
the induced-magnetisation one, have comparable magni-
tudes.
5.1 Magnetic energy of a goethite nanorod
Let us first assume that all particles have the same size
and volume V . They carry an identical longitudinal mag-
netic moment µ (Fig. 10). Their magnetic susceptibil-
ity is anisotropic and uniaxial ( refers to the long axis
of the particle). The magnetic-susceptibility anisotropy
∆χ = χ
− χ
⊥
is negative. Let us consider a particle,
immersed in a field B, oriented at an angle θ with respect
to B. Neglecting the demagnetising effect (which will be
justified below), the magnetic energy of the particle con-
sists of two terms, the interaction between the particle
dipole and the field (Zeeman energy), and the energy due
to the induced magnetisation:
E
m
(θ)=−µB cos θ −
∆χV
2µ
0
B
2
cos
2
θ, (10)
which can be rewritten
E
m
(θ)=−µBP
1
(cos θ) −
∆χV
3µ
0
B
2
P
2
(cos θ) (10
)
by adding a term independent of the orientation of the par-
ticle. One easily checks that the demagnetising effect can
be neglected: Considering that the field inside the particle
is
H
i
=
H
e
−
¯
¯
N
M, where
H
e
is the external field,
¯
¯
N the
tensor of the demagnetising field coefficients and
M the
induced magnetisation, the full expression of the magnetic
energy becomes
E
m
(θ)=−µB cos θ
1+χ
1+N
χ
−
VB
2
2µ
0
cos
2
θ
χ
(1 + N
χ
)
2
−
χ
⊥
(1 + N
⊥
χ
⊥
)
2
. (11)
The demagnetising coefficients N
and N
⊥
, that take
values comprised between 0 and 1, are multiplied by the
susceptibilities which are of the order of 10
−3
, then their
influence may be safely neglected.
302 The European Physical Journal E
5.2 Qualitative interpretation of the results
Using the above expression of the magnetic energy of a
particle (Eq. (10)), one can qualitatively understand the
behaviour of the isotropic suspensions in a static magnetic
field (Sect. 5.2.1) as well as at high frequency (Sect. 5.2.2).
5.2.1 Static field
In a static field, the energy is a function of the angle θ.
Taking µ ≈ 1000 µ
B
, V ≈ 3.7×10
−23
m
3
, ∆χ ≈−3×10
−4
,
the coefficients µ and ∆χV/2µ
0
of the cos θ and cos
2
θ
terms of equation (10) are of the same order of magni-
tude. The importance of these terms depends directly on
the relative values of B and B
2
. In a low field, the dipolar
(Zeeman) energy term dominates. This term has a mini-
mum at θ = 0. On the contrary, the term of induced mag-
netisation dominates the other term at very high fields.
Then, the energy reaches its minimum at θ = π/2. In
between, the minimum will be reached at a finite angle.
Thus, as long as the orientational entropy is not too high,
which is fulfilled in the nematic phase, the particles tend
to orient along a low field but reorient in a perpendicu-
lar direction at high field. The crossover between the two
regimes occurs when B ≈
µµ
0
|∆χ|V
, i.e. B of the order of a
few 100 mT, which agrees with our experimental results
(Sects. 4.2.4 and 4.3).
5.2.2 High-frequency fields
In a field of frequency much larger than the inverse
orientation relaxation time, i.e. above a few 100 Hz
(Sect. 4.2.4), the particles cannot follow its evolution and
only respond to the field average value. The average of
B is zero, that of B
2
is B
2
eff
, where B
eff
is the rms value
of the magnetic field. The magnetic energy then becomes
(Eq. (10))
¯
E
m
(θ)=
|∆χ|V
2µ
0
B
2
eff
cos
2
θ. (12)
For all values of B
eff
, this energy is minimum for θ =
π/2 and the particles tend to orient perpendicularly to a
high-frequency field.
The above expression of the magnetic energy of a par-
ticle (Eq. (10)) therefore allows us to qualitatively under-
stand the different orientations of an isotropic suspension
in a magnetic field. Let us now try to make more quanti-
tative predictions.
5.3 Suspension free energy and orientational
distribution in a static field
The aim of this section is to derive the orientational distri-
bution function of the suspension in a static field, in order
to calculate the first and second moments S
1
and S
2
in the
following section. We consider here the suspension as a liq-
uid of spherocylinders of length L and diameter D. The in-
teractions between the magnetic moments of neighbouring
particles can be neglected, since the distances are larger
than 50 nm, average distance in the most concentrated
samples. The van der Waals forces are large however [40],
but not enough to make the suspension flocculate. We
do not consider them in this simple model because their
angular dependence is too difficult to describe. The elec-
trostatic interactions between the particles are well taken
into account by introducing an effective diameter D
eff
in
the hard-core repulsion term of the Onsager model. (Note,
by the way, that the Onsager model is considered to give
accurate results only when L/D > 100.) Following Vroege
et al. [4], the free energy reads
F = F
0
+ Nk
B
T
ln Λ
3
ρ − 1
+Nk
B
T
dΩf (θ)ln(4πf (θ))
+F
exc
(f (θ) ,f(θ
) ,Ω,Ω
)
+N
dΩf (θ) E
m
(θ) , (13)
where N is the number of particles, ρ is the particle num-
ber density, Λ is the De Broglie wavelength, f the ori-
entational distribution function. The free energy is com-
posed of a constant term F
0
, of two entropy terms, the
translational and orientational ones, of the hard-core re-
pulsion F
exc
between the particles, and of the interaction
E
m
between the individual particles and the magnetic field
(Eq. (10)).
Dealing with the hard-core repulsion, we neglect the
interactions between more than two particles as well as
end-to-end interactions between two particles, and we only
retain the interaction, along their length, of two particles
oriented at angles Ω =(θ,ψ)andΩ
from the field. The
energy of hard-core repulsion then reads
F
exc
(f (θ) ,f(θ
) ,Ω,Ω
)=
16Nk
B
Tφ
πφ
∗
×
dΩdΩ
f (θ) f (θ
) |sin γ (Ω,Ω
)|, (14)
where γ is the angle between the two particles, and φ
∗
=
16V
eff
/πL
2
D
eff
the volume fraction of the spinodal, above
which the isotropic state is absolutely unstable. Note that
we have simply added a magnetic term to the free energy
of the Onsager model.
Following Vroege et al. [4] again, F can be considered
as a functional of f , and the normalization condition of f
(
dΩf (θ) = 1) can be taken into account by subtracting
ς
dΩf(θ)toF , where ς is a Lagrange multiplier. The
functional derivation of the free energy is
ς =
δ
F
Nk
B
T
δf
=ln(4πf(θ)) +
1
4π
+2
16φ
πφ
∗
dΩ
f(Ω
)|sin γ(Ω,Ω
)| +
E
m
(θ)
k
B
T
.
B.J. Lemaire et al.: Physical properties of aqueous suspensions of goethite (α-FeOOH) nanorods (Part I) 303
Finally, the orientational distribution function takes a
Boltzmann-type expression:
f (θ)=
1
Z
exp
−
E
exc
(f,Ω)+E
m
(θ)
k
B
T
, (15)
where Z =
dΩe
−
E
exc
(f,Ω)+E
m
(θ)
k
B
T
is the orientational par-
tition function, and
E
exc
(f,Ω)=
32
π
k
B
T
φ
φ
∗
dΩ
f(θ
) |sin γ (Ω, Ω
)| (16)
is the average field of hard-core repulsion felt by a par-
ticle oriented at Ω. Unfortunately, equation (15) is im-
plicit in f and can only be solved numerically. To interpret
our experimental results, we prefer the analytical expres-
sions that we can derive in two limit cases: i) in the dilute
regime; ii) under a low field.
5.4 Analytical expressions for the first and second
moments S
1
and S
2
of the ODF
5.4.1 Dilute suspensions
In the limit of a dilute isotropic suspension, the core re-
pulsion term can be neglected. We shall use for this case
the superscript
◦
:
f
◦
(θ)=
1
Z
◦
exp
−
E
m
(θ)
k
B
T
=
1
Z
◦
exp
KB cos θ + JB
2
P
2
(cos θ)
, (17)
wherewehavenotedK =
µ
k
B
T
> 0, and J =
∆χV
3µ
0
k
B
T
< 0,
and P
2
(X)=
3X
2
−1
2
is the second-order Legendre poly-
nomial.
The orientational partition function Z
◦
is determined
by integrating the angular distribution f
◦
:
Z
◦
=2π
π
6|J|B
2
erf
−3JB
2
+ KB
6|J|B
2
−erf
3JB
2
+ KB
6|J|B
2
e
−
JB
2
2
−
K
2
6J
. (18)
Then, the following formulae are used to derive the
first and second moments of f
◦
:
S
◦
1
=
1
B
∂ ln Z
◦
∂K
and S
◦
2
=
1
B
2
∂ ln Z
◦
∂J
.
Finally, we obtain
S
◦
1
= −
KB
3JB
2
+4π
sinh KB
3JB
2
Z
◦
e
JB
2
, (19)
S
◦
2
= −
1
2
−
1
2JB
2
+
1
6
KB
JB
2
2
+2π
3JB
2
cosh KB − KBsinh KB
3(JB
2
)
2
Z
◦
e
JB
2
. (20)
0.0 0.2 0.4 0.6 0.8 1.0
0.0
0.5
1.0
a) S
˚
1
∆χ
>0,
µ
>0
∆χ
=0,
µ
>0
∆χ
>0,
µ
=0
∆χ
<0,
µ
>0
∆χ
<0,
µ
=0
B(T)
0.0 0.2 0.4 0.6 0.8 1.0
-0.5
0.0
0.5
1.0
b) S
˚
2
B(T)
Fig. 11. Model predictions for the evolutions of the first and
second moments of the ODF, S
◦
1
and S
◦
2
, of an isotropic sus-
pension versus magnetic-field intensity depending on the sign
of the anisotropy of magnetic susceptibility and the existence
of a remanent magnetic moment (Eqs. (19) and (20)).
These equations give the expression of the birefrin-
gence and the zero-field magnetisation of a frozen di-
lute suspension as a function of the intensity of the mag-
netic field, because these quantities are proportional to
the first and second moments of the angular distribution:
M = ρµS
◦
1
(Eq. (9)), ∆n = ∆n
sat
φS
◦
2
(Eq. (7)).
The evolutions of S
◦
1
and S
◦
2
with magnetic-field in-
tensity are shown in Figure 11, depending on the signs
of ∆χ and µ. The only case for which S
◦
2
changes sign
with increasing field and S
◦
1
shows a maximum is ∆χ < 0
and µ = 0 (assuming that µ is indeed oriented along the
particle length; this is the case of goethite), which can be
understood by looking at the development of S
◦
1
and S
◦
2
to lowest order in B (Eqs. (19) and (20)):
S
◦
1
=
KB
3
=
µB
3k
B
T
, (21)
S
◦
2
=
3J + K
2
B
2
15
=
∆χV
µ
0
k
B
T
+
µ
k
B
T
2
15
B
2
. (22)
Equation (22) is similar to that for polarizable liquid
crystals with a dipolar moment, in an electric field [41].
Moreover, the limit cases have already been described in
the literature. The case µ = 0 corresponds to classical
lyotropic liquid crystals (with the correction due to the
excluded volume which we will see in the next section,
Eq. (26)) [36]. For ferrofluids, a very large µ and a negli-
gible ∆χ yield the results of Bacri et al. [34].
5.4.2 Concentrated suspensions in a low field
In a concentrated suspension, the term of core repulsion
cannot be neglected anymore. An approximate solution
for equation (15) can be found at small fields. S
1
and S
2
can be derived by an expansion of the free energy F in
304 The European Physical Journal E
power series of B. In equation (13), f is substituted by
the trial function
f(θ)=
1
4π
1+a
1
P
1
(cos θ)+a
2
P
2
(cos θ)
+a
3
P
3
(cos θ)+a
4
P
4
(cos θ)
,
where the a
i
are fitting parameters. This trial function is
a generalisation of the classical development of f on the
Legendre polynomials of even order [39].
Let us compare the S
i
,thei-th moments of the ODF
(Eq. (2)), the a
i
and B
i
.
We multiply the previous equation by P
i
(cos θ)and
integrate it over Ω. The orthogonality relation of the Leg-
endre polynomials reads
1
4π
dΩP
i
(cos θ)P
j
(cos θ)=
δ
ij
2i +1
,
where δ
ij
is the Kronecker symbol. This yields
S
i
=
a
i
2i +1
.
In the dilute regime and under a low field, it can be
shown that S
◦
i
is proportional to B
i
(Eqs. (21) and (22)
give the two first orders). We assume that this remains
true when the core repulsion is taken into account, so that
a
i
is also proportional to B
i
.
Let us develop the free energy to the 4th order in B in
order to derive S
1
and S
2
to the second order in B.
The development of the orientational entropy term is
easily performed using the orthogonality of the Legendre
polynomials:
dΩf(θ)ln(4πf (θ)) =
a
2
1
6
+
a
4
1
60
−
a
2
1
a
2
15
+
a
2
2
10
.
Let us now derive the term of core repulsion. Kayser
and Ravech´e [42] performed an expansion in Legendre se-
ries of the core repulsion energy (Eq. (16)). At second
order, they found
1
2π
2π
0
dψ
|sin γ (Ω, Ω
)| =
π
4
1 −
5
8
P
2
(cos θ) P
2
(cos θ
)
. (23)
Retaining the orientation-dependent term, multiplying
by f (θ) f (θ
)sinθ
and integrating over θ
and Ω, the av-
erage energy of core repulsion reads (Eq. (14))
F
exc
(f (θ) ,f(θ
) ,Ω,Ω
)
Nk
B
T
= −
5
2
φ
φ
∗
S
2
2
= −
φ
φ
∗
a
2
2
10
. (24)
(Note that the 4th-order term in the development of
Eq. (23) would yield a term in S
2
4
or B
8
in Eq. (24). It
can therefore be neglected.)
The last term of equation (13), the magnetic energy,
is simply
dΩf(θ) E
m
(θ)
k
B
T
= −KBS
1
− JB
2
S
2
=
−KB
a
1
3
− JB
2
a
2
5
.
By summing the three terms, the free energy reads
F − F
0
Nk
B
T
=lnΛ
3
ρ −1+
a
2
1
6
+
a
4
1
60
−
a
2
1
a
2
15
+
a
2
2
10
−
φ
φ
∗
a
2
2
10
− KB
a
1
3
− JB
2
a
2
5
.
The free energy is straightforwardly minimized over
a
1
and a
2
(only terms up to the second order in B are
retained):
S
1
=
a
1
3
=
K
3
B =
µB
3k
B
T
, (25)
S
2
=
a
2
5
=
J +
K
2
3
5
1 −
φ
φ∗
B
2
=
∆χV
µ
0
k
B
T
+
µ
k
B
T
2
15
1 −
φ
φ
∗
B
2
. (26)
Note that S
1
is independent of φ, whereas 1/S
2
varies
linearly with φ.
So far, we have determined the first and second mo-
ments of the orientational distribution function in a static
magnetic field in two limit cases, at low concentration and
at low field. Let us now consider the case of a field of high
frequency.
5.5 High-frequency field
We have already seen in Section 5.2.2 that in a high-
frequency field (a few 100 Hz), the particles cannot follow
the field variation; they respond to the average of the field.
Then, S
1
and S
2
are derived immediately since all dipolar
terms disappear from the equations:
S
1
=0,
S
2
=
∆χV
15µ
0
k
B
T
1 −
φ
φ
∗
B
2
eff
. (27)
The nematic order parameter varies as B
2
for all fields
and it is negative, in contrast with the case of a static field
of low intensity.
5.6 Polydispersity
As will be seen in the discussion of the results, the poly-
dispersity of the samples must explicitly be taken into ac-
count in the model. Following Bacri et al. in their study of
ferrofluid suspensions [34a,43], the birefringence and the
magnetization of a suspension of goethite particles can be
B.J. Lemaire et al.: Physical properties of aqueous suspensions of goethite (α-FeOOH) nanorods (Part I) 305
expressed as the linear superposition of those of monodis-
perse suspensions. For this purpose, the size distribution
P (ν) of Section 2.3 is used:
M =
∞
0
dνP(ν) M
ν
,
∆n =
∞
0
dνP(ν) ∆n
ν
,
where M
ν
and ∆n
ν
are the magnetization and the mag-
netic birefringence of a monodisperse suspension of par-
ticles of size ν, magnetic moment µ
ν
and volume V
ν
.Let
us give the scaling properties of µ
ν
and V
ν
. Since the re-
manent magnetism of goethite particles is most often de-
scribed as a surface effect, we assume that the longitudinal
magnetic moment is proportional to the surface area of the
particles: µ
ν
= ν
2
µ, where µ is the magnetic moment of a
particle of average dimensions (and volume V ). Obviously,
V
ν
= ν
3
V .
The linear relations between the magnetization and
the first moment of the angular distribution, and between
the magnetic birefringence of the suspension and the ne-
matic order parameter are used to derive the following
equations:
M(B)=
φ
V
m
µ
∞
0
dνP(ν) ν
2
S
1
(ν
3
JB
2
,ν
2
KB) , (28)
∆n(B)=φ∆n
sat
V
V
m
∞
0
dνP(ν) ν
3
S
2
(ν
3
JB
2
,ν
2
KB) ,
(29)
where J and Krefer to a particle of average dimensions.
In principle, the linear superposition described above is
only valid when particles of different sizes do not interact
with their neighbours, i.e. in the dilute regime. Neverthe-
less, we will also use this approximation in the concen-
trated regime because we have no other alternative.
5.7 Discussion of the results
The variations of the birefringence with the magnetic field
were firstly fitted at low frequency, both at high and low
fields, and secondly at high frequency. Finally, the field-
cooled zero-field magnetisation curve was also fitted at low
fields (Fig. 9).
In order to fit the whole birefringence curve as a func-
tion of field intensity (for fields up to 1 T) at low frequency,
we use the formula for the nematic order parameter in the
dilute regime S
◦
2
. Indeed, we were not able to derive S
2
in
the concentrated regime at large fields. We thus write the
birefringence as the product of a function of the volume
fraction and of the nematic order parameter in the dilute
regime S
◦
2
:
∆n = φ∆n
sat
S
◦
2
(JB
2
,KB) .
0.0 0.1 0.2 0.3 0.4 0.5 0.6
-4
-2
0
2
∆
n ( 10
-4
)
B (T)
Fig. 12. Fits by the model of the evolution of the birefringence
versus field intensity of an isotropic suspension (φ =3.6%)
under static conditions (Eqs. (7) and (20)).
The three fitting parameters are ∆n
sat
, ∆χ and µ.
Fitting the birefringence without taking into account the
polydispersity yields unphysical values for ∆χ.Wethus
used a sum of 25 terms of the type: φ
i
∆n
sat
S
◦
2
(J
i
B
2
,
K
i
B) with size parameters ν
i
= i/10 (i =1, 2, ,25) to
evaluate the integral in formulae (28) and (29). Figure 12
shows the fit for a volume fraction φ =3.63%. The model
curve describes the experimental data very well. For the
different concentrations 0.1 <φ<5.5%, the fits yield
−8.10
−4
<∆χ<−3.10
−4
and 600 <µ<1000 µ
B
. These
values compare quite well with those measured with the
SQUID magnetometer in the nematic phase (Sect. 4.3).
We then fitted the birefringence at low field, still at
low frequency, as a function of the volume fraction. The
series expansion of the nematic order parameter is used:
∆n = φ∆n
sat
∆χV
m
µ
0
k
B
T
+
µ
2
(k
B
T )
2
15
1 −
φ
φ
∗
B
2
.
For each volume fraction, the birefringence is fitted
with a parabola for field intensities smaller than 100 mT
(1st series of measurements) and 37 mT (2nd series of mea-
surements). Then, a linear fit is performed on the inverse
of the coefficient (∆n/B
2
) of the parabola, as a function of
the volume fraction (Fig. 13). Indeed, φB
2
/∆n scales like
(φ −φ
∗
). This yields φ
∗
=6%(φ
∗
represents the metasta-
bility limit of the isotropic phase, also called spinodal) for
both series of measurements, using the values of ∆χ and
µ determined with the SQUID experiments.
The same method is used at high frequency (Figs. 14
and 15). The linear fit on the coefficient of the parabola
yields again the same value for the volume fraction of the
spinodal φ
∗
= 6%. In order to account for this value, one
could use the method of Fraden et al. [44]. However, it
gives here a much too high result (60%) probably because
it is valid for very elongated rods, which is not the case of
goethite particles.
Finally, a fit of the magnetisation curve at low field us-
ing the formula: M =
φ
µ
2
3V
m
k
B
T
B, where V
m
is the average
306 The European Physical Journal E
0.00 0.02 0.04 0.06
0
2
4
6
8
10
12
φ
B
2
/
∆
n (T
2
)
φ
0.00 0.02 0.04 0.06 0.08
0.00
0.01
0.02
0.03
0.04
b)
a)
∆
n/B
2
(T
-2
)
φ
Fig. 13. Two different representations of the linear birefrin-
gence of an isotropic suspension versus volume fraction, under
static conditions and weak fields. Solid lines are fits by the
model (Eqs. (7) and (26)).
0.000 0.005 0.010 0.015 0.020
-5
-4
-3
-2
-1
0
∆
n (10
- 5
)
B
eff
(T)
Fig. 14. Fit of the evolution of the birefringence versus field
intensity of an isotropic suspension (φ = 5.5%) under a 400 Hz
magnetic field (Eqs. (7) and (27)).
volume of the particles, yields µ ≈ 1000 µ
B
,whichis
consistent with the measurements on the nematic phase
(Sect. 4.3).
Therefore, the different evolutions of the birefringence
and the magnetisation, with field intensity and volume
fraction, in a static as well as in a high-frequency field,
can all be consistently described in the frame of this rea-
sonably simple model, in spite of all its approximations.
The fit parameters obtained agree fairly well with the ex-
perimental measurements of the magnetic properties of
goethite suspensions.
At this stage, let us try to summarise the most salient
features of these very peculiar suspensions. S
1
, the first
moment of the orientational distribution function, arises
from the reorientation of the permanent magnetic mo-
ments in the external magnetic field. This phenomenon
is similar to the Debye reorientational contribution to
the dielectric constant of a polar isotropic liquid. At low
field, the orientational contribution to the magnetisation
is µS
1
=
µ
2
B
3k
B
T
(Eq. (21)) and the response to a static
or low-frequency field can be described by an effective
0.00 0.02 0.04 0.06
-0.2
-0.1
0.0
∆
n/B
eff
2
(T
-2
)
φ
0.00 0.02 0.04 0.06
-6
-4
-2
0
b)
a)
φ
B
eff
2
/
∆
n (T
2
)
φ
Fig. 15. Two different representations of the magneto-optic
birefringence of an isotropic suspension versus volume fraction,
under a 400 Hz magnetic field. (The square and circle symbols
correspond, respectively, to two distinct series of experiments.)
Solid lines are fits by the model (Eqs. (7) and (27)).
0 30 60 90 120 150 180
0.0
0.2
0.4
0.6
0.8
1.0
θ
(˚)
100 mT
500 mT
1.5 T
O D F
Fig. 16. Evolutions with magnetic-field intensity of the (non-
normalised) orientational distribution functions (ODF).
diamagnetic susceptibility ∆χ
eff
= ∆χ +
µ
0
µ
2
3k
B
TV
.Dueto
the large permanent moment µ of the goethite nanorods,
∆χ
eff
is positive. At strong fields, the dipolar contribu-
tion to the magnetisation saturates and ∆χ
eff
becomes
negative. Then, the particles reorient perpendicularly to
the field. At high frequency, the particles cannot follow
the field variations and ∆χ
eff
= ∆χ: the permanent mo-
ment does not give anymore a dipolar contribution to the
magnetic susceptibility.
Qualitatively speaking, the effects induced by the mag-
netic field in the isotropic phase of goethite suspen-
sions are similar to other field-induced effects in isotropic
liquids, i.e. dipolar order induced in molecular liquids
or polymers under strong d.c. electric fields. However,
goethite suspensions are outstanding for two reasons.
Firstly, due to the large values of µ and ∆χ, moder-
ate magnetic fields induce very strong orders, both dipo-
lar (S
1
∼ 0.4 at 0.3 T) and quadrupolar (S
2
∼−0.3
at 0.9 T). In comparison, the values of S
2
induced in
polar liquids are usually much smaller and strong fields
(electric fields of ∼ 30 V/µm) are needed to induce
the so-called paranematic phase [45], even close to the
B.J. Lemaire et al.: Physical properties of aqueous suspensions of goethite (α-FeOOH) nanorods (Part I) 307
isotropic/nematic transition. Secondly, goethite suspen-
sions differ from other systems by the different symme-
try of the induced order, compared to the usual nematic
(S
2
= 0) or dipolar cases (S
1
= 0). In fact, both S
1
and
S
2
are induced by the field, with opposite signs. To il-
lustrate the symmetry of the system, we show the ODFs
of the goethite suspensions calculated at increasing fields
(Fig. 16). Up to B =
K
3|J|
, f(θ) has its maximum at θ =0
and the induced order is dipolar with the nanorods aligned
on average along the field. Interestingly, at higher fields,
f(θ) has then a maximum at θ
m
= arccos
K
3|J|B
=0
and the nanorods preferentially align along a cone around
the field direction. Both dipolar and quadrupolar orders
are strong and, strictly speaking, in terms of symmetry,
the system is neither nematic nor ferromagnetic (dipolar).
This kind of order, spontaneous or induced, has not been
observed previously or theoretically predicted. Finally, at
very strong fields, the cone angle increases to π/2 and the
particles orient perpendicularly to the field. The system
is then similar to an induced nematic phase with negative
nematic order parameter.
6 Conclusion
Aqueous suspensions of goethite nanorods, depending on
volume fraction, form stable isotropic and nematic phases.
The isotropic phase has very peculiar magnetic proper-
ties because goethite nanorods align parallel to a weak
magnetic field but perpendicular to a strong field. The
magnitude of these effects is remarkable, leading to very
large nematic order parameters around 1 T. On the ba-
sis of previous structural and magnetic studies of goethite
nanorods, we have interpreted these phenomena by the
competition between the negative anisotropy of magnetic
susceptibility and the existence of a permanent magnetic
moment due to non-compensated surface spins. A statis-
tical physics model based on these ingredients (and there-
fore a somewhat hybrid of models for ferrofluids and liq-
uid crystals) and including polydispersity could describe
all the experimental data, at low and high fields and at
low and high frequencies, in a consistent way. We shall
describe in Part II the physical properties of the nematic
phase and show that they can also be explained within
the same set of assumptions.
Future developments should include the investigation
of the magnetic properties of the suspensions around and
above the N´eel temperature, where the permanent mag-
netic moment should vanish. Size fractionations of the sus-
pensions should also be performed to reduce the polydis-
persity that is much too large in this system. Finally, in-
corporating the van der Waals interactions in the model
is still an open theoretical question.
The authors are deeply indebted to C. Bourgaux and L.
Fruchter for their help with the SAXS and magnetic measure-
ments, respectively, to H. Lekkerkerker and N. Dupuis for very
stimulating discussions, to one of the reviewers for very help-
ful comments, and to ESRF for beamtime provision (SC725-
SC728) as well as to T. Narayanan for his strong support. We
are also very grateful to P.C. Scholten for drawing our atten-
tion to reference [12].
References
1. P. Davidson, P. Batail, J.C.P. Gabriel, J. Livage, C.
Sanchez, C. Bourgaux, Prog. Polym. Sci. 22, 913 (1997);
J.C.P. Gabriel, P. Davidson, Adv. Mater. 12, 9 (2000);
Top. Curr. Chem. 226, 119 (2003).
2. H. Zocher, Z. Anorg. Allg. Chem. 91, 147 (1925).
3. L. Onsager, Ann. N.Y. Acad. Sci. 51, 627 (1949).
4. G.J. Vroege, H.N.W. Lekkerkerker, Rep. Prog. Phys. 55,
1241 (1992).
5. J.C.P. Gabriel, F. Camerel, B.J. Lemaire, H. Desvaux, P.
Davidson, P. Batail, Nature 413, 504 (2001).
6. J.C.P. Gabriel, C. Sanchez, P. Davidson, J. Phys. Chem.
100, 11139 (1996).
7. P. Davidson, C. Bourgaux, L. Schoutteten, P. Sergot, C.
Williams, J. Livage, J. Phys. II 5, 1577 (1995).
8. A. Mourchid, A. Delville, J. Lambard, E. L´ecolier, P.
Levitz, Langmuir 11, 1942 (1995).
9. B.J. Lemaire, P. Davidson, J. Ferr´e, J.P.Jamet, P. Panine,
I. Dozov, J.P. Jolivet, Phys. Rev. Lett. 88, 125507 (2002).
10. R.M. Cornell, U. Schwertmann, The Iron Oxides (VCH,
Weinheim, Germany, 1996).
11. J. Hernandez, PhD Thesis, University of Paris VI (1998).
12. a) Q. Majorana, C. R. Acad. Sci. Paris 135, 159, 235
(1902); b) Q. Majorana, Rend. Accad. Lincei 11-1, 374,
463, 531 (1902); c) 11-2, 90,139 (1902); d) A. Cotton, H.
Mouton, C. R. Acad. Sci. Paris 141, 317, 349 (1905); 142,
203 (1906); e) 145, 229 (1907); f) A. Cotton, H. Mouton,
Ann. Chim. Phys. 11, 145, 289 (1907).
13. J.P. Jolivet, Metal Oxide Chemistry and Synthesis. From
Solution to Solid State (Wiley, Chichester, UK, 2000).
14. R.J. Atkinson, A.M. Posner, J.P. Quirk, J. Phys. Chem.
71, 550 (1967).
15. A. Guinier, X-Ray Diffraction in Crystals, Imperfect Crys-
tals and Amorphous Bodies (Dover, New York, USA,
1994).
16. O.Pelletier,C.Bourgaux,O.Diat,P.Davidson,J.Livage,
Eur. Phys. J. E 2, 191 (2000).
17. X. Wen, R.B. Meyer, D.L.D. Caspar, Phys. Rev. Lett. 63,
2760 (1989).
18. Z. Dogic, S. Fraden, Phys. Rev. Lett. 78, 2417 (1997).
19. J.M.D. Coey, A. Barry, J M. Brotto, H. Rakoto, S. Bren-
nan, W.N. Mussel, A. Collomb, D. Fruchart, J. Phys. Con-
dens. Matter 7, 759 (1995).
20. A. Herpin, Th´eorie du Magn´etisme (Presses Universitaires
de France, Paris, 1968).
21. S. Bocquet, R.J. Pollard, J.D. Cashion, Phys. Rev. B 46,
11657 (1992).
22. D. Broˇz, A.
ˇ
Solcov´a, J.
ˇ
Subrt, B. Sedl´ak, F. Zounov´a, S.I.
Reiman, Acta Phys. Slov. 39, 235 (1989).
23. L. N´eel, J. Phys. Soc. Jpn. Suppl. 17, B-I, 676 (1962).
24. J.D. Dana, E.S. Dana, The System of Mineralogy,7thedi-
tion, Vol. 1 (Wiley, New York, 1944).
25. W.A. Deer, R.A. Howie, J. Zussman, Rock-Forming Mate-
rials,Vol.5 (Longmans, London, 1962).
26. T. Narayanan, O. Diat, P. B¨osecke, Nucl. Instrum. Meth-
ods Phys. Res. A 467, 1005 (2001).
308 The European Physical Journal E
27. A.J. Leadbetter, E.K. Norris, Mol. Phys. 38, 669 (1979).
28. P. Davidson, D. Petermann, A.M. Levelut, J. Phys. II 5,
113 (1995).
29. W. Maier, A. Saupe, Z. Naturforsch. A 13, 564 (1958); 14,
882 (1959); 15, 287 (1960).
30. P.G. de Gennes, J. Prost, The Physics of Liquid Crystals,
2nd edition (Clarendon, Oxford, UK, 1993).
31. M. Deutsch, Phys. Rev. A 44, 8264 (1991).
32. J. Ferr´e, G.A. Gehring, Rep. Prog. Phys. 47, 513 (1984).
33. E. Hasmonay, E. Dubois, J C. Bacri, R. Perzynski, Y.L.
Raikher, V.I. Stepanov, Eur. Phys. J. B 5, 859 (1998).
34. a) J C. Bacri, in Proceedings of the Conference Magnetic
Fluids and Powders, New Technological Materials, ECMF,
Minsk, U.R.S.S. (1991); b) S. Neveu-Prin, F.A. Tourinho,
J C. Bacri, R. Perzynski, Colloids Surf. A: Physicochem.
Eng. Asp. 80, 1 (1993).
35. a) M. Abe, M. Gomi, Jpn. J. Appl. Phys. 23, 1580 (1984);
b) A. Aharoni, J. Appl. Phys. 83, 3432 (1998); c) J.A.
Osborn, Phys. Rev. 67, 351 (1945).
36. S. Fraden, G. Maret, D.L.D. Caspar, Phys. Rev. E 48,
2816 (1993).
37. J. Tang, S. Fraden, Liq. Cryst. 19, 459 (1995).
38. H. Nakamura, K. Okano, Phys. Rev. Lett. 50, 186 (1983).
39. J.P. Straley, Mol. Cryst. Liq. Cryst. 22, 333 (1973).
40. J. Israelachvili, Intermolecular and Surface Forces,2nd
edition (Academic Press, London, 1991).
41.M.Doi,S.F.Edwards,The Theory of Polymer Dynam-
ics (Clarendon Press, Oxford, 1988) §8.5.3; W.H. de Jeu,
Physical Properties of Liquid Crystalline Materials (Gor-
don and Breach, New York, 1980).
42. R.F. Kayser, H.J. Ravech´e, Phys. Rev. A 17, 2067 (1978).
43. J C. Bacri, R. Perzynski, D. Salin, V. Cabuil, R. Massart,
J. Magn. Magn. Mater. 62, 36 (1986).
44. S. Fraden, G. Maret, D.L.D. Caspar, R.B. Meyer, Phys.
Rev. Lett. 63, 2068 (1989).
45. I. Lelidis, G. Durand, Phys. Rev. E 48, 3822 (1993).