bédard et al - 2004 - the effect of audit committee expertise, independence and activity on aggressive earning management
Bạn đang xem bản rút gọn của tài liệu. Xem và tải ngay bản đầy đủ của tài liệu tại đây (96.91 KB, 23 trang )
13
Submitted: July 2002
Accepted: November 2003
AUDITING: A JOURNAL OF PRACTICE & THEORY
Vol. 23, No. 2
September 2004
pp. 13–35
The Effect of Audit Committee Expertise,
Independence, and Activity on
Aggressive Earnings Management
Jean Bédard, Sonda Marrakchi Chtourou, and Lucie Courteau
SUMMARY: This study investigates whether the expertise, independence, and activities
of a firm’s audit committee have an effect on the quality of its publicly released financial
information. In particular, we examine the relationship between audit committee charac-
teristics and the extent of corporate earnings management as measured by the level of
income-increasing and income-decreasing abnormal accruals. Using two groups of U.S.
firms, one with relatively high and one with relatively low levels of abnormal accruals in
the year 1996, we find a significant association between earnings management and
audit committee governance practices.
We find that aggressive earnings management is negatively associated with the
financial and governance expertise of audit committee members, with indicators of
independence, and with the presence of a clear mandate defining the responsibilities of
the committee. The association is similar for both income-increasing and income-de-
creasing earnings management, suggesting that audit committee members are con-
cerned with both types of earnings management and do not exhibit an asymmetric loss
function similar to that of auditors.
Keywords: audit committee; financial expertise; earnings management; abnormal
accruals.
Data Availability: The data used is from public sources identified in the manuscript.
INTRODUCTION
C
oncerns about earnings management (e.g., Levitt 1998) and recent high-profile accounting
scandals have led most of the investing community to call for more effective audit commit-
tees as a mean to improve the quality of financial statements (e.g., Blue Ribbon Committee
[BRC] 1999; Securities and Exchange Commission [SEC] 2000). In response to these calls, regula-
tors have adopted regulations on the functioning of audit committees in a number of areas including
the expertise of their members, their independence, and their activities. The latest example of such
Jean Bédard is Professor at Université Laval, Sonda Marrakchi Chtourou is Assistant Professor at
the Faculté des Sciences Economiques et de Gestion de Sfax, and Lucie Courteau is Associate
Professor at the Free University of Bozen-Bolzano.
We thank Mark DeFond (associate editor), the two anonymous reviewers, Ann Gaeremynck, as well as the accounting
workshop participants at Katholieke Universiteit Leuven, Université Laval, Université Pierre Mendes-France, Université
Montesqieu, Universiteit Maastricht, and the participants at the Auditing Section Midyear Meetings for their comments. We
acknowledge the financial support of the Social Sciences and Humanities Research Council of Canada.
14 Bédard, Chtourou, and Courteau
Auditing: A Journal of Practice & Theory, September 2004
regulation in the U.S., the Sarbanes-Oxley Act of 2002 (hereafter SOX), requires that at least one
audit committee member have financial expertise, that all the members be independent from the
firm’s management, and that the committee oversee the accounting and financial reporting processes
as well as the audit of the financial statements.
While prior research on actual fraudulent financial reporting deficiencies provides evidence that
is generally consistent with the assertion that some of the practices recommended or required by
regulators are associated with lower likelihood of fraud (Beasley 1996; Abbott et al. 2004), there are
questions as to whether they also reduce less spectacular forms of earnings management. Klein
(2002) provides some evidence on this issue. In her examination of the association between audit
committee independence and earnings management for a sample of S&P 500 firms, she finds a
significant association between abnormal accruals and the presence of a majority of independent
directors on the committee, but “no meaningful relation between abnormal accruals and having an
audit committee comprised solely of independent directors” (Klein 2002, 389). Thus, evidence is
needed on the possible effects on earnings management of SOX requirements (financial expertise,
100 percent of independent members, and oversight) and of other audit committee best practices.
We investigate the relation between, on the one hand, the audit committee’s expertise (financial,
governance, and firm-specific expertise), independence, and activities and, on the other hand, ag-
gressive earnings management on a sample of 300 U.S. firms. The sample is composed of three
groups, one with aggressive income-increasing earnings management, one with aggressive income-
decreasing earnings management, and a third group of firms with low levels of earnings management
in the year 1996. Earnings management is measured as abnormal accruals estimated with a cross-
sectional version of the Jones (1991) model.
Controlling for specific motivations that firms may have to manage earnings, and for alternative
control mechanisms, as well as for variables that have been found to affect the reliability of abnormal
accruals measurement, we test whether recommended governance practices for audit committees are
associated with a lower likelihood that the firm be in one of the groups with high levels of earnings
management. A 1996 sample has the advantage of allowing us to examine firms that voluntarily
adopted the best governance practices before some of them were mandated by stock exchanges in
December 1999. Thus, we can test the effectiveness of these practices on a cross-section of firms
during the same period and increase the power of our tests by limiting the symbolic display of
conformity associated with mandatory rules (Kalbers and Fogarty 1998).
Our results suggest that an audit committee whose members have more expertise is more
effective in constraining earning management. Specifically, we find that the presence of at least one
member with financial expertise, which is now required by SOX, is associated with a lower likeli-
hood of aggressive earnings management, and so is the level of governance expertise in the commit-
tee. The association between the level of firm-specific expertise and the probability of earnings
management, however, is significant only for income-decreasing accruals.
Regarding independence, our results generally support the SOX requirement that all members of
the audit committee be independent. Contrary to Klein (2002) whose findings suggest that the
critical threshold for the number of independent directors on the audit committee is 50 percent rather
than 100 percent, we find no significant effect for a committee composed of 50-99 percent indepen-
dent members, but a significant reduction in the likelihood of aggressive earnings management when
100 percent of the members are independent. We also find that the percentage of stock options that
can be exercised in the short term by independent audit committee members is associated with a
higher likelihood of aggressive earnings management. This result provides some support for the
U.K. Combined Code (Financial Reporting Council [FRC] 2003) provision that the remuneration of
outside directors should not include stock options.
Two aspects of the audit committee’s activity, its size and the frequency of its meetings, do not
seem to affect the likelihood of aggressive earnings management. For the third aspect of committee
The Effect of Audit Committee Expertise, Independence, and Activity on Earnings Management 15
Auditing: A Journal of Practice & Theory, September 2004
activity, the responsibility of overseeing both the financial reporting and the audit processes, we find
a significantly negative association with the likelihood of aggressive earnings management. This last
result lends support to the SOX requirement that the role of the audit committee include the oversight
of both financial reporting and the audit process.
While most studies of earnings management consider either only income-increasing accruals or
the magnitude of accruals irrespective of their direction, we examine negative (income-decreasing)
and positive (income-increasing) earnings management separately. We find that except for the audit
committee oversight responsibilities, the effects are not statistically different between the two groups
of firms. This suggests that audit committee members are concerned with both income-increasing
and income-decreasing earnings management and do not exhibit an asymmetric loss function (Antle
and Nalebuff 1991).
Our results are subject to the inherent limitations of our measure of earnings management.
Abnormal accruals are subject to measurement errors that can lead to erroneous inference if the
measurement error is correlated with the audit committee characteristics (Klein 2002; Kothari et al.
forthcoming). While we control for possibly omitted variables that are found in prior literature to
affect the reliability of the measure of abnormal accruals, there is always a possibility that our results
are caused by measurement error.
This paper contributes to the literature on the association between audit committee characteris-
tics and earnings management in three ways. First, while most studies on audit committees focus on
the independence of committee members, we also examine their expertise and the extent of their
oversight mandate, two aspects that are emphasized in the Sarbanes-Oxley Act of 2002. Second, we
examine separately firms that, in 1996, showed evidence of income-increasing and income-decreas-
ing earnings management. Firms often claim that income-decreasing abnormal accruals are indica-
tive of conservative reporting behavior and Nelson et al. (2002) find that auditors are more likely to
require adjustments to positive than negative accruals. Our results contradict both as we find almost
no significant difference in the association of committee characteristics with the two types of earn-
ings management. Third, our sample includes firms of various sizes. While Klein (2002) studies a
sample of firms from the S&P 500 for 1992 and 1993 (an average of 346 firms per year), our sample
includes 300 firms of different sizes for 1996. Our sample firms’ median assets are $51 million
whereas Klein’s (2002) smallest firm has assets of $179 million. Since the audit committee require-
ments apply to firms of all sizes, our sample allows us to test the effect of these requirements on
smaller firms, which have also been found to be more prone to earnings management.
Overall, our results lend support to the assumptions underlying the SOX requirements that both
expertise and independence are important characteristics for an audit committee to effectively moni-
tor the financial reporting and audit processes. They can be used by other regulators that are
contemplating similar rules. For example, in Canada the proposed rules on audit committees require
that all members of the committee be independent, but does not require financial expertise (Ontario
Securities Commission [OSC] 2003).
The remainder of the paper is organized as follow. The next section provides the motivation for
the predicted association between audit committee characteristics and earnings management. The
third section discusses sample selection and research design. Results are presented in the fourth
section and conclusions in the last section.
THE ROLE OF THE AUDIT COMMITTEE IN MITIGATING
EARNINGS MANAGEMENT
Earnings Management
Earnings management generally implies a “purposeful intervention in the external financial
reporting process, with the intent of obtaining some private gain” (Schipper 1989, 92). Although
management may intervene in the process to signal private information and make the financial
16 Bédard, Chtourou, and Courteau
Auditing: A Journal of Practice & Theory, September 2004
reports more informative for users, we concentrate on the negative aspect of earnings management,
i.e., “to mislead stakeholders (or some class of stakeholders) about the underlying economic perfor-
mance of the firm” (Healy and Wahlen 1999, 368).
The audit committee’s primary role is to help ensure “high quality financial reporting”
(PricewaterhouseCoopers 1999, 7). As indicated by the BRC (1999, 7), the audit committee is the
“ultimate monitor of the [financial reporting] process.” The committee may reduce opportunistic
earnings management by “evaluating the competence and independence of the external auditors,” by
engaging in proactive discussions with company management and outside auditors regarding key
accounting judgments, and by probing “to find out the nature and extent of issues that management
and the auditors gave considerable attention to” as well as “the outcome of these discussions”
(Herdman 2002).
The literature concerning audit committees suggests three main categories of factors that might
affect their capacity in reducing earning management: the expertise of the members, and the indepen-
dence and activity level of the committee. Therefore we test the following three hypotheses:
H1: Firms with expert audit committee members are less likely to engage in aggressive
earnings management.
H2: Firms with an independent audit committee are less likely to engage in aggressive
earnings management.
H3: Firms with an active audit committee are less likely to engage in aggressive earnings
management.
We consider income-decreasing abnormal accruals separately because they are frequently used
by managers. For example, a survey by Nelson et al. (2002) indicates that 31 percent of the earnings
management attempts are income-decreasing compared to 53 percent that are income-increasing.
Managers have various motivations to reduce earnings. They may want to reduce the value of the
stocks prior to a management buyout (Perry and Williams 1994), to reduce the risk of adverse
political consequences (Cahan 1992; Jones 1991; Key 1997), or simply to create opportunities to
increase income in future periods (Levitt 1998). For example, the SEC (2003a) alleges that Xerox
created “cushion” reserves that it used when necessary to pump up its earnings by nearly $500
million in order to meet earnings targets. It is also true that the accruals used in one year to increase
earnings must be reversed in the following years, decreasing the earnings by the same amount.
Generally, previous research suggests that auditors try to constrain earnings management to a
greater extent if it is income-increasing than if it is income-decreasing. For example, Nelson et al.
(2002) find that auditors’ adjustment rate for income-increasing earnings management attempts is
higher than for income-decreasing attempts and Francis and Krishnan (1999) find that high income-
increasing accruals are more likely to result in auditor reporting conservatism. This greater attention
to income-increasing earnings management may be associated with professionally mandated skepti-
cism (Braun 2001) and auditors’ perception that litigation is more likely to occur when income is
overstated (Myers et al. 2003). In their study of auditor tenure, however, Myers et al. (2003) find that
if an auditor remains longer with a firm, then he or she is more likely to restrict management from
making extreme reporting decisions, both income-increasing and income-decreasing.
As in the case of auditors, it is possible that the audit committee restrains income-increasing to a
greater extent than income-decreasing earnings management because the members have an asym-
metric loss function: the likelihood of attracting media attention or being sued could be higher in
cases of income-increasing earnings management.
H4: The effect of audit committee characteristics is larger for income-increasing than
for income-decreasing earnings management.
The Effect of Audit Committee Expertise, Independence, and Activity on Earnings Management 17
Auditing: A Journal of Practice & Theory, September 2004
Audit Committee Expertise
In order to fulfill their responsibilities for monitoring internal control and financial reporting,
audit committee members should possess the necessary expertise. We examine three aspects of their
expertise: financial, governance, and firm-specific expertise.
First, based on the requirement by Section 407 of SOX, we investigate the effect of the presence
of at least one member with financial expertise. There is some empirical evidence that this require-
ment is effective for extreme events such as SEC violations and earnings restatement (e.g., McMullen
and Raghunandan 1996). While there is some experimental evidence that financial expertise is
associated with a higher likelihood that the committee support the auditor in an auditor-corporate
management dispute (DeZoort and Salterio 2001), greater focus on concerns that are critical for the
quality of financial reporting, and more structured discussion on reporting quality (McDaniels et al.
2002), to our knowledge there is no empirical evidence on the effectiveness of this requirement in
preventing less spectacular cases of earnings management.
Several authors suggest that the managerial labor market for outside directorships provides an
incentive to monitor effectively by rewarding effective outside directors with additional positions as
directors and disciplining those who have a record of poor monitoring performance (Fama and
Jensen 1983; Milgrom and Roberts 1992). For example, outside directors of firms charged with
accounting and disclosure violations by the SEC are more likely than others to lose their other
directorships (Gerety and Lehn 1997). Additional directorships not only signal outside directors’
competence to the managerial labor market, but it also helps them to acquire governance expertise
and to gain knowledge of best board practices. On the other hand, if the number of other director-
ships is too large, then it may reduce the time the director can devote to the particular firm, thus
decreasing the committee’s governing effectiveness (Morck et al. 1988; Beasley 1996). Conse-
quently, additional directorships may improve effectiveness up to a point, but beyond that point, the
committee may be penalized because of the time and effort absorbed by other directorships.
The experience of independent directors on the company’s board allows them to develop their
monitoring competencies while providing them with some firm-specific expertise such as knowledge
of the company’s operations and its executive directors. Thus, as their experience increases, they
become more effective at overseeing the firm’s financial reporting process. On the other hand, over
time the audit committee members may become more complacent, offsetting the knowledge effect.
Previous research results support the knowledge effect. For example, Kosnik (1987) finds that the
longer the average tenure of outside directors, the more likely the company is to resist greenmail
payments and Beasley (1996) finds that the likelihood of financial reporting fraud is a decreasing
function of the average tenure of outside directors.
Audit Committee Independence
To fulfill its oversight role and protect the interest of shareholders, the audit committee must be
independent of the firm’s management. We consider two aspects of independence: the number of
nonrelated outside members and whether these members participate in the firm’s stock option plans.
Section 301 of SOX requires that all members of the audit committee be independent. Several
studies find an association between the proportion of nonrelated outside directors on the audit
committee and some indicators of reporting quality such as the probability of SEC enforcement
action (Wright 1996) and the size of abnormal accruals (Klein 2002). Klein (2002) however, finds
that it is the presence of a majority of independent directors on the committee, rather than 100
percent, that seems to have a significant effect on the level of abnormal accruals. To provide
evidence on this issue, we examine the effect of both thresholds (50 percent and 100 percent) on the
committee’s effectiveness in monitoring the level of earnings management.
Stock option schemes may compromise committee members’ independence. While executive
stock options are designed to align the manager’s interests with those of the shareholders, they
18 Bédard, Chtourou, and Courteau
Auditing: A Journal of Practice & Theory, September 2004
sometimes have the opposite effect. For example, Safdar (2003) finds that executives manage
discretionary accruals prior to exercising substantial portions of their outstanding stock options.
Even if no research has examined the effect of stock options in the specific case of outside directors,
the U.K. Combined Code on Corporate Governance (FRC 2003) states that their remuneration
should not include stock options. We believe that such a practice is even more important for audit
committee members because it is their duty to monitor the quality of the financial reports. Hence, we
expect that outside directors with options that can be exercised currently or in the short run are less
effective in curtailing income-increasing earnings management, especially if the options are in-the-
money or at-the-money (i.e., the current stock price is higher than or equal to the exercise price of the
options). However, even if they can be exercised in the short term, Huddart and Lang (1996) show
that options are not necessarily exercised soon after their vesting date. If that is the case or if the
options are out-of-the-money, then it may be in the interest of committee members to allow income-
decreasing accruals in order to accumulate reserves to be used in subsequent years, when an increase
in earnings would enhance the value of the options.
Audit Committee Activity
Expertise and independence will not result in effectiveness unless the committee is active. We
examine three aspects of its level of activity: the duties it has to perform, the frequency of its
meetings, and its size. The duties of an audit committee can be classified into three categories
(Verschoor 1993; Wolnizer 1995): oversight of the financial statements, of the external audit, and of
the internal control system (including internal auditing). We focus on the first two because they are
the most relevant for income management. SOX (U.S. House of Representatives 2002, Section 2)
states that the purpose of an audit committee is to oversee the accounting and financial reporting
processes of the company as well as the audit of its financial statements. Furthermore, the BRC
(1999) recommends that the responsibilities should be memorialized in a formal charter approved by
the board of directors. A formal charter not only provides guidance to members as to their duties, but
it is also a source of power for the audit committee. Kalbers and Fogarty (1993) find that a formal
written charter establishing its responsibilities plays an important role in the power of the audit
committee and that its perceived effectiveness is significantly related to this concept of power.
The second dimension of committee activity we examine is the frequency of its meetings. An
audit committee eager to carry out its functions of control must maintain a constant level of activity
(National Commission on Fraudulent Financial Reporting [NCFFR] 1987) and best practices sug-
gest three or four meetings a year (Cadbury Committee 1992; KPMG 1999). McMullen and
Raghunandan (1996) show that the audit committees of firms that are facing SEC enforcement
actions or restating their quarterly reports are less likely to have frequent meetings. The committees
of only 23 percent of their problem companies met more than twice a year compared to 40 percent
for the other firms. Abbott et al. (2004) find similar results in a more recent sample.
As indicated by the BRC (1999, 26) “Because of the audit committee’s responsibilities and the
complex nature of the accounting and financial matters reviewed, the committee merits significant
director resources […] in terms of the number of directors dedicated to [it].” Best practices suggest
at least three members (Cadbury Committee 1992; BRC 1999), which provides the necessary strength
and diversity of expertise and views to ensure appropriate monitoring. The benefit of additional
members, however, must be weighed against the incremental cost of poorer communication and
decision making associated with larger groups (Steiner 1972; Hackman 1990). The objective is to
have a committee not so large as to become unwieldy, but large enough to ensure effective monitor-
ing. In general, it is recommended to limit the size of the committee to five (Arthur Andersen 1998)
or six members (National Association of Corporate Directors [NACD] 2000). While limited, the
evidence suggests that size may matter. For example, Archambeault and DeZoort (2001) find a
significantly negative relationship between committee size and suspicious auditor switches, but
Abbott et al. (2004) find no significant association between size and earnings misstatements.
The Effect of Audit Committee Expertise, Independence, and Activity on Earnings Management 19
Auditing: A Journal of Practice & Theory, September 2004
RESEARCH DESIGN
The objective of this study is to determine whether good audit committee practices reduce the
likelihood of earnings management as measured by abnormal accruals. Our sample is drawn from the
population of U.S. firms whose financial data appear on Compustat in 1996. From this population,
we identify the 100 firms with the highest income-increasing abnormal accruals, the 100 firms with
the highest income-decreasing abnormal accruals, and the 100 with the lowest abnormal accruals.
We categorize the first two groups as using “aggressive earnings management” (AEM) and the third
group as having “low earnings management” (LEM). Several studies indicate that all existing models
measure abnormal accruals with error (for example, Dechow et al. 1995). By including only firms
with high and low abnormal accruals in the sample, we seek to improve the power of our tests by
mitigating the measurement error problem.
1
Abnormal Accruals Estimation
Our sample is based on the complete set of firms on Compustat with a December 31, 1996 year-
end and complete accruals data for 1996. We exclude firms from the regulated (SIC 4000 to 4900),
financial (SIC 6000 to 6900), and government (SIC 9900) sectors because their special accounting
practices make the estimation of their abnormal accruals difficult. The abnormal component of total
accruals is estimated with the modified Jones (1991) cross-sectional model (DeFond and Jiambalvo
1994; Francis et al. 1999; Becker et al. 1998). This requires the estimation of a cross-sectional
regression for each industry (two-digit SIC codes), so we eliminate industries with less than ten
firms. These requirements leave 3,947 observations for the calculation of abnormal accruals.
Abnormal accruals (AbnAccruals) for each firm i in industry j are defined as the residual from
the regression of total accruals (the difference between cash from operations and net income) on two
factors that explain nondiscretionary accruals, the change in revenue and the level of fixed assets
subject to depreciation. All variables are deflated by total opening assets to reduce heteroscedasticity.
AbnAccruals
ijt =
TA C
ijt
/A
ijt–1
–[α
j
(1/A
ijt
–1
) + β
1j
(∆RE
ijt
/A
ijt–1
) + β
2j
(PPE
ijt
/A
ijt
–1
)] (1)
where:
AbnAccruals
ijt
= abnormal accruals for firm i from industry j in year t;
TAC
ijt
= total accruals for firm i from industry j in year t;
A
ijt–1
= total assets for firm i from industry j at the end of year t–1 (Compustat item 6);
∆RE
ijt
= change in net sales for firm i from industry j between years t–1 and t
(Compustat item 12);
PPE
ijt
= gross property, plant, and equipment for firm i from industry j in year t (Compustat
item 8);
α
j
,
β
1j
,
β
2
= industry-specific estimated coefficients from the following cross-sectional re-
gression:
TAC
ijt
/A
ijt–1
= α
j
(1/A
ijt–1
) + β
1j
(∆RE
ijt
/A
ijt–1
) + β
2j
(PPE
ijt
/A
ijt–1
)]+e
ijt
. (2)
Consistent with DeFond and Park (1997) and Subramanyam (1996) we drop 438 firms with
extreme earnings and cash flows from operation (in excess of the top and bottom 2 percent of all
observations) and 58 outliers.
2
The sample used to estimate Equation (2) separately for each of the
39 industries that meet our requirements contains 3,451 firms. Abnormal accruals are then computed
for each firm from Equation (1).
Panel A of Table 1 reports descriptive statistics for the entire sample of 3,451 firms. The average
1
Focusing on extremes (top and bottom deciles) may render our estimates of abnormal accruals vulnerable to the bias
caused by extreme cash flows and earnings. We control for this possible bias with a regression approach, including both cash
flows and earnings as control variables in the regression models, and with Kasznik’s (1999) matched-portfolio approach.
2
Firms with very large earnings or cash flows from operations have been shown to bias the estimation of discretionary
accruals. For detecting outliers, we use three criteria: Cook’s distance, Studentized residuals, and hat matrix. An observa-
tion is excluded from the sample as an outlier if it fails two out of these three tests.
20 Bédard, Chtourou, and Courteau
Auditing: A Journal of Practice & Theory, September 2004
(median) abnormal accrual is 0.000 (0.017) and 58 percent of the firms have positive abnormal
accruals. The average (median) current earnings and cash flows from operations relative to opening
total assets are –0.099 (0.031) and –0.029 (0.062), respectively. Compared to Klein (2002), the
population we use to estimate the abnormal accruals includes smaller firms (with median asset of
$82 million whereas Klein’s smallest firm has assets of $179 million), with lower profitability
(Klein’s average [median] earnings deflated by opening assets are 0.056 [0.048]) and generating
lower levels of cash flows from operations for each dollar of opening assets (Klein’s sample firms
have average [median] of 0.117 [0.107]).
While we take precautions (e.g., dropping outliers and firms with extreme earnings and cash
flows) to avoid known bias in the estimation of abnormal accruals, the possibility of measurement
error is always an issue in studies using the modified Jones model to measure discretionary accruals
in tests of earnings management. As noted by Klein (2002) any proxy for abnormal accruals yields
biased metrics if the measurement error in the proxy is correlated with omitted variables. Prior
studies suggest that the measurement error is correlated with current earnings, previous year’s
earnings, changes in earnings, current cash flows from operations, changes in cash flows, changes in
total accruals, firm size, and previous year’s return on assets (Kasznik 1999; Jeter and Shivakumar
1999; Klein 2002; Kothari et al. forthcoming).
Panel B of Table 1 reports the Spearman correlations of total and abnormal accruals with these
variables. The first two columns show that all variables are significantly correlated with the absolute
values of total and abnormal accruals, suggesting that the measure might be biased. We control for
this by including some of the possible omitted variables as control variables in the regression models
used to test the effect of the audit committee on the measure of abnormal accruals. Because we focus
on extremes (top and bottom deciles) in our analysis of the effect of audit committee characteristics,
our estimates of abnormal accruals are particularly vulnerable to the bias caused by cash flows and
earnings. For example, Jeter and Shivakumar (1999) show that the cross-sectional Jones model
yields systematically positive (negative) estimates of abnormal accruals for firms whose cash flows
are below (above) the industry median. Panel C shows that the possible correlated variables are
correlated to each other, suggesting that they capture much of the same processes. Consequently,
earnings and cash flows are included as control variables in the regression model used to test the
effect of audit committees on the measure of abnormal accruals, along with total assets and previous
year’s ROA. Because the top (bottom) decile of the abnormal accruals distribution is more likely to
contain firms with negative cash flows (earnings), we also include two indicator variables in the
regression models: one for the presence of negative cash flows and one for negative earnings.
3
Aggressive Earnings Management
In order to detect aggressive earnings management, we rank the 3,451 remaining firms on the
size of their abnormal accruals and select two subsamples of 100 firms each from both ends of the
distribution (i.e., the 100 largest positive and the 100 largest negative abnormal accruals). These 200
firms comprise the aggressive earnings management (AEM) subsample. We then select another
subsample of 100 firms with the lowest level of abnormal accruals centered around zero (50 negative
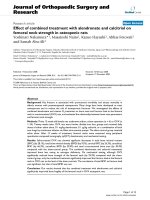
and 50 positive), which form the low earnings management (LEM) subsample. Figure 1 shows the
mean and median levels of abnormal accruals for each decile of the distribution. The subsample of
negative (positive) AEM is drawn from the first (tenth) decile, which has mean and median abnormal
accruals of –0.38 and –0.28 (0.27 and 0.22), respectively. The LEM subsample is drawn from
deciles 4 and 5, which have mean (median) abnormal accruals of –0.02 (–0.02) and 0.01 (0.01),
3
In a second attempt to control for omitted variables, we use Kasznik’s (1999) matched-portfolio method, adjusting the
value of each firm’s abnormal accruals by the median abnormal accruals for a portfolio of firms matched on the absolute
level of earnings. The correlation of possible correlated variables is lower with adjusted than with unadjusted abnormal
accruals with the exception of cash flows (for which it is larger). To control for the potential effect of these variables, we
keep the same control variables, except earnings, when the adjusted abnormal accruals are used to test the effect of the
audit committee. The results are substantially the same with the two approaches (see footnote 9).
The Effect of Audit Committee Expertise, Independence, and Activity on Earnings Management 21
Auditing: A Journal of Practice & Theory, September 2004
TABLE 1
Information for the Overall Population
Panel A: Descriptive Statistics on Accruals and Abnormal Accruals
Variable Mean Std. Dev. Median Minimum Maximum %Positive
Abnormal Accruals 0.000 0.187 0.017 –2.111 1.371 58
|Abnormal Accruals| 0.110 0.151 0.064 0.000 2.111 100
Total Accruals –0.070 0.204 –0.056 –2.159 1.471 27
|Total Accruals| 0.132 0.170 0.081 0.000 2.159 100
Earnings –0.099 0.397 0.031 –3.320 0.399 61
CashFlows –0.029 0.337 0.062 –2.363 0.525 66
Total Assets (in millions) 1,504 9,407 82 0 272,402 100
Panel B: Spearman Correlations of Total and Abnormal Accruals with Possible Correlated Variables
Variable |Total Accruals||Abnormal Accruals|
|Earnings| 0.36 (<0.01) 0.29 (<0.01)
|Earnings
t–1
| 0.16 (<0.01) 0.16 (<0.01)
∆Earnings| 0.31 (<0.01) 0.28 (<0.01)
|CashFlows| 0.34 (<0.01) 0.07 (<0.01)
∆CashFlows| 0.28 (<0.01) 0.24 (<0.01)
∆Total Accruals| 0.39 (<0.01) 0.37 (<0.01)
Ln(Assets) –0.29 (<0.01) –0.32 (<0.01)
ROA –0.23 (<0.01) –0.16 (<0.01)
Panel C: Spearman Correlations Among Possible Correlated Variables
Variable |Earnings
t–1
||
∆∆
∆∆
∆Earnings||CashFlows||
∆∆
∆∆
∆CashFlows||
∆∆
∆∆
∆Total Accruals|
|Earnings| 0.564 0.420 0.523 0.304 0.308
|Earnings
t–1
| 0.449 0.371 0.339 0.303
∆Earnings| 0.181 0.447 0.489
|CashFlows| 0.309 0.127
∆CashFlows| 0.506
The population consists of 3,451 firms from Compustat with a December 31, 1996 year-end, complete accruals data
excluding the regulated, financial, and government sectors after the removal of firms with extreme income and cash flows
from operation and outliers.
All variables except Total Assets and ROA are deflated by opening asset. Changes in the value of a variable between 1996
and 1995 are indicated by ∆, the absolute value of a variable by |variable|, t refers to the year 1996 and t–1 to the year
1995.
Abnormal Accruals = the abnormal component of total accruals estimated with the Jones cross-sectional model (see
Equation (1));
Total Accruals = difference between net income before extraordinary items and cash flows from operations;
Earnings = net income before extraordinary items;
CashFlows = cash flows from operations from cash flows statement;
Ln(Assets) = natural log of total assets; and
ROA = net income before extraordinary items for 1995 divided by total assets at the end of 1995.
22 Bédard, Chtourou, and Courteau
Auditing: A Journal of Practice & Theory, September 2004
respectively.
To collect 100 observations with full governance data in each category, we have to consider 203
observations for the positive subsample (AEM+), 286 for the negative subsample (AEM–), and 160
for the LEM subsample. Observations have to be dropped because of missing proxy statements (45,
113, and 37 firms, respectively), absence of an audit committee (7, 7, and 1), missing information on
directors’ stock option and stock holdings (4, 5, and 4) and changes in the board of directors during
1996 in firms for which the 1995 proxy statement is not available (45, 59, and 18).
Because it is not randomly selected, our sample is not necessarily representative of the popula-
tion. Table 2 shows some statistics on the nature of the firms in the population of 3,451 firms and the
sample of 300 firms used in this study. The distribution of industry composition by two-digit SIC
codes shows that the percentages of firms in each sector are similar between our sample and the
population, except for the service industry which is overrepresented in the sample. The other statis-
tics show that the sample is different from the population. The sample firms are smaller and their
mean growth is lower but their median growth is larger suggesting that some of the firms in the
population have large growth rates.
4
The mean loss is larger for the sample, but the median earnings
are the same. Both the mean and median cash flows are lower in the sample than in the population.
Audit Committee Variables
All the audit committee characteristics are hand-collected from proxy statements for 1996. For
each committee member, we determine whether he or she holds a professional certification in
accounting (CPA) or financial analysis (CFA) or has experience in finance or accounting. Our
definition of financial expertise is more restrictive than that of the BRC in that it excludes prior
experience as a CEO. We consider that the CEO position provides financial literacy but not exper-
tise. FinExpertise is coded 1 if at least one audit committee member has accounting or financial
expertise, and 0 otherwise. The committee members’ competence is also measured by GovExpertise,
which is the average number of directorships held by nonrelated outside directors in unaffiliated
firms, and by FirmExpertise measured as the average number of years of board service for nonrelated
outside committee members.
Consistent with prior research and the requirements of SOX, we classify directors as executives,
4
Excluding two extreme observations from the population reduces the mean from 1.20 to 0.56.
FIGURE 1
Mean and Median Abnormal Accruals by Decile over the 3,451 Sample Firms
a
a
The population consists of 3,451 firms from Compustat with a December 31, 1996 year-end, complete accruals data
excluding the regulated, financial, and government sectors after the removal of firms with extreme income and cash
flows from operation and outliers. The deciles of the distribution are obtained by ranking the remaining firms on their
Abnormal Accruals. Abnormal Accruals is the abnormal component of total accruals estimated with the Jones cross-
sectional model (see Equation (1)).
-50%
-40%
-30%
-20%
-10%
0%
10%
20%
30%
12345 678910
MEAN
ME DI AN
The Effect of Audit Committee Expertise, Independence, and Activity on Earnings Management 23
Auditing: A Journal of Practice & Theory, September 2004
related, or independent outsiders.
5
Related directors are those who have business relationships with
the firm or its managers, although they are not employees of the firm. Consultants, suppliers,
bankers, former employees, and managers’ family members as well as employees of other firms that
have a business relationship with the firm are part of this group. The independent outsider group
includes all directors who seem to have no relation with the firm other than their position as
directors. To clarify the affiliations disclosed in the proxy statements, we obtain the list of each firm’s
affiliated companies in Who Owns Whom (1996). Two dichotomous variables are used to measure
independence: 100% Ind is coded 1 if the audit committee is composed solely of nonrelated outside
directors, and 0 otherwise, and 50-99%Ind is coded 1 if the committee is composed of more than 50
percent but less than 100 percent of nonrelated outside directors, and 0 otherwise. The adverse effect
on independence potentially caused by stock option schemes (StockOptions) is measured as the ratio
of stock options that can be exercised in the 60 days following fiscal year-end to the total of options
and stocks held by nonrelated outside committee members.
We measure the three dimensions of audit committee activity as follows. The presence of a clear
mandate defining the responsibilities of the audit committee is measured with the indicator variable
Mandate, which is coded 1 if the proxy statement indicates that the committee is responsible for the
5
In order to be considered as independent for purposes of SOX, an audit committee member may not accept any
consulting, advisory, or other compensatory fee from the firm or be affiliated to the firm or any of its subsidiaries in any
other way (SOX 2002).
TABLE 2
Descriptive Statistics for the Population and the Sample
Panel A: Industry Composition
Population
b
Sample
c
Variable n % n %
SIC Code
10 Mining 312 9 26 9
20 Construction 722 21 50 17
30 Manufacturing 1269 37 106 35
50 Wholesale and Retail Trade 377 11 28 9
70–80 Services 771 22 90 30
Total 3451 100 300 100
Panel B: Financial Characteristics
Variable
a
Population
b
Sample
c
Mean Median Mean Median
Total Assets (in millions) 1,504 82 632 51
GrowthSales 1.20 0.13 1.05 0.28
Earnings –0.10 0.03 –0.17 0.03
CashFlows –0.03 0.06 –0.10 0.03
a
Earnings are Net Income before Extraordinary Items and CashFlows are Cash Flows from Operations, both deflated by
opening assets. GrowthSales is the growth rate in Net Sales from 1995 to 1996.
b
The population consists of 3,451 firms from Compustat with a December 31, 1996 year-end, complete accruals data
excluding the regulated, financial, and government sectors after the removal of firms with extreme income and cash
flows from operation and outliers.
c
The sample consists of three groups of 100 firms, each based on their level of abnormal accruals for the year 1996: the
group with the highest positive (income-increasing) accruals, the group with the highest negative (income-decreasing)
accruals, and the group with the accruals closest to 0.
24 Bédard, Chtourou, and Courteau
Auditing: A Journal of Practice & Theory, September 2004
oversight of both the financial statements and the external audit, and 0 otherwise. The frequency of
committee meetings is measured with a dichotomous variable (Meetings), which equals 1 if the audit
committee held three or more meetings in 1996, and 0 otherwise.
6
The size of the committee is
measured with a dichotomous variable (Members>2), which equals 1 if the audit committee has
more than two members, and 0 otherwise.
Control Variables
We control for confounding factors that may be related to our measure of abnormal accruals
and/or audit committee characteristics. First, we control for the variables possibly correlated with the
bias in our measure of abnormal accruals variables: cash flows from operations (|CashFlows|),
current earnings (|Earnings|), the presence of negative cash flows (NegCF) or negative earnings
(Loss), long-term debt (Debt), firm size (Ln(Assets)), sales growth (GrowthSales), and previous
year’s return on assets (ROA). Second, we control for the fact that some of the sample firms may be
in a situation that gives them particular incentives to manage earnings that have nothing to do with
the quality of their corporate governance practices. It has been shown that firms have a tendency to
use income-increasing accruals before an initial public offering (Teoh et al. 1998), so we control for
this with an indicator variable (IPO) that equals 1 if the firm had an IPO in 1996. Third, we control
for two monitoring mechanisms that decrease the need for an efficient audit committee: Big6 is an
indicator variable that captures the effect of a Big 6 auditor on earnings management and BlockHolders
indicates the presence of outside shareholders owning at least 5 percent of the firm’s shares and who
are in a position to monitor the financial reporting process.
Empirical Model
We examine the relation between aggressive earnings management and governance characteris-
tics by estimating the coefficients in the following multinomial logit regression model:
EarnMan = β
0
+ β
1
FinExpertise + β
2
GovExpertise + β
3
FirmExpertise + β
4
50-99%Ind
+ β
5
100%Ind + β
6
StockOptions + β
7
Mandate + β
8
Meetings
+ β
9
Members>2 + β
10
|CashFlows| + β
11
|Earnings| + β
12
NegCF + β
13
Loss
+ β
14
Debt + β
15
Ln(Assets) + β
16
ROA + β
17
GrowthSales
+ β
18
IPO +β
19
Big6 +β
20
Blockholders + ε (3)
where
The first nine independent variables measure audit committee characteristics and they constitute
our test variables, the next eight control for omitted variables in the estimation of abnormal accruals,
and the last three control for specific earnings management situations and other monitoring mechanisms.
RESULTS
Univariate Analysis
Table 3 provides descriptive statistics, by earnings management category, for the financial vari-
ables, audit committee characteristics, and control variables in the sample. The first three columns
present the mean and median of each variable for each of the three subsamples (AEM+, AEM–, LEM),
and the last three present the results of tests of differences among them using t-tests on the means and
Kruskal-Wallis tests on the medians for continuous variables, and Chi-square tests for dichotomous
variables.
6
The BRC does not suggest a minimum number of meetings. Menon and Williams (1994) suggest that an audit committee
needs to hold a minimum of two meetings per year, while the Canadian Institute of Chartered Accountants (1981)
suggests that at least three meetings are required for the committee to perform its duties effectively.
−+
=
)(Prob
),(Prob
log
LEM
AEMAEM
EarnMan
.
The Effect of Audit Committee Expertise, Independence, and Activity on Earnings Management 25
Auditing: A Journal of Practice & Theory, September 2004
TABLE 3
Descriptive Statistics by Earning Management Group and Univariate Tests Comparing the Groups
Panel A: Industry Composition and Financial Characteristics
AEM+ AEM– AEM+
Variable Name
a
AEM+
b
AEM– LEM versus versus versus
Number of Observations 100 100 100 LEM
c
LEM AEM–
SIC Code
1000 Mining 9 5 12
2000 Construction 7 15 28
3000 Manufacturing 35 33 38 *** ***
5000 Wholesale and Retail Trade 13 8 7
7000–8000 Services 36 39 15
Total 100 100 100
Total Assets (millions) Mean 94.30 216.81 1583.83 *** ***
Median 42.84 33.28 230.58 *** ***
GrowthSales Mean 0.865 1.695 0.601 *
Median 0.351 0.456 0.155 *** ***
Earnings Mean 0.03 –0.55 0.00 *** ***
Median 0.11 –0.37 0.05 *** *** ***
CashFlows Mean –0.24 –0.12 0.07 *** *** *
Median –0.13 0.06 0.12 *** ** ***
Total Accruals Mean 0.27 –0.43 –0.07 *** *** ***
Median 0.23 –0.35 –0.07 *** *** ***
Abnormal Accruals Mean 0.32 –0.38 0.00 *** *** ***
Median 0.29 –0.29 0.00 *** *** ***
Panel B: Audit Committee Characteristics
AEM+ AEM– AEM+
Variable Name
a
AEM+
b
AEM– LEM versus versus versus
Number of Observations 100 100 100 LEM
c
LEM AEM–
Expertise
FinExpertise Mean 10% 18% 26% ***
GovExpertise Mean 0.98 1.19 1.92 *** ***
Median 0.00 0.58 1.50 *** ***
FirmExpertise Mean 4.50 3.97 6.75 *** ***
Median 3.00 3.33 5.83 *** ***
Independence
50-99%Ind Mean 81% 33% 22% * **
100%Ind Mean 42% 35% 65% *** ***
StockOptions Mean 0.31 0.40 0.28 ***
Median 0.13 0.26 0.17
Activity
Mandate Mean 57% 82% 93% *** ** ***
Meetings Mean 1.47 1.58 2.30 *** ***
Median 1.00 1.00 2.00 *** ***
Members>2 Mean 55% 64% 67% *
(continued on next page)
26 Bédard, Chtourou, and Courteau
Auditing: A Journal of Practice & Theory, September 2004
TABLE 3 (continued)
Panel C: Control Variables
AEM+ AEM– AEM+
Variable Name
a
AEM+
b
AEM– LEM versus versus versus
Number of Observations (n = 100) (n = 100) (n = 100) LEM
c
LEM AEM–
|CashFlows| Mean 0.26 0.37 0.18 * *** **
Median 0.13 0.24 0.14 *** ***
|Earnings| Mean 0.18 0.59 0.14 *** ***
Median 0.13 0.37 0.07 *** *** ***
NegCF Mean 86% 38% 14% *** *** ***
Loss Mean 21% 82% 20% *** ***
Debt Mean 0.23 0.23 0.24
Median 0.19 0.12 0.23 ** *
Ln(Assets) Mean 3.83 3.67 5.55 *** ***
Median 3.76 3.51 5.44 *** ***
ROA Mean –0.08 –0.25 0.03 ** *** ***
Median 0.03 –0.06 0.05 *** ***
GrowthSales Mean 0.87 1.69 0.60 *
Median 0.35 0.46 0.16 *** ***
IPO Mean 29% 27% 2% *** ***
Big6 Mean 82% 87% 94% *** *
BlockHolders Mean 0.12 0.14 0.19 *** ***
Median 0.07 0.08 0.19 *** ***
*, **, *** Significant beyond the 10 percent, 5 percent, and 1 percent levels, respectively.
a
All financial variables except Ln(Assets) are scaled by total assets. Earnings, |Earnings|, CashFlows, |CashFlows|,
Total Accruals , Abnormal Accruals, Ln(Assets), and ROA are described in Table 1. GrowthSales is the growth in Net
Sales from 1995 to 1996. The other variables are defined as follow:
FinExpertise = indicator variable coded 1 if at least one member has financial expertise;
GovExpertise = average number of directorships held by nonrelated outside members in unaffiliated firms;
FirmExpertise = average years of board service of nonrelated outside members;
50-99%Ind = indicator variable coded is coded 1 if the committee is composed of more than 50 percent and less
than 100 percent of nonrelated outside directors;
100%Ind = indicator variable coded 1 if the audit committee is composed solely of nonrelated outside directors;
StockOptions = Ratio of stock options that can be exercised in the 60 days following fiscal year end to the sum of
options and stocks held by nonrelated outside committee members;
Mandate = indicator variable coded 1 if the 1996 proxy statement contains a clear mandate stating the
committee’s responsibility for the oversight of both the financial statements and the external audit;
Meetings = number of committee meetings in 1996;
Members>2 = indicator variable with the value of 1 if the audit committee has at least three members;
Loss = indicator variable coded 1 if Earnings is negative;
NegCF = indicator variable coded 1 if Cash Flows is negative;
Debt = long-term debt deflated by lagged total assets;
IPO = indicator variable coded 1 if the firm made an IPO in 1996;
Big6 = indicator variable coded 1 if the auditor is a BIG 6 audit firm; and
BlockHolders = cumulative percentage of outstanding common shares held by block holders holding at least 5 per-
cent of the firm’s shares and who are not affiliated with management.
b
The sample consists of three groups of 100 firms each based on their level of abnormal accruals for the year 1996.
AEM+ is the group with the highest positive (income-increasing) accruals, AEM– is the group with the highest nega-
tive (income-decreasing) accruals, and LEM is the group with the accruals closest to 0.
c
Kruskal-Wallis test for the continuous variables and Chi-square test for the dichotomous variables.
The Effect of Audit Committee Expertise, Independence, and Activity on Earnings Management 27
Auditing: A Journal of Practice & Theory, September 2004
A first glance at Panel A of Table 3 reveals that the firms in the LEM group are significantly
different from those in the two AEM groups in terms of industrial composition and financial charac-
teristics, in the characteristics of their audit committees, as well as in most of the control variables.
On the other hand, while the two AEM groups differ in terms of most financial characteristics, their
audit committees seem quite similar as only two of the committee characteristics we examine display
significant differences.
The industry composition is different between the LEM, AEM+, and AEM– subsamples. Both
AEM groups contain less mining and construction firms, which are often low-growth brick-and-
mortar organizations, but much more service firms including telecommunications and services to
business, which usually exhibit higher growth and are based on human capital. We take these
differences into account in the computation of abnormal accruals by estimating normal accruals by
industry, but it may be that the relationship between earnings management and audit committee
characteristics also varies across industries. The LEM firms are significantly more profitable than the
AEM– firms, but their earnings are lower than those of the AEM+. This is to be expected since
AEM+ firms have high income-increasing abnormal accruals, which make them appear more profit-
able than they actually are. This is supported by the fact that on average the AEM+ firms have
negative cash flows and that cash flows are significantly lower for firms of both AEM groups than for
those of the LEM group. By design, the AEM groups have very large abnormal accruals, which, on
average, amount to 32 percent of total opening assets for the AEM+ firms and –38 percent for the
AEM– firms, while abnormal accruals are centered around zero for the LEM firms. Total accruals
are negative for the LEM and the AEM– groups, though significantly more so for the latter, and
positive for the AEM+ group.
We control for the size differences by scaling all financial variables by total assets and we
include in Ln(Assets) in the regression model to control for the association between size and abnor-
mal accruals. The differences in profitability and growth are also taken into account by the inclusion
of |Earnings|, |CashFlows|, ROA, and GrowthSales as control variables in Equation (3).
The results of univariate tests on the governance variables seem to generally support H1–H3
(Panel B of Table 3). Audit committees of LEM firms, on average, have more financial, governance,
and firm-specific expertise than those of AEM firms, a significantly larger percentage of them have
only independent members (100%Ind), and they are more active (Mandate, Meetings). Hypothesis 4
does not seem to be supported, however, since only two variables (Mandate and 50-99%Ind) are
significantly different between the two groups of AEM firms.
Multivariate Analysis
Table 4 presents the results of the multinomial logit regression model used to test the relation
between aggressive earnings management and audit committee characteristics. The column titled
“AEM+, AEM– versus LEM” presents the joint test of the effect of the independent variables for
both groups of aggressive earnings management (AEM+, AEM–) while allowing the coefficients to
be different between the two AEM groups. The column titled “AEM+ versus LEM” presents the
effect of independent variables on the likelihood of aggressive positive earnings management (AEM+),
the column titled “AEM– versus LEM” presents the effect of independent variables on the likelihood
of aggressive negative earnings management, and the last column presents the test of the equality of
these two effects. The model is highly significant with a χ
2
statistic of 437 (p < 0.001) and a pseudo
R
2
of 0.77.
Expertise
For the presence of a member with financial expertise (FinExpertise), the results of the multino-
mial regression in Table 4 support H1. The coefficients for AEM+ and AEM– are negative (–2.817
and –1.361) and significant at the 0.01 and 0.03 levels, respectively. The p-value in the first column
(0.01) indicates that the effect is significant in the joint test of AEM+ and AEM– versus LEM.
28 Bédard, Chtourou, and Courteau
Auditing: A Journal of Practice & Theory, September 2004
TABLE 4
Multinomial Logit Model of Aggressive Earnings Management Categories on Audit Committee
Characteristics
a
AEM+, AEM– AEM+ AEM– AEM+
versus versus versus versus
Exp LEM
b
LEM LEM AEM–
Variable Sign p-value Coef. p-value
c
Coef. p-value p-value
Constant 0.156 0.92 –0.196 0.88
Expertise FinExpertise – 0.01 –2.817 0.01 –1.361 0.03 0.11
GovExpertise – 0.05 –0.392 0.04 –0.271 0.04 0.30
FirmExpertise – 0.11 –0.072 0.19 –0.122 0.05 0.29
Independence 50-99%Ind – 0.45 –0.082 0.44 0.147 0.37 0.44
100%Ind – 0.02 –0.989 0.01 –0.724 0.02 0.28
StockOptions + 0.01 1.748 0.03 2.196 0.00 0.30
Activity Mandate – 0.00 –2.352 0.00 –1.065 0.06 0.02
Meetings – 0.48 –0.019 0.47 0.046 0.42 0.41
Members>2 – 0.54 0.590 0.42 0.697 0.28 0.44
Control |CashFlows| 0.03 2.271 0.21 –1.601 0.33
|Earnings| 0.00 –3.721 0.05 2.953 0.06
NegCF 0.00 7.736 0.00 –2.771 0.00
Loss 0.00 –5.087 0.00 4.480 0.00
Debt 0.04 –0.356 0.80 –2.736 0.02
Ln(Assets) – 0.86 –0.002 0.99 0.101 0.60
ROA 0.04 –3.410 0.02 –1.745 0.05
GrowthSales 0.40 –0.175 0.23 –0.060 0.34
IPO + 0.00 2.673 0.02 4.142 0.00
Big6 – 0.43 0.577 0.29 0.138 0.43
BlockHolders – 0.01 –2.032 0.17 –5.454 0.00
*, **, *** Significant beyond the 10 percent, 5 percent, and 1 percent levels, respectively.
a
Results are from a Multinomial Logit of earnings management categories (AEM+, AEM– , LEM) on audit committee
characteristics and control variables. The model χ
2
statistic is 437 (p < 0.001) and the pseudo R
2
= 0.77.
The sample consists of three groups of 100 firms each based on their level of abnormal accruals for the year 1996.
AEM+ is the group with the highest positive (income-increasing) accruals, AEM– is the group with the highest nega-
tive (income-decreasing) accruals, and LEM is the group with the accruals closest to 0. The independent variables are
defined in Table 3.
b
The column titled “AEM+, AEM– versus LEM” presents the joint test of the effect of the independent variables for
both group of aggressive earnings managements (AEM+, AEM–), the column entitled “AEM+ versus LEM” presents
the effect of independent variables between firms that display aggressive positive earnings management and low earn-
ings, the column titled “AEM– versus LEM,” the effect of independent variables between firms that display aggressive
positive earnings management and low earnings, and the last column presents the test of the equality of the effect audit
committee characteristics between positive and negative earnings management.
c
Test statistics are one-tailed when the expected sign is positive or negative, and two-tailed otherwise.
Hence, financial expertise seems to decrease the likelihood of both positive and negative earnings
management. While the coefficient is lower and less significant for AEM–, as predicted in H4, the
test of difference between the two coefficients is not significant (p = 0.11). Thus, the presence of at
least one audit committee member with financial expertise required by SOX seems to reduce the
likelihood that a firm will use aggressive earnings management.
The Effect of Audit Committee Expertise, Independence, and Activity on Earnings Management 29
Auditing: A Journal of Practice & Theory, September 2004
The average number of other directorships of independent committee members (GovExpertise)
also has a significant effect on earnings management (p = 0.05). The regression coefficients on this
variable for AEM+ and AEM– (–0.392 and –0.271) are both significantly negative at the 0.04 level.
While the coefficient is larger in absolute value for AEM+, the test of difference between the two
coefficients is not significant (p = 0.30). Governance expertise is associated with a lower likelihood
that the firm be in one of the AEM groups.
The third dimension of expertise, the average tenure of outside committee members, has a
negative effect on the likelihood of abnormal accruals. The coefficients on FirmExpertise are nega-
tive for both AEM+ and AEM– (–0.072, –0.122) but only the coefficient for the AEM– group is
significant (p = 0.05). The test of the joint effect for both AEM groups is not significant either and
while the effect of FirmExpertise is slightly larger for the AEM– group, the difference between the
two coefficients is not significant (p = 0.29).
7
Thus, knowledge of the company’s operations and of
its executive directors acquired though experience as a member of the board seems to be effective in
constraining aggressive earnings management and complacency does not seem to offset the value of
firm-specific knowledge as tenure increases.
Taken as a whole, these results suggest that the SOX financial expertise requirement is justified
and that the expertise of audit committee members is an important determinant of its effectiveness, as
predicted in H1.
Independence
We examine two levels of committee independence to determine whether a majority of nonrelated
outside members is sufficient to ensure efficient monitoring. The effect of 100%Ind is significant (p
= 0.02) while the effect of 50-99%Ind is not (p = 0.45), which suggests that 100 percent is the critical
threshold. The coefficients for 100%Ind are not significantly different (p = 0.28) between positive
and negative AEM, with significantly negative parameters of –0.989 (p = 0.01) and –0.724 (p
= 0.02), respectively. Neither of the parameters for 50-99%Ind is significant at the 0.10 level. Thus,
it appears that Klein’s (2002) conclusion that a majority of independent directors on the audit
committee is sufficient to curtail earnings management does not hold for our sample of smaller firms.
Our results are consistent with the requirement of SOX that 100 percent outside membership is
necessary for efficient monitoring.
The ratio of stock options that can be exercised in the short run relative to the total of options
and stocks held by nonrelated outside committee members (StockOptions) increases the probability
that a firm will be in either the AEM+ or the AEM– groups. The coefficients for AEM+ and AEM–
are positive (1.748 and 2.196) and significant at the 0.03 and 0.00 levels, respectively, which
suggests that, as predicted, stock options may reduce directors’ monitoring of earnings management
to increase either current earnings (positive earnings management) or those of future years (negative
earnings management). These results seem to support the U.K. Combined Code’s (FRC 2003)
provision that directors’ remuneration should not include stock options.
These results on the importance of audit committee independence not only support H2 and are
consistent with those of previous studies (Klein 2002; Wright 1996), but they also provide a clearer
picture of the effect of independence on earnings management. It seems that, consistent with the
SOX requirements, a majority of outside members is not sufficient to decrease the likelihood of
aggressive earnings management and that 100 percent is the critical threshold and that participation
of committee members to stock option schemes decreases their monitoring effectiveness by aligning
their interests with those of management rather than those of shareholders.
7
To examine the potential negative effect of long tenure, we replace FirmExpertise with a dichotomous variable that takes
the value of 1 if tenure is longer than 5 years, and 0 otherwise. The results (not shown in a table) still indicate a
significantly negative effect for AEM+ and AEM– (–0.955 and –0.877, p < 0.01) when tenure is larger than five years.
30 Bédard, Chtourou, and Courteau
Auditing: A Journal of Practice & Theory, September 2004
Activity
A clear indication in the proxy statement about the responsibility of the audit committee in the
financial reporting and audit processes (Mandate) constitutes our first measure of committee activ-
ity. The regression coefficients on Mandate are negative and significant both for the AEM+ (–2.352,
p < 0.00) and the AEM– groups (–1.065, p = 0.06) and the effect is significantly larger for AEM+
than for AEM– firms (p = 0.02). The presence of a clear mandate seems to provide the audit
committee with the necessary authority to reduce the probability of aggressive earnings manage-
ment, which is consistent with the BRC’s assertion and with Kalbers and Fogarty’s (1993) survey
findings.
The univariate tests (Table 3, Panel B) indicate that audit committees of LEM firms meet
significantly more often than those of AEM firms. However, when other factors are taken into
consideration the frequency of meetings does not seem to affect the probability of AEM, as can be
seen from the coefficients for Meetings in Table 4, which are both insignificant.
8
Our last measure of committee activity, the presence of at least three members (Members>2) has
no significant effect on the likelihood of aggressive earnings management (p = 0.54). Thus, given the
other characteristics of the committee, it might be able to ensure appropriate monitoring even if it is
composed of only two members. This suggests that what matters is that all its members be nonrelated
outsiders and have the necessary expertise.
Overall, H3 is not supported: the level of activity of audit committees does not seem to affect the
level of earnings management as strongly as their expertise or their independence. Only the presence
of a clear mandate defining the responsibilities of the audit committee reduces the likelihood of
earnings management, which is consistent with the SOX definition of the audit committee’s over-
sight mandate.
Comparison between Positive and Negative AEM
We separate income-increasing and income-decreasing abnormal accruals in our sample be-
cause accruals can be used either to conceal poor performance or to save current earnings for
possible use in the future. Whether audit committees constrain either or both types of abnormal
accruals has not been examined in the past. To address this question, we first compare the AEM– and
the AEM+ firms by means of a logit regression model where the dependent variable that equals 1 for
AEM+ firms and 0 for AEM– firms. None of the coefficients (not reported in a table) on expertise,
independence, and activity variables is significant at the 0.10 level except for Mandate, which is
significant at the 0.05 level. This result suggests that the audit committee characteristics are very
similar whether the aggressive earnings management is income-increasing or income-decreasing and
that large negative abnormal accruals are not necessarily related to conservative accounting choices
(Watts 2003).
The multinomial logit regression reported in Table 4 allows for the effects of audit committee
characteristics to be different between positive and negative earnings management firms. Since the
coefficients for both type of AEM are jointly estimated, the covariance matrix of the full sample is
used when testing whether the effect is larger for positive earnings management. The regression
results indicate that of the five audit committee characteristics that have a significant effect on the
probability of AEM, four have a coefficient that is larger in absolute value for AEM+ than for AEM–
(FinExpertise, GovExpertise, 100%Ind, Mandate) and only the coefficient for StockOptions is smaller.
However, in the last columns of both Table 3 and Table 4, only for Mandate is the difference between
the two groups significant.
8
To examine the possibility that there could be a threshold in the number of meetings for the committee to be efficient, we
replace Meetings with an indicator variable coded 1 if the committee met at least twice in 1996, but the results are similar
to those presented in Table 4.
The Effect of Audit Committee Expertise, Independence, and Activity on Earnings Management 31
Auditing: A Journal of Practice & Theory, September 2004
Overall, these results do not support H4 that the effect of audit committee characteristics is more
important in preventing income-increasing than income-decreasing aggressive earnings manage-
ment. This result may be explained by the fact that for audit committee members the perceived threat
of liability is lower than for auditors or that it is equivalent for both types of earnings management.
Both possibilities would result in a level of monitoring that is similar for positive and negative AEM.
Control Variables
In Table 4, the first eight control variables are included in an effort to ameliorate the measure-
ment errors that may occur in the estimation of abnormal accruals and, consequently, in the classifi-
cation of our sample firms into the low or aggressive earnings management groups.
9
The first column
of the table shows that all these control variables, except Ln(Assets) and GrowthSales have a
significant effect on the classification of firms as AEM or LEM, although not all coefficients are
significant in the multinomial logit regression.
The next variable, IPO, controls for a specific motivation to manage earnings. Consistent with
previous research, it seems that the occurrence of an IPO significantly increases the probability that a
firm will be in one of the AEM groups. What is more surprising is that it is the case for both accruals
groups. One would expect that firms try to increase, not decrease, their earnings before going public.
It is possible that firms considering an IPO start managing earnings at least one year prior to the issue
(Aharony et al. 1993) and that some of our AEM– firms had income-increasing accruals in 1995,
which had to be reversed in 1996, our sample year.
As for the variables controlling for alternative monitoring mechanisms, contrary to some previ-
ous studies (e.g., Becker et al. 1998; Francis et al. 1999), we find that the effect of Big 6 auditors is
not significant (p = 0.43) and that both coefficients for Big6 are positive but nonsignificant even if
the percentage of firms hiring a Big 6 auditor is significantly higher for the LEM group (Panel C,
Table 3). It is possible that an effective audit committee improves the audit program and the auditors’
bargaining power in their negotiation on accounting issues with clients (Ng and Tan 2003) for both
types of auditors. This result is consistent with Myers et al. (2003), who find that auditor type has no
significant association with positive discretionary accruals and a significantly positive association
with negative discretionary accruals.
CONCLUSION
This study examines whether audit committee practices proposed by panels of practitioners
(Joint Committee on Corporate Governance 2001; BRC 1999; Cadbury Committee 1992), account-
ing firms (KPMG 1999; PricewaterhouseCoopers 1999), and regulators (SEC 2000; SOX 2002) are
related to the quality of financial reporting, as measured by the level of income-increasing or
income-decreasing abnormal accruals.
In particular, we study the relationship between the expertise, independence, and level of activ-
ity of audit committees and aggressive earnings management. Our findings generally support the
requirements of the Sarbanes-Oxley Act of 2002 that at least one audit committee member have
financial expertise, that all members be independent, and that the audit committee oversee the
9
As an alternative to the inclusion of control variables in the regression, we apply Kasznik’s (1999) matched-portfolio
technique to adjust abnormal accruals for one possible omitted correlated variable: the absolute value of current earnings.
Adjusted abnormal accruals are grouped by deciles and, for our three original subsamples of 100 firms, we compare the
decile of their adjusted abnormal accruals with their decile in the original sample. Of the original 300 firms, we only keep
those whose adjusted accrual decile is within one decile from the original, shown in Figure 1. The adjusted accruals
sample (87 LEM firms, 100 AEM+, and 94 AEM–) is then used to estimate the logit model of Equation (3) (with the
exclusion of |Earnings| in the control variables). The coefficients on audit committee characteristics that are statistically
significant in Table 4 are still significant at a similar level except for StockOptions, which becomes less significant with a
p-value of 0.07 and FirmExpertise, which becomes more significant with a p-value of 0.06. Moreover, all of the
coefficients that are statistically significant in Table 4 keep the same sign and are of similar magnitude. Thus, most of our
results continue to hold with a smaller sample size (281 firms instead of 300) classified on the basis of adjusted rather
than unadjusted abnormal accruals.
32 Bédard, Chtourou, and Courteau
Auditing: A Journal of Practice & Theory, September 2004
accounting and financial reporting processes as well as the audit of the financial statements. Specifi-
cally, we find that the presence of a financial expert on the audit committee, a committee composed
solely of nonrelated directors, and a clear mandate to oversee the financial reporting processes and
the audit are negatively related with the likelihood of aggressive earnings management. Our results
also indicate a negative association between governance expertise and the likelihood of aggressive
earnings management. Finally, we find support for the Cadbury Committee’s (1992) assertion that
share option schemes for directors reduce their independence in that the percentage of stock options
held by nonrelated outside committee members that can be exercised in the short term is positively
associated with the likelihood of aggressive earnings management. We find no significant associa-
tion between either the size of the committee, the frequency of its meeting, or the firm-specific
expertise of its members with the likelihood of aggressive earnings management. While the effect of
audit committee characteristics is generally larger on income-increasing than on income-decreasing
earnings management, we find the difference to be statistically significant only for the presence of a
clear mandate defining the oversight responsibilities of the committee.
This study is subject to a number of limitations. First, our results demonstrate an association, not
a causal link, between audit committee characteristics and the level of earnings management. Sec-
ond, our measure of earnings management is subject to measurement errors. We have taken precau-
tions to limit the effect of measurement errors in the estimation of abnormal accruals by (1) using a
categorical variable rather than the magnitude of abnormal accruals as the dependent variable, (2)
excluding firms with extreme earnings and cash flows, (3) including in the regression control vari-
ables possibly correlated with omitted variables, and (4) adjusting our estimated abnormal accruals
with a matched-portfolio approach similar to Kasznik’s (1999). Nevertheless, we are unable to
control for all variables potentially correlated with accruals, so there remains a possibility that our
results are caused by a bias in the measurement of abnormal accruals related to some other omitted
variables. Finally, our sample is limited to firms at the extremes of the abnormal accrual distribution.
Our results may not hold for firms with lower levels of earnings management.
While our results generally support the effectiveness of the reforms called for by various groups
and enacted by the SEC and many stock exchanges in reducing earnings management, further
research is needed. First, to find out whether our results hold for firms with lower levels of earnings
management, one could examine a random sample rather than only extreme earnings management
behavior. Klein (2002) examines audit committee independence on a sample of S&P 500 firms, but
other committee characteristics need to be studied on a set of smaller firms. Second, an improved
measure of earnings management such as working capital accruals (Dechow and Dichev 2002) could
help refine the findings. Third, while our results show that the voluntary adoption of the best
practices might improve the effectiveness of audit committees, it would be interesting to examine
whether mandated changes imposed by stock exchanges in 1999 have improved the effectiveness of
the committee or resulted only in a symbolic display of conformity (Kalbers and Fogarty 1998).
Fourth, the idea of an asymmetric loss function for the audit committee members could be examined
further. Finally, this study only provides evidence of a correlation between governance structures and
financial reporting quality, but we have very little understanding of the processes through which the
audit committee affects financial reporting quality. Future research should open the “black box” and
examine these processes.
REFERENCES
Abbott, L. J., S. Parker, and G. F. Peters. 2004. Audit committee characteristics and restatements: A study of the
efficacy of certain Blue Ribbon Committee recommendations. Auditing: A Journal of Practice & Theory
23 (March): 69–87.
The Effect of Audit Committee Expertise, Independence, and Activity on Earnings Management 33
Auditing: A Journal of Practice & Theory, September 2004
Aharony, J., C-J., Lin, and M. P. Loeb. 1993. Initial public offerings, accounting choice, and earnings manage-
ment. Contemporary Accounting Research 10 (Fall): 61–81.
Antle, R., and B. Nalebuff. 1991. Conservatism and auditor-client negotiations. Journal of Accounting Re-
search 29 (Supplement): 31–54.
Archambeault, D., and T. DeZoort. 2001. Auditor opinion shopping and the audit committee: An analysis of
suspicious auditor switches. International Journal of Auditing 5 (March): 33–52.
Arthur Andersen. 1998. Global Best Practices for Audit Committees. Chicago, IL: Arthur Andersen.
Beasley, M. S. 1996. An empirical analysis of the relation between the board of director composition and
financial statement fraud. The Accounting Review 71 (October): 433–465.
Becker, C., M. DeFond, J. Jiambalvo, and K. R. Subramanyam. 1998. The effect of audit on the quality of
earnings management. Contemporary Accounting Research 15 (Spring): 1–24.
Blue Ribbon Committee (BRC). 1999. Report and Recommendations of the Blue Ribbon Committee on
Improving the Effectiveness of Corporate Audit Committees. New York, NY: New York Stock Exchange
and National Association of Securities Dealers. Available at: .
Braun, K. W. 2001. The disposition of audit-detected misstatements: An examination of risk and reward factors
and aggregations effects. Contemporary Accounting Research 18 (Spring): 71–99.
Cadbury Committee. 1992. Report of the Committee on the Financial Aspects of Corporate Governance.
London, U.K.: Gee.
Cahan, S. 1992. The effect of antitrust investigations on discretionary accruals: A refined test of the political
cost hypothesis. The Accounting Review 67 (January): 77–95.
Canadian Institute of Chartered Accountants (CICA). 1981. Audit Committees: A Research Study. Toronto,
Canada: CICA.
Dechow, P. M, R. G. Sloan, and A. P. Sweeney. 1995. Detecting earnings management. The Accounting Review
70 (April): 193–225.
———, and I. D. Dichev. 2002. The quality of accruals and earnings: The role of accrual estimation errors. The
Accounting Review 77 (Supplement): 35–59.
DeFond, M. L., and J. Jiambalvo. 1994. Debt covenant violation and manipulations of accruals. Journal of
Accounting and Economics 17 (January): 145–176.
———, and C. W. Park. 1997. Smoothing income in anticipation of future earnings. Journal of Accounting
and Economics 23 (July): 145–176.
DeZoort, F. T., and S. Salterio. 2001. The effects of corporate governance experience and financial reporting
and audit knowledge on audit committee members’ judgments. Auditing: A Journal of Practice &
Theory 21 (September): 31–48.
Fama, E. F., and M. C. Jensen. 1983. The separation of ownership and control. The Journal of Law and
Economics 26 (June): 301–325.
Financial Reporting Council (FRC). 2003. Combined Code on Corporate Governance. London, U.K.: FRC.
Available at: />Francis, J. R., and J. Krishnan. 1999. Accounting accruals and auditor reporting conservatism. Contemporary
Accounting Research 16 (Spring): 135–166.
———, E. L. Maydew, and H. C. Sparks. 1999. The role of Big 6 auditors in the credible reporting of accruals.
Auditing: A Journal of Practice & Theory 18 (Fall): 17–34.
Gerety, M., and K. Lehn. 1997. The causes and consequences of financial fraud. Managerial and Decision
Economics 18 (November/December): 587–599.
Hackman, J. R. 1990. Groups that Work. San Francisco, CA: Jossey-Bass.
Healy P. M., and J. M. Wahlen. 1999. A review of the earnings management literature and its implications for
standard setting. Accounting Horizons 13 (December): 365–383.
Herdman, R. K. 2002. Making audit committees more effective. Speech by SEC staff, Tulane Corporate Law
Institute, New Orleans, March 7. Available at: />Huddart, S., and M. Lang. 1996. Employee stock option exercises an empirical analysis. Journal of Accounting
and Economics 21 (February): 5–43.
Jeter, D. C., and L. Shivakumar. 1999. Cross-sectional estimation of abnormal accruals using quarterly and
annual data: Effectiveness in detecting earnings management. Accounting and Business Research 29:
299–319.
34 Bédard, Chtourou, and Courteau
Auditing: A Journal of Practice & Theory, September 2004
Joint Committee on Corporate Governance. 2001. Beyond Compliance: Building a Governance Culture.
Interim Report of the Joint Committee on Corporate Governance. Toronto, Canada: CICA. Available at:
/>Governance_Eng_Nov26.pdf.
Jones, J. 1991. Earnings management during import relief investigations. Journal of Accounting Research 29
(Autumn): 193–228.
Kalbers, L.P., and T. J. Fogarty. 1993. Audit committee effectiveness: An empirical investigation of the
contribution of power. Auditing: A Journal of Practice & Theory 12 (Spring): 24–49.
———, and ———. 1998. Organization and economic explanations of audit committee oversight. Journal of
Managerial Issues 10 (Summer): 129–150.
Kasznik, R. 1999. On the association between voluntary disclosure and earnings management. Journal of
Accounting Research 30 (Spring): 57–81.
Key, K. G. 1997. Political cost incentives for earnings management in the cable television industry. Journal of
Accounting and Economics 23 (November): 309–337.
Klein, A. 2002. Audit committee, board of director characteristics, and earnings management. Journal of
Accounting and Economics 33: 375–400.
KPMG. 1999. Shaping the Audit Committee Agenda. Montvale, NJ: KPMG LLP.
Kosnik, R. D. 1987. Greenmail: A study of board performance in corporate governance. Administrative Science
Quarterly 32 (June): 163–185.
Kothari, S. P., A. J. Leone, and C. E. Wasley. Matched discretionary accrual measures. Journal of Accounting
and Economics. Forthcoming.
Levitt, A. 1998. The numbers game. Remarks delivered at the NYU Center for Law and Business, New York,
NY, September 28.
McDaniels, L., R. D. Martin, and L. A. Maines. 2002. Evaluating financial reporting quality: The effects of
financial expertise vs. financial literacy. The Accounting Review 77 (Supplement): 139–167.
McMullen, D. A., and K. Raghunandan. 1996. Enhancing audit committee effectiveness. Journal of Accoun-
tancy 182 (August): 79–81.
Menon, K., and J. D. Williams. 1994. The use of audit committees for monitoring. Journal of Accounting and
Public Policy 13 (Summer): 121–139.
Milgrom, P., and J. Roberts. 1992. Economics, Organizations, and Management. Englewood Cliffs, NJ:
Prentice Hall.
Morck, R., A. Shleifer, and R. W. Vishny. 1988. Management ownership and market valuation: An empirical
analysis. Journal of Financial Economics 20 (January/March): 293–315.
Myers, J. N., L. A. Myers, and T. C. Omer. 2003. Exploring the term of the auditor-client relationship and the
quality of earnings: A case for mandatory auditor rotation? The Accounting Review 78 (July): 779–799.
National Association of Corporate Directors (NACD). 2000. Report of the NACD Blue Ribbon Commission on
Audit Committees: A Practical Guide. Washington, D.C.: The National Association of Corporate Direc-
tors and The Center for Board Leadership.
National Commission on Fraudulent Financial Reporting (NCFFR). 1987. Report of the Commission on
Fraudulent Financial Reporting. Washington, D.C.: Government Printing Office.
Nelson, M. W., J. A. Elliott, and R. L. Tarpley. 2002. Evidence from auditors about managers, and auditors’
earnings management decisions. The Accounting Review 77 (Supplement): 175–202.
Ng, T. B-P., and H-T. Tan. 2003. Effects of authoritative guidance availability and audit committee effective-
ness on auditors’ judgments in an auditor-client negotiation context. The Accounting Review 78 (July):
801–818.
Ontario Securities Commission (OSC). 2003. Proposed Multilateral Instrument 52-110 Audit Committees.
Toronto, Canada: OSC.
Perry , S. E., and T. H. Williams. 1994. Earnings management preceding management buyout offers. Journal of
Accounting and Economics 18 (September): 157–179.
PricewaterhouseCoopers. 1999. Audit Committees: Good Practices for Meeting Market Expectations. New
York, NY: PricewaterhouseCoopers.
Safdar, I. 2003. Executive stock option exercise, earnings management, and stock returns. Working paper,
University of Rochester. New York, NY.
The Effect of Audit Committee Expertise, Independence, and Activity on Earnings Management 35
Auditing: A Journal of Practice & Theory, September 2004
Schipper, K. 1989. Commentary: Earnings management. Accounting Horizons 3 (December): 91 –102.
Securities and Exchange Commission (SEC). 2000. Proposed Rule 34-41987. Washington, D.C.: SEC.
———. 2003a. SEC, Plaintiff, v. KPMG LLP, Joseph T. Boyle, Michael A. Conway, Anthony P. Dolanski and
Ronald A. Safran, Defendants. Civil Action No. 03-CV-0671(DLC).
———. 2003b. Final Rule: Disclosure Required by Sections 406 and 407 of the Sarbanes-Oxley Act of 2002.
Available at: />Steiner, I. D. 1972. Group Process and Productivity. New York, NY: Academic Press.
Subramanyam, K. R. 1996. The pricing of discretionary accruals. Journal of Accounting and Economics 22
(August/December): 249–281.
Teoh, S. H., L. Welch, and T. J. Wong. 1998. Earnings management and the underperformance of initial public
offerings. Journal of Finance 53 (December): 1935–1974.
U.S. House of Representatives, Committee on Financial Services. 2002. Sarbanes-Oxley Act of 2002. Public
Law No. 107-204. Washington, D.C.: Government Printing Office.
Verschoor, C. C. 1993. Benchmarking the audit committee. Journal of Accountancy 176 (September): 59–64.
Watts, R. L. 2003. Conservatism in accounting Part I: Explanations and implications. Accounting Horizons 17
(September): 207–221.
Who Owns Whom. 1996. London, U.K.: O. W. Roskill.
Wolnizer, P. W. 1995. Are audit committees red herrings? Abacus 31 (March): 45–66.
Wright, D. W. 1996. Evidence on the relation between corporate governance characteristics and the quality of
financial reporting. Working paper, University of Michigan.