labelle et al - 2010 - ethics, diversity management, and financial reporting quality
Bạn đang xem bản rút gọn của tài liệu. Xem và tải ngay bản đầy đủ của tài liệu tại đây (302.02 KB, 19 trang )
Ethics, Diversity Management,
and Financial Reporting Quality
Re
´
al Labelle
Rim Makni Gargouri
Claude Francoeur
ABSTRACT. This article proposes and empirically tests
a theoretical framework incorporating Reidenbach and
Robin’s (J Bus Ethics 10(4):273–284, 1991) conceptual
model of corporate moral development. The framework
is used to examine the relation between governance and
business ethics, as proxied by diversity management
(DM), and financial reporting quality, as proxied by the
magnitude of earnings management (EM). The level of
DM and governance quality are measured in accordance
with the ratings of Jantzi Research (JR), a leading pro-
vider of social and governance research for institutional
investors. This DM score is part of an index developed by
JR that investment managers use to integrate DM criteria
into their investment decisions. As expected, a negative
relation between corporate DM development and
financial reporting quality is found while controlling for
other factors known in the literatures on governance and
accounting choices to affect earnings quality. Despite
some caveats presented in conclusion, this study con-
tributes to the ethics, governance, and financial reporting
literatures by studying the dynamics between governance
and ethics in the prevention of EM.
KEY WORDS: ethics, diversity, diversity management,
governance, financial reporting quality, earnings man-
agement, earnings quality
Introduction
As accounting is closely regulated, the issue of
financial reporting quality (FRQ) is often addressed
as a matter of compliance to various governance
regulations rather than ethics. This legal oversight
perspective prevails as business ethics does not appear
to be sufficiently developed to prevent managers
from manipulating the information they provide to
various stakeholders about their own performance.
1
However, despite this emphasis on compliance,
FRQ also presupposes unwritten rules of ethical
behavior. Governance complements business ethics.
In other words, if managers were expected to behave
in an ethical manner, governance would be less
relevant
2
and, in the limit, ethics could substitute
for governance. These ‘‘legalistic’’ and ‘‘ethical’’
perspectives correspond to distinct stages in the
conceptual model of corporate moral development
(CMD) proposed by Reidenbach and Robin (1991).
This theory is inspired by the study of Kolhlberg
(1984) on individual moral development, and Piaget
(1932/1962) on child development. The objective of
this article is to use the theory of CMD to study the
dynamics between governance and ethics in the
prevention of earnings management (EM), a proxy
for FRQ.
To date, relatively few studies have examined the
presumed relationship between FRQ and board of
directors’ characteristics other than the ones com-
plying with generally accepted governance principles
as reviewed in He et al. (2009).
3
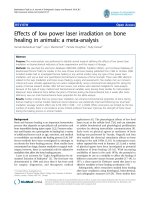
The objective of
this article is to propose and test a theory-based
framework (Fig. 1) where diversity management
(DM) is presented as an ethical complement to
statutory governance aimed at improving FRQ and
ultimately at creating value. Rather than concentrate
on the concept of independence or diversity of
financial interests promulgated in statutory gover-
nance, diversity of knowledge, competence, and
organization’s values are also considered. We use the
Canadian Social Investment Database (CSID) com-
piled by Jantzi Research (JR) on both DM and
governance corporate policies to proxy for the firms’
propensity to respectively implement and respect
such stakeholder- and shareholder-oriented policies.
FRQ is appraised by the firms’ propensity to more
or less manage earnings. Other factors known to be
Journal of Business Ethics (2010) 93:335–353 Ó Springer 2009
DOI 10.1007/s10551-009-0225-7
associated with the quality of earnings in various
areas of the accounting choices literature are also
controlled for.
Governance comprises the set of principles or rules
aimed at improving the accuracy and reliability of
corporate disclosures with which firms have to
comply to insure investors’ protection. Reidenbach
and Robin
4
(1991) argue that an ethical approach
mainly based on rule compliance is at the lower level
of CMD. They propose five stages of organizational
moral development including the legalistic (stage 2),
the responsive (stage 3), and the emergent ethical
(stage 4) organization. In this study, a firm which
adopts a DM policy thus showing concern for other
corporate stakeholders than owners (stage 3 in R &
R, pp. 278, 282) understands the value of not acting
solely on a legal basis (stage 2 in R & R, pp. 276,
282). ‘‘Diversity management is a voluntary organi-
zational program designed to create greater inclusion
of all individuals into informal social networks and
formal company programs’’ (Gilbert et al., 1999,p.
61). In order to reach R & R’s fourth stage of CMD,
i.e., the emerging ethical organization, top manage-
ment values must become organizational values and
be integrated in the organizational culture.
Our research design is aimed at examining whe-
ther the degree of moral or ethical development of a
corporation is related to the quality of its financial
reporting. We do this by isolating the marginal effect
of the stakeholder-oriented policy of promoting
diversity and employment equity from the gover-
nance-presumed effect on FRQ as proxied by EM.
The diversity of boards, other than the one re-
quired in governance codes to insure that the
financial interests of board members are aligned with
shareholders rather than managers, is also starting to
permeate governance regulation around the world.
Many propositions for governance reforms have
explicitly emphasized the importance of diversity in
the boardroom (Adams and Ferreira, 2008). In Great
Britain, the Higgs report (Higgs, 2003), commis-
sioned by the British Department of Trade and Industry,
maintains that diversity can improve board efficiency.
Diversity of boards has also attracted the interest
of institutional investors for several years. For in-
stance, according to Carter et al. (2003), the Teachers
Insurance and Annuity Association-College Retirement
Equities Fund has adopted a policy statement on cor-
porate governance (CG), which stipulates that the
board must be made up of qualified individuals that
Fig. 1. Ethics, diversity management, and financial reporting quality.
336 Re
´
al Labelle et al.
reflect a diversity of experience, gender, race, and
age (TIAA-CREF, 1997). TIAA uses diversity as an
investment criterion and considers this board char-
acteristic as fundamental in limiting executives’ dis-
cretionary behavior (Carter et al., 2003).
Despite the presumed role of ethics or CMD as a
complement to governance regulation in controlling
opportunistic EM behavior, there is a near vacuum
of empirical literature on this subject. This is most
likely due to the fact that business ethics is more
difficult to observe and measure than compliance
with governance regulation. We propose to use DM
as defined above to proxy for the level of business
ethics or CMD. To our knowledge, one exploratory
(Krishnan and Parsons, 2008) and two unpublished
studies (Francis et al., 2009; Gul et al., 2007) have
started to test the link between gender diversity as
measured by the proportion of women on boards
and FRQ. We contend that the concept of DM is
much larger than gender diversity which may be
closer to affirmative action (Gilbert et al., 1999) than
to business ethics. Again, because gender diversity is
easier to observe than DM, there is a growing lit-
erature investigating the impact of gender on various
corporate decisions such as capital structure decisions
(Huang and Kisgen, 2008), merger and acquisition
(Levi et al., 2008), and going public (Mohan and
Chen, 2004).
In order to examine whether the degree to which
firms, instead of solely relying on compliance, also
stress ethics and diversity in the workplace have
better FRQ, we use data from the CSID compiled
by JR, a leading provider of research on governance
and social research for institutional investors. The
CSID score for CG measures compliance with
governance regulations. The CSID score for DM
incorporates several aspects of diversity in addition to
gender diversity on the board which was the sole
aspect examined in previous research. Our sample is
composed of all the companies appraised by JR in
2004 and 2005. As hypothesized, our findings show
a significant negative association between DM, our
proxy for CMD, and EM, our proxy for FRQ.
There is no statistically significant relation between
CG and FRQ. We interpret these results as con-
firming that FRQ is related to a higher level of
CMD. Indeed, the degree of implementation and
respect of an ethical stakeholder-oriented policy
such as the promotion of diversity on the board and
among management and employees appears to en-
hance earnings quality. This is a significant result as
earnings quality is commonly used as an important
governance tool in measuring management’s trans-
parency and performance.
The remainder of the article is organized as fol-
lows. The next section presents the theoretical
framework of the study followed by a review of the
literature in ‘‘Review of empirical literature’’ sec-
tion. ‘‘Model development, data collection, and
variable measurement’’ section describes the meth-
odology and empirical models used. Results are
presented and discussed in ‘‘Analysis and interpre-
tation of results’’ section. The last section presents
the conclusions and caveats and proposes some
avenues for future research.
Theoretical framework
Figure 1 proposes a theory-based framework linking
ethics or CMD and diversity in governance with the
prevention of EM and ultimately value creation.
Governance is presented as both advisory (left-hand
side) and fiduciary (right-hand side) in nature. Both
roles may affect or be affected by business ethics or
CMD in a different manner.
From the fiduciary perspective, qualified directors
have to be independent and even specialists in
monitoring, as per the stipulation of the current
regulation and generally accepted governance prin-
ciples concerning the composition of the board and
its audit committee.
5
In theory and in corporate law,
primacy is given to shareholders’ interests. Agency
theory, the main theory providing explanations for
governance, predicts management interests are dif-
ferent and even in conflict with those of share-
holders. Thus, the emphasis is on the diversity of
opinions and financial interests of board members.
This kind of diversity is required from them so they
are incited to keep on questioning or monitoring
whether management stays in compliance with
governance regulation and meets its fiduciary duty.
From the advisory perspective of governance (left-
hand side of Fig. 1), board effectiveness requires a
diversity of knowledge, competences, and organiza-
tional values to guide and contribute to organizational
learning and strategic decision making. The emphasis
is on counseling and mentoring management, and not
337Ethics, Diversity Management and Financial Reporting Quality
on the statutory characteristics such as the diversity of
interests or the financial literacy of the directors.
Theories based on resources, competences, and
organizational learning explain the more direct link
with value creation shown in Fig. 1. Although
investors’ protection still matters, under that per-
spective, there is room to develop an organizational
culture or corporate policies which integrate a wider
range of stakeholders instead of having to focus by law
on shareholders. This time, diversity is necessary for
board members to be able to ask knowledgeable
questions to shape the managerial decision-making
process and the organization’s culture. For R & R
(1991), the moral development of a corporation is
determined by the organization’s culture and, in
reciprocal fashion, helps define that culture. In
essence, it is the organization’s culture under the
impetus of top management and advisory gover-
nance, which undergoes moral development.
Nowadays, society is demanding that the eco-
nomic development of corporations be equated with
their moral development. The moral development
of a corporation can be classified according to the
degree to which its social responsibility is recognized
and blended with its economic mission. R & R
(1991) propose a model of CMD comprised of 5
stages based on the following types of behavior.
The first and the lowest stage of CMD is the
‘‘amoral organization’’ with no set of value other
than greed. For this kind of organization, gover-
nance is just another set of rules to circumvent. Stage
two is the ‘‘legalistic corporation’’ so named because
of the preoccupation it exhibits for compliance with
the letter of the law as opposed to its spirit. The
principal emphasis is still on profitability, but the
difference between stage 2 and 1 is that the latter is
concerned with the legality of profits, not necessarily
with their morality. Owners are still the principal
stakeholders. These organizations are followers
and not social leaders. Society can expect, for the
most part, that they adhere to the rules of statutory
governance.
Contrary to their legalistic counterparts in stage 2,
the stage 3 ‘‘responsive corporations’’ begin to develop
cultures that contain values other than productivity
and a sense of legality. Management understands the
value of not acting solely on a legal basis. This is the case
when a firm adopts DM policies thus showing concern
for other corporate stakeholders than owners.
According to Gilbert et al. (1999, p. 61), ‘‘diversity
management is a voluntary organizational program
designed to create greater inclusion of all individuals
into informal social networks and formal company
programs.’’ In order to reach R & R’s fourth stage of
CMD, i.e., ‘‘emerging ethical organization,’’ top
management and board values must become organi-
zational values or part of the organizational culture.
This is the first stage to exhibit an active concern for
ethical outcomes. In R & R’s conceptual model of
CMD, the final stage is the ‘‘ethical organization.’’
According to R & R, it is difficult to find organizations
which have reached this level of development where
ethics is fully integrated in the firm’s mission and
organization’s culture and where there is a balanced
concern for ethical and economic outcomes.
This article examines whether the degree of moral
or ethical development of a corporation is related to
the quality of its financial reporting. In order to
achieve this objective, we have to isolate the mar-
ginal effect of CMD over the governance presumed
effect on FRQ. We use the stakeholder-oriented
policy of promoting diversity and employment
equity to proxy for CMD. In the next section, we
review the empirical literature on diversity and EM.
Review of empirical literature
Despite the presumed role of ethics or CMD as a
complement to governance regulation in controlling
opportunistic EM behavior, there is a near vacuum of
empirical literature on the subject. This may be due
to the fact that business ethics is more difficult to
observe and measure than compliance with gover-
nance regulation as proxied for instance by the per-
centage of unrelated directors. We use DM as defined
above by Gilbert et al. (1999, p. 61) to proxy for the
level of business ethics or CMD. For these authors,
‘‘diversity management (DM) is a voluntary organi-
zational program ….’’ Thus, DM results from a
voluntary management decision which does not de-
pend solely on laws, since sheer compliance to
affirmative action quotas or targets represents only
minimum acceptable standards of behavior. ‘‘Ethical
behavior focused on diversity management takes
knowledge, commitment and work beyond the law’’
338 Re
´
al Labelle et al.
(Gilbert et al., 1999, p. 73). As underlined in our
theoretical framework, corporate DM development
may run parallel to the responsive (R & R’s stage 3)
and emerging ethical (R & R’s stage 3) organizations’
moral development stages.
To our knowledge, one exploratory (Krishnan and
Parsons, 2008) and two unpublished studies (Francis
et al., 2009; Gul et al., 2007) have started to test the
link between a subset of DM, i.e., gender diversity as
measured by the proportion of women on boards,
and FRQ. We contend that the concept of DM is
much larger than gender diversity which may be
closer to affirmative action (Gilbert et al., 1999) than
to business ethics. Conceptually, DM is closely re-
lated to organizational culture and encompasses the
equitable management of several aspects of human
resources including gender, race, ethnicity, age,
personality, and cognitive style. However, as most
studies to date have focused on gender diversity, our
literature review will mostly focus on that partial
view of diversity.
Much attention has been paid to the diversity of
interests between directors and top management and
its indirect effect on performance (Francoeur et al.,
2008; Levi et al., 2008). This study focuses on both
the potential direct and indirect relations between
DM and agency costs where managers may take
advantage of information asymmetry to fiddle with
earnings (right hand side of Fig. 1). The board of
directors generally oversees at least four important
functions (Mallin, 2004; Monks and Minow, 2004).
Managerial control and compliance with laws and
regulations are mostly related to fiduciary governance
(stage 2 of R & R) while questioning, informing, and
advising managers, and ensuring good relations with
the external environment are mostly related to the
advisory role of governance.
Diversified boards can potentially not only improve
their oversight capacity but also the quality of their
decisions (Dallas, 2002) through their enlightened
questions and advices. One of the most significant
governance challenges that managers, administrators,
and shareholders of the modern company face is
establishing an optimal mix within the board of
directors in terms of gender, race, and culture (Carter
et al., 2003). The business case for DM is closely linked
to agency as well as to resource-based theories.
It suggests that a diversified board increases its
independence and activism thus ensuring better
control over managers’ behavior (Carter et al., 2003,
2008). Adams (2008) asserts that women directors
have an impact similar to the one of independent
directors, particularly regarding control over mana-
gerial discretion. Smith et al. (2006) argue that the
heterogeneous makeup of top management is an as-
pect of good CG that helps constrain EM practices.
Boards of directors that include women members are
purportedly better able to improve control and con-
strain opportunistic EM behaviors (Gul et al., 2007).
Furthermore, according to Cohen et al. (1998), Kle-
nke (2003), and Trinidad and Normore (2005), wo-
men employ a more democratic, trust-based
leadership style. They also exhibit greater risk aversion
in financial decision making (Hinz et al., 1997; Powell
and Ansic, 1997; Riley and Chow,
1992; Sunden and
Surette, 1998). Betz et al. (1989), Mason and Mudrack
(1996), and Clikeman et al. (2001) find that women
exhibit higher ethical values in their decisions than
men do.
Earnings may be managed while complying with
the rules, but some manipulations may be unethical
(Bruns and Merchant, 1990; Gaa, 2007). Opportu-
nistic EM is likely to attract meticulous examination
by investors, analysts, and regulators, which increases
the risks of litigation and loss of reputation. Several
studies have shown a strong association between EM
and the risk of litigation (DuCharme et al., 2004;
Heninger, 2001; Kasznik, 1999) and the loss of
corporate reputation (Kaplan and Ravenscroft, 2004;
Hunton et al., 2006). Owing to their more pro-
nounced ethical values and greater risk aversion,
women directors might be more averse to EM and
the above consequences, compared with their male
counterparts (Gul et al., 2007).
Diversity management may thus affect EM in var-
ious ways. Diversified, trust-based as opposed to
compliance- or obedience-oriented management
style implies greater sharing of information among
directors, and between directors, top management,
and employees. This reduction in information asym-
metry putatively improves control over the corporate
financial reporting function thus minimizing oppor-
tunistic EM to camouflage mediocre performance and
expropriate shareholders’ wealth.
Beyond diversity of the board of directors and top
management, DM systems and programs related to
339Ethics, Diversity Management and Financial Reporting Quality
equity and equality in employment are an important
dimension of diversity. Armstrong et al. (2008) posit
that diversity and employment equality management
policy is part of a High Performance Work System,
which improves the quality of work and organiza-
tional productivity. In 2006, the International Labour
Organization (ILO) mentioned that employment
equality and employee diversity are some of the
characteristics of high performance workplaces. In
this context, the employees’ perceptions of their
organization’s values of ethics and equity motivate
them to put forth additional efforts (Lambert, 2000).
The increase in employee diversity is a contem-
porary human resources management strategy whose
objective is to generate a strategic advantage for the
company (Cox, 1991; Thomas, 1991) and a potential
source of organizational efficiency (Miller, 1998).
Effective management of diversity could foster cre-
ativity, innovation, and problem-solving capacity
(Thomas, 1992). DM practices and policies also im-
prove the quality of decision making (Flood et al.,
2005) and reinforce the organizational commitment
of employees (O’Connell and Russel, 2005).
In order to summarize, DM policies purportedly
generate a sense of equity and satisfaction in the
workplace that provides incentives to act in the
company’s interests. In that environment, opportu-
nistic EM behavior posing as a risk to undermine the
success of the organization is likely to be minimized.
Thus, we hypothesize that the level of CMD as
proxied by DM putatively constrains managerial
discretion in EM. We, therefore, expect a negative
relation between DM and EM while controlling for
CG and other FRQ determinants often found to be
relevant in the various areas of the accounting choices
literature.
Model development, data collection,
and variable measurement
In this section, we first present the model and
sample, and then explain why the variables were
chosen and how they are measured. In order to
examine the association between DM, our proxy for
CMD, and the magnitude of EM, our proxy for the
firm’s FRQ, we ran the following panel probit
model using Stata software:
EM
it
¼ a
1
þ a
2
DM
itÀ1
þ a
3
CG
itÀ1
þ a
4
CFP
itÀ1
þ a
5
SIZE
itÀ1
þ a
6
DEBT
itÀ1
þ a
7
EXCOMP
itÀ1
þ a
8
RISK
itÀ1
þ a
9
MBRATIO
itÀ1
þ a
10
BLOCK
itÀ1
þ a
11
IND
i
þ e
1
ð3Þ
where EM = 1 for firms with high absolute discre-
tionary accruals (DA), and 0 for low absolute DA;
DM = JR diversity management score; CG = JR
corporate governance score; CFP = corporate
financial performance; SIZE = natural logarithm of
total assets; DEBT = level of debt; RISK = sys-
tematic risk b of the market model; MBRA-
TIO = market to book ratio; EXCOMP = average
ratio of bonus to total pay for all executives;
BLOCK = cumulative percentage of shares owned
by blockholders (>10%); Industry: GOLD = Gold
and precious minerals; OIL = Oil and gas;
CONS = consumer products; IND = industrial
products; COM = communication and media;
MERCH = merchandizing.
The dependent variable (EM) is measured for the
period 2005–2006, while the explanatory and con-
trol variables are measured for 2004–2005. This is
done to avoid any potential endogeneity problem.
The initial sample consists of all the 160 compa-
nies of the CSID for which DM and CG scores
are compiled by JR. Owing to their particular
accounting standards and rules, 41 firms operating in
the public and financial services sectors are excluded.
An additional 41 firms are excluded due to missing
data on accounting or stock market. The final
sample consists of 78 companies or 156 observations
over 2 years.
Dependent variable – financial reporting quality
We use EM through DA to proxy for FRQ. DA are
estimated using the cross-sectional version of the
Jones model modified by Dechow et al. (1995).
Dechow et al. (1995) eliminated the tendency of the
Jones’ model to incorrectly measure DA when dis-
cretion is exerted on the operating cash flow. They
adjusted the variations in operating cash flow to take
into account the change in accounts receivable dur-
ing the examination period. Jones’ original model
340 Re
´
al Labelle et al.
presumes that managerial discretion is not exerted on
operating cash flow in the estimation period or in the
examination period. In contrast, the modified model
presumes that all variations in credit sales in the
examination period are associated with EM. This
modification is based mainly on the fact that it is
easier to manage earnings by manipulating the rec-
ognition of credit sales than that of cash sales. The
modified version of Jones’ model is therefore ex-
pressed as follows:
TA
t
¼ a
1
1
A
tÀ1
þ a
2
DREV
t
À DREC
t
ðÞ
þ a
3
PPE
t
þ e
it
TA = total accruals = net income (item 75 of the
Stock Guide database) less operating cash flow
(item 110 of the Stock Guide database); A
t-1
=
total assets (item 94 of the Stock Guide database)
at t - 1; DREV = revenues (item 61 of the Stock
Guide database) in year t less revenues in year t - 1
scaled by total assets at t - 1; DREC = net receiv-
ables (item 85 of the Stock Guide database) in year
t less net receivables in year t - 1 scaled by total
assets at t - 1; PPE = gross property plant and
equipment (item 89 of the Stock Guide database)
in year t scaled by total assets at t –1.
All variables are standardized by the amount of
total assets at t - 1 to reduce heteroskedasticity.
Based on the estimated coefficients, we calculate
the nondiscretionary accruals (NDA) of the sample
as follows:
NDA
t
¼
^
a
1
1
A
tÀ1
þ
^
a
2
DREV
t
À DREC
t
ðÞ
þ
^
a
3
PPE
t
where
^
a
1
,
^
a
2
and
^
a
3
are the estimated coefficients
of a
1
, a
2
, and a
3
, respectively.
The DA of the sample are measured by the dif-
ference between the total accruals and the nondis-
cretionary accruals:
DA
t
¼ TA
t
À NDA
t
As proposed by Huddart and Louis (2006), the
propensity of a firm to manage earnings (EM) is
measured by a dichotomous variable that takes the
value of 1 for firms with high absolute DA, and 0 for
low absolute DA firms. We use the absolute value of
accruals as earnings that may be managed upward or
downward depending on the incentives. In order to
distinguish high and low DA firms, the absolute
values of DA are first sorted in decreasing order for
2005 and 2006. Then, for each year, the sample is
divided into two groups of 39 firms whose absolute
values of DA fall on either side of the median. The
group with values higher than the median consists of
companies whose magnitude of EM is high, whereas
the group whose absolute DA values fall below the
median consists of companies exhibiting less EM.
Independent variable of interest – diversity management
As outlined earlier, the concept of DM is harder to
observe and measure than gender diversity which is
the only element of diversity examined in previous
research in relation to EM. We thus use the CSID
compiled by JR
6
for 2004 and 2005. JR is a leading
provider of governance and social, such as DM,
research for institutional investors. JR’s rating of DM
is part of an index that investment managers use to
integrate DM criteria into their investment deci-
sions. As shown in Appendix 1, 75% of the DM
rating on 10 concerns the firms’ stakeholder-ori-
ented policies and efforts to recruit and integrate
minorities and women in the workplace. It includes
the firm’s policy on diversity and employment
equity, the managerial structure and responsibility,
the public reporting on diversity issues, employee
training and communication, recruitment, retention
and promotion programs, parental benefits, and
other diversity initiatives or benefits. The percent-
ages of women on the board of directors and among
senior officers accounts for 12.5% of the total score
each.
Control variables
Other factors in the governance and accounting
choices literatures are known to constitute deterrents
(governance, size, and to a lesser extent ownership
concentration) or incentives for EM, namely, cor-
porate financial performance (CFP), debt and com-
pensation contracts, growth opportunities, and risk.
In order to gauge the indirect advisory and direct
fiduciary role the board of directors might play in
preventing EM (Fig. 1), we first include the quality
341Ethics, Diversity Management and Financial Reporting Quality
of the firm’s governance in the model (Niu, 2006).
For that purpose, we use the CSID CG score
compiled by JR for the years 2004 and 2005. CG is a
composite index, as in the case of DM, measuring
corporate fiduciary governance such as the inde-
pendence of board members from management or
the separation of the chairperson and CEO positions,
the existence of formal CG principles, of a code of
business conduct and concerns about non-voting or
multivoting common shares, excessive compensa-
tion, and stock option plan dilution.
The sign of the relation between the firm’s
ownership structure and its propensity to more or
less manage earnings is uncertain. In governance,
ownership concentration in the hands of one or
more blocks of shareholders (BLOCK) may be seen
as another means of controlling executives’ discre-
tion with regard to opportunistic EM behavior
(Bushee, 1998; Dempsy et al., 1993). On the other
hand, closely held firms may be less concerned with
earnings quality than widely held ones, as their
shareholders can obtain information directly from
the firm (Bushee et al., 2003; Gelb, 2000). There-
fore, we control for the firm’s ownership concen-
tration without qualifying its relation with EM. We
use the Stock Guide database measure, i.e., the
cumulative percentage of shares held by company
directors and other individuals or institutions hold-
ing more than 10% of the share equity. This pro-
portion corresponds to the disclosure requirement
threshold with regard to ownership.
In the voluntary disclosure literature, Clarkson
et al. (1999) and Lang and Lundholm (1993) show
that larger firms are generally more forthcoming
than smaller ones in terms of financial reporting. Size
(SIZE) is measured by the natural logarithm of total
assets.
Guay et al. (1996) distinguish three perspectives
on the relation between performance and managerial
discretionary behaviors affecting accruals. From a
performance perspective, management may use
accruals to reduce earnings (-) to enhance their
ability to reflect the true underlying performance of
the firm. From an opportunism perspective, man-
agement may use accruals to subvert the ability of
earnings to reflect true underlying performance of-
ten but not always to portray performance in a more
favorable way (+). Most empirical evidence indeed
generally indicates that poorly performing firms are
more likely to manage earnings (Burgstahler and
Dichev, 1997; DeAngelo et al., 1994; Mard, 2004).
Finally, from a noise component perspective,
accruals may introduce noise into the performance
signal (?/+). In order to control for CFP, we use
stock market return (STOCKRET). As a sensitivity
analysis, we also use two accounting proxies often
used in previous research to measure performance:
return on assets (ROA) and on shareholders’ equity
(ROE).
From their extensive review of the literature on
accounting choices, Watts and Zimmerman (1986)
also assert that firms use DA to avoid violation of
accounting-based-debt covenant. Consistent with
prior empirical work (e.g., Bowen et al. 2008), we
control for the level of debt. We measure this variable
as the ratio of long-term debt to total assets (DEBT).
Healy (1985), Holthausen et al. (1995) and Gaver et al.
(1995) also identify executive compensation (EX-
COMP) as another contractual motivation for EM. In
this case, earnings could be managed upward to im-
prove an impending bonus, or downward if the
manager believes that the firm is not in a position to
meet the contractual earnings’ target. This is referred
to as the ‘‘big bath’’ hypothesis. While we have to
control for that motivation which is frequently
examined in the accounting choice literature, we do
not specify the direction of the effect of executive
compensation on EM. In order to proxy for com-
pensation, we use the measure introduced by Park and
Shin (2004), namely, the mean ratio (premium/total
compensation) of the five most highly paid managers.
This allows capturing the weight of compensation
rather than simply the existence or not of a com-
pensation plan. Total compensation is the sum of the
salary, premium, present value of stock option plans,
value of restricted share grants, long-term incentive
compensation, and any other annual components of
compensation.
Given the political costs linked to the company’s
risk level, firms with very high risk have a greater
incentive to manage earnings (Zmijewski and Ha-
german, 1981). In fact, firms with higher risks face
more political visibility and use accounting discretion
to reduce the risk perception (Warfield et al., 1995).
We expect a positive association between risk and
EM. Following Warfield et al. (1995) and Riahi-
Belkaoui (2003), this variable (RISK) is measured by
the systematic risk b of the market model.
342 Re
´
al Labelle et al.
We also include the Market to Book ratio
(MBRATIO) to measure growth opportunities.
According to Park and Shin (2004, p. 443), ‘‘it is
easier for fast-growing firms to engage in EM than
slow-growing or stagnant firms because it is generally
harder to see through the business activities of fast-
growing firms.’’
Lastly, we use industries (IND) as dichotomous
variables. As there exists mimetism in accounting
choices within industries, to examine firms’ EM
behavior, we have to control for any differences that
may exist between industries. The breakdown of
observations by industrial sector, as defined by the
Toronto Stock Exchange, is presented in Table I.
Analysis and interpretation of results
This section presents the univariate and multivariate
statistical analyses of the data and their interpretation.
Descriptive statistics and univariate analysis
Table II presents the descriptive statistics of the
continuous independent variables for the total sample
(Part A), for highly manipulative (Part B) and weakly
manipulative firms (Part C). The results of univariate
means comparison tests (Part D) bring to light
significant differences between the two groups of firms.
The DM variable reveals a significant difference
between high and low EM firms. As expected, the
difference in CMD as proxied by DM is in favor of
the firms who are less prone to EM. It is statistically
significant at the 1% level. There is no significant
difference as far as the quality of their fiduciary
governance is concerned.
As for other control variables, differences are not
significant except in the case of firm performance as
measured by stock return (at the 1% level) and
growth opportunities as measured by MBRATIO (at
the 5% level). In the case of firm performance, the
difference is no longer significant when measured in
accounting terms (ROA and ROE). When perfor-
mance is measured in market terms (STOCKRET),
high EM firms exhibit on average a significantly
stronger financial performance (1%) than low EM
ones. As inferred by Guay et al. (1996), in our sample,
management seems to use accruals to reduce earnings
to enhance their ability to reflect the true underlying
performance of the firm. In contrast, high EM firms
have on average more growth opportunities (5%) as
measured by the MBRATIO than do companies that
engage in less EM. This is consistent with Park and
Shin’s (2004) findings about fast-growing firms tak-
ing advantage of greater information asymmetry to
engage in more EM.
There is no significant statistical difference be-
tween the two groups of companies in terms of size,
debt and compensation contracts, risk and existence
of a shareholder block.
Table III presents contingency analyses that
integrates dichotomous variables. The results indi-
cate that the proportion of companies engaged in
EM is significantly higher (lower) in the metals and
minerals, oil and gas (consumer products, industrial
products and communication, and media sectors)
than in other industrial sectors.
TABLE I
Distribution across industries
Industry N %
Metals and minerals (MET) 28 17.9
Gold and precious minerals (GOLD) 20 12.8
Oil and gas (OIL) 30 19.2
Consumer products (CONS) 12 7.7
Industrial products (IND) 34 21.8
Communication and media (COM) 10 6.4
Merchandising (MERCH) 22 14.1
Total 156 100
343Ethics, Diversity Management and Financial Reporting Quality
TABLE II
Descriptive statistics and parametric tests of differences between averages of continuous variables
Variable DM CG STOCKRET SIZE DEBT RISK ROA ROE MBRATIO EXCOMP BLOCK
A – Total sample
Average 3.133 6.623 0.376 14.412 0.189 0.523 0.043 0.101 2.653 0.278 0.216
St. deviation 1.152 1.226 0.604 1.369 0.133 0.531 0.084 0.153 1.469 0.165 0.232
Minimum -0.400 3.300 -0.467 10.861 0.000 -0.434 -0.458 -0.778 0.480 0.000 0.000
Maximum 6.600 9.300 3.724 17.539 0.627 2.613 0.278 0.536 8.370 0.777 0.753
N 156 156 156 156 156 156 156 156 156 156 156
B – High earnings management
Average 2.871 6.773 0.502 14.275 0.172 0.555 0.048 0.118 2.944 0.259 0.225
St. deviation 1.152 1.138 0.661 1.587 0.136 0.586 0.099 0.179 1.733 0.166 0.247
Minimum -0.400 4.100 -0.300 10.861 0.000 -0.434 -0.458 -0.778 0.920 0.000 0.000
Maximum 6.200 9.300 3.724 17.539 0.627 2.613 0.205 0.536 8.370 0.777 0.753
N 78 78 78 78 78 78 78 78 78 78 78
C – Low earnings management
Average 3.395 6.473 0.250 14.549 0.206 0.491 0.038 0.083 2.363 0.296 0.207
St. deviation 1.098 1.299 0.516 1.104 0.129 0.471 0.065 0.119 1.082 0.163 0.218
Minimum 1.700 3.300 -0.467 12.257 0.000 -0.406 -0.233 -0.423 0.480 0.000 0.000
Maximum 6.600 8.900 3.495 17.003 0.565 1.535 0.278 0.434 5.710 0.768 0.693
N 78 78 78 78 78 78 78 78 78 78 78
D – Average difference
t 2.910 -1.534 -2.656 1.254 1.600 -0.754 -0.779 -1.430 -2.510 1.385 -0.479
Probability 0.0041*** 0.127 0.0087*** 0.212 0.112 0.452 0.437 0.155 0.0131** 0.168 0.633
DM diversity management score, CG corporate governance score, STOCKRET stock return, SIZE size of firm (total assets), DEBT level of debt, RISK market
risk b, ROA return on assets, ROE return on equity, MBRATIO market to book ratio, EXCOMP weight of bonus (average ratio of bonus to total pay for all
executives), BLOCK ownership percentage of share blockholders.
*** and ** two-tailed significance thresholds at 1 and 5%.
344 Re
´
al Labelle et al.
TABLE III
Contingency tables and v
2
tests of differences between frequencies of binary independent variables
EM * MET
MET Total
01
EM 0 70 8 78
1582078
Total 128 28 156
Pearson v
2
6.2679 Significance level (df = 1) 0.012**
EM * GOLD
GOLD Total
01
EM 0 68 10 78
1681078
Total 136 20 156
Pearson v
2
0.0000 Significance level (df = 1) 1
EM * OIL
OIL Total
01
EM 0 77 1 78
1492978
Total 126 30 156
Pearson v
2
32.3556 Significance level (df = 1) 0.000***
EM * CONS
CONS Total
01
EM 0 69 9 78
175378
Total 144 12 156
Pearson v
2
3.2500 Significance level (df = 1) 0.071*
EM * IND
IND Total
01
EM 0 48 30 78
174478
Total 122 34 156
Pearson v
2
25.4233 Significance level (df = 1) 0.000***
EM * COM
COM Total
01
EM 0 69 9 78
177178
Total 146 10 156
Pearson v
2
6.8384 Significance level (df = 1) 0.009***
EM * MERCH
MERCH Total
01
EM 0 67 11 78
1671178
345Ethics, Diversity Management and Financial Reporting Quality
Table IV shows that the correlation coefficients of
the explanatory variables are not that high for being
used in a multivariate analysis. This finding is con-
firmed by the VIF ratios shown in Table V. Indeed,
all the values are less than 10 which is the conven-
tional threshold.
We note a negative and significant correlation at
the 1% level between the DM score and EM, which
corroborates, a priori, our hypothesis relative to the
negative relation between the level of corporate DM
development and the level of managerial discretion
exercised with regard to EM. Concerning the control
variables, we find a positive and significant correla-
tion at the 1% level between the stock market return
and EM, which is contrary to expectations relative to
poorly performing firms, but may translate firms’
willingness to reflect its true underlying performance.
On the contrary, consistent with previous financial
reporting research, the MBRATIO variable shows a
positive and significant correlation coefficient at the
5% level, suggesting that growing firms are more
likely to manage earnings. Other control variables
show insignificant correlation coefficients.
In the following section, we perform a multi-
variate analysis to take into account the interactions
between these variables.
Multivariate analysis
Table VI presents the results of the multivariate
panel probit models employed to examine whether
there is a relation between DM, our proxy for
CMD, and the magnitude of EM, our proxy for the
firm’s FRQ. As expected in our theoretical frame-
work, there is a negative and significant relation
between DM and the magnitude of EM. It is sig-
nificant at the 5% level when a market measure
of performance (STOCKRET) is used as control
variable (model 3). It remains significant at the 10%
level when using an accounting measure of perfor-
mance (models 1 and 2). All three models show
good explanatory powers with classification rates of
88.21, 87.79, and 88.37% respectively. As market
measures are better proxies than accounting mea-
sures for economic performance, we interpret these
results as corroborating our theoretical framework
and hypothesis, whereby firms exhibiting higher
CMD by promoting diversity and employment
equity at the corporate policy level, in the board-
room and among top management and other
employees complement CG and are thus less likely
to engage in EM.
Concerning the control variables, MBRATIO has
a positive and statistically significant coefficient at the
1% level for model 3, and at 5% for models 1 and 2. As
expected, firms with strong growth opportunities are
more likely to take advantage of greater information
asymmetry and engage in EM practices. Ownership
concentration has a positive and weakly significant
coefficient at the 10% level for all versions of the
model. If we interpret this variable in light of our
framework, it may indicate that the concentration of
equity capital in the hands of blockholders, whether it
consist of individuals, families, or institutions, as is
common in Canada, does not help preventing EM.
Conclusion and caveats
In this article, we propose and test a theoretical
framework incorporating Reidenbach and Robin’s
(1991) conceptual model of CMD to link gover-
nance and business ethics, as proxied by DM, with
FRQ, as proxied by the magnitude of EM. The level
of DM and governance quality are measured in
TABLE III
continued
Total 134 22 156
Pearson v
2
0.0000 Significance level (df = 1) 1
EM earnings management, MET metals and minerals, GOLD gold and precious minerals, OIL oil and gas, CONS
consumer products, IND industrial products, COM communication and media, MERCH merchandizing.
***, **, and * two-tailed significance thresholds at 1, 5, and 10%.
346 Re
´
al Labelle et al.
TABLE IV
Coefficients of correlation between model variables
EM DM CG SIZE DEBT RISK ROA ROE STOCKRET MBRATIO EXCOMP BLOCK
EM 1
DM -0.228*** 1
CG 0.123 0.142* 1
SIZE -0.101 0.497*** 0.279*** 1
DEBT -0.128 0.204** 0.021 0.376*** 1
RISK 0.061 -0.270*** -0.200** -0.367*** -0.128 1
ROA 0.063 0.083 0.103 0.223*** 0.018 -0.189** 1
ROE 0.115 0.090 0.128 0.258*** 0.092 -0.263*** 0.960*** 1
STOCKRET 0.209*** -0.216*** -0.047 -0.192** -0.062 0.240*** -0.042 -0.061 1
MBRATIO 0.198** -0.249*** -0.124 -0.350*** -0.166** -0.140* 0.019 0.079 0.068 1
EXCOMP -0.111 0.078 -0.023 0.238*** 0.150* -0.147* 0.137* 0.152* -0.032 -0.140* 1
BLOCK 0.039 0.290*** 0.151* 0.264*** 0.160** -0.131 0.194** 0.187** -0.092 -0.153* -0.094 1
EM earnings management, DM diversity management score, CG corporate governance score, SIZE size of firm (total assets), DEBT level of debt, RISK market
risk b, ROA return on assets, ROE return on equity, STOCKRET stock return, MBRATIO market to book ratio, EXCOMP weight of bonus (average ratio of
bonus to total pay for all executives), BLOCK ownership percentage of share blockholders.
***, **, and * two-tailed significance thresholds at 1, 5, and 10%.
347Ethics, Diversity Management and Financial Reporting Quality
accordance with the ratings of JR, a leading provider
of social and governance research for institutional
investors. This DM score is part of an index devel-
oped by JR that investment managers use to inte-
grate DM criteria into their investment decisions.
Thus, CMD is represented by the firm’s propensity
to implement and respect a stakeholder-oriented
policy such as promoting diversity and employment
equity in their management systems and programs,
in their boardroom, and among senior management
and other employees. We test this relation while
controlling for other factors known in the literatures
on governance and accounting choices to affect
earnings quality. Thus, this study aims to contribute
to the ethics, governance, and financial reporting
literatures.
In this framework, firms that promote a corporate
DM policy which considers all stakeholders instead of
focusing only on shareholders’ interests are deemed
to develop an organizational culture and ethical val-
ues, which lead to greater aversion to EM practices,
and its consequences such as potential litigation and
reputational loss. CMD or corporate DM develop-
ment is deemed to generate a sense of equity and
satisfaction in the workplace that provides incentives
to act in the firm’s interests and avoid opportunistic
EM behavior that would cause risk undermining its
success. The more the firm is engaged in promoting
and implementing diversity in its governance and
management systems as measured by JR’s ratings, the
smaller is the expected firm’s EM magnitude. Find-
ings are in line with this theoretical framework and
support this hypothesis. Thus, it appears that firms
should go beyond affirmative action not only by
increasing diversity in the boardrooms and among
employees, but also by developing corporate DM
policies as part of the organizational culture.
Although this study constitutes a serious attempt
to answer the call for more archival studies of ethics
and diversity by authors such as Gul et al. (2007,
TABLE V
Variance inflation factors (VIF)
Model 1: CFP = ROA Model 2: CFP = ROE Model 3: CFP = STOCKRET
Variable VIF Variable VIF Variable VIF
DM 1.61 DM 1.61 DM 1.59
CG 1.35 CG 1.36 CG 1.36
SIZE 2.23 SIZE 2.23 SIZE 2.24
DEBT 1.54 DEBT 1.49 DEBT 1.45
RISK 1.91 RISK 1.96 RISK 1.76
ROA 1.53 ROE 1.67 STOCKRET 1.27
MBRATIO 1.43 MBRATIO 1.46 MBRATIO 1.41
EXCOMP 1.22 EXCOMP 1.22 EXCOMP 1.22
BLOCK 1.48 BLOCK 1.47 BLOCK 1.47
GOLD 2.98 GOLD 3.01 GOLD 2.36
OIL 2.21 OIL 2.19 OIL 2.13
CONS 1.82 CONS 1.81 CONS 1.89
IND 2.47 IND 2.46 IND 2.56
COM 1.76 COM 1.76 COM 1.83
MERCH 2.07 MERCH 2.05 MERCH 2.15
Average VIF 1.84 Average VIF 1.84 Average VIF 1.78
CFP corporate financial performance, DM diversity management score, CG corporate governance score, SIZE size of
firm (total assets), DEBT level of debt, RISK market risk b, ROA return on assets, ROE return on equity, STOCKRET
stock return, MBRATIO market to book ratio, EXCOMP weight of bonus (average ratio of bonus to total pay for all
executives), BLOCK ownership percentage of share blockholders, GOLD gold and precious minerals, OIL oil and gas,
CONS consumer products, IND industrial products, COM communication and media, MERCH merchandizing.
348 Re
´
al Labelle et al.
p. 5) and Krishnan and Parsons (2008, pp. 67, 74), it
may suffer, similar to other large sample studies, from
the difficulty to operationalize complex and heter-
ogeneous concepts such as business ethics, CMD, or
FRQ. Therefore, the results have to be interpreted
with caution, but we believe future research could
use our framework to examine other proxies for
those concepts. Our own proxy for CMD, Jantzi’s
rating of DM, is representative of the efforts of some
institutional investors to whom JR is providing
information on DM, and of some legislative initia-
tives to increase the involvement of women and
minorities on boards and in top management. It is
also in line with the provisions of the Canadian
Employment Equity Act (EEA) that favors the hiring
and promotion of women and people of minority
groups designated by the Act, that have historically
been victims of discrimination on the Canadian la-
bor market: visible minorities, people with disabili-
ties, and aboriginal peoples (Chagnon et al., 2004).
It also goes beyond compliance with affirmative
action and political correctness by taking into con-
sideration the degree to which DM systems and
programs are part of the organizational culture.
TABLE VI
Population-averaged probit models for determinants of earnings management
Model 1: CFP = ROA Model 2: CFP = ROE Model 3:
CFP = STOCKRET
Coef. Prob. Coef. Prob. Coef. Prob.
C -0.0255 0.989 -0.1914 0.914 0.3207 0.859
DM -0.2334 0.061* -0.2188 0.075* -0.2491 0.046**
CG 0.0242 0.799 0.01479 0.875 0.0170 0.860
SIZE 0.0106 0.926 0.01306 0.908 0.0046 0.968
DEBT 1.1146 0.326 1.29220 0.240 1.0424 0.345
RISK 0.1918 0.488 0.2747 0.327 0.1732 0.509
CFP 0.4881 0.744 0.9777 0.272 -0.149 0.484
MBRATIO 0.2376 0.01** 0.2139 0.019** 0.2427 0.007***
EXCOMP -0.1159 0.876 -0.1216 0.869 -0.1094 0.883
BLOCK 1.0894 0.078* 1.0673 0.081* 1.1633 0.062*
GOLD -0.7123 0.157 -0.4386 0.390 -0.9004 0.035**
OIL 1.3039 0.006*** 1.3988 0.003*** 1.2338 0.008***
CONS -1.7365 0.000*** -1.7193 0.000*** -1.8528 0.000***
IND -1.7974 0.000*** -1.7722 0.000*** -1.9051 0.000***
COM -2.3392 0.000*** -2.3421 0.000*** -2.4730 0.000***
MERCH -0.7476 0.045** -0.6927 0.058* -0.8771 0.025**
N 156 156 156
Wald v
2
74.48 77.11 73.76
Prob > v
2
0.000*** 0.000*** 0.000***
Classification rate (C statistic) 88.21% 87.79% 88.37%
The C statistic represents the area under the Receiver Operating Characteristic (ROC) curve.
CFP corporate financial performance, ROA return on assets, ROE return on equity, STOCKRET stock return, DM
diversity management score, CG corporate governance score, SIZE size of firm (total assets), DEBT level of debt, RISK
market risk b, MBRATIO market to book ratio, EXCOMP weight of bonus (average ratio of bonus to total pay for all
executives), BLOCK ownership percentage of share blockholders, GOLD gold and precious minerals, OIL oil and gas,
CONS consumer products, IND industrial products, COM communication and media, MERCH merchandizing.
***, **, and * two-tailed significance thresholds at 1, 5, and 10%.
349Ethics, Diversity Management and Financial Reporting Quality
Acknowledgments
We acknowledge financial support from the Chair in
Governance and Forensic Accounting of HEC Montreal
and the CGA Professorship in Strategic Financial Informa-
tion. We are grateful to the participants in the 2009
8th International Conference on Corporate Governance
(Florence), to Marinilka B. Kimbro for her discussion at
the 2009 AAA annual meeting (New York) and especially
to the JBE referees for their insightful comments.
Notes
1
The issue of corporate disclosures is at the heart of
CG and the main focus of recent governance reforms.
For instance, the complete name of the Sarbanes-Oxley
Act is ‘‘An Act to protect investors by improving the
accuracy and reliability of corporate disclosures made
pursuant to the securities laws, and for other purposes.’’
2
Except to detect or prevent errors committed in
good faith.
3
On its website, the European Corporate Governance
Institute ( />making available the full texts of close to 200 CG
codes, principles of CG, or CG reforms worldwide.
4
Hereafter R & R
5
See, for instance, the 2001 Saucier report, Canadian
Securities Administrators national instrument 58-101
and national policies 58-201 and 52110.
6
This database was developed in 1992 by Jantzi Re-
search Inc., a firm specializing in the evaluation of cor-
porate social performance of Canadian companies. It
contains the social and environmental profiles of close
to 300 companies that make up the S&P–TSX index.
Now JR is a member of SiRi, a coalition of 11 research
organizations including KLD dedicated to advancing
social investment, />References
Adams, R. B. and D. Ferreira: 2008, ‘Women in the
Boardroom and Their Impact on Governance and
Performance’, Working paper, Available at SSRN:
/>Armstrong, C., P. C. Flood, J. P. Guthrie, W. Liu,
S. Maccurtain and T. Mkamwa: 2008, New Models of
High Performance Work Systems. The Business Case for
Strategic HRM, Partnership and Diversity and Equality
Systems (The Equality Authority and National Centre
for Partnership and Performance).
Betz, M., L. O’Connell and J. M. Shepard: 1989, ‘Gender
Differences in Proclivity for Unethical Behaviour’,
Journal of Business Ethics 8(5), 321–324.
Bowen, R. M., S. Rajgopal and M. Venkatachalam: 2008,
‘Accounting Discretion, Corporate Governance and
Firm Performance’, Contemporary Accounting Research
25(Summer), 351–405.
Appendix 1
See Table VII.
TABLE VII
Diversity management according to Jantzi Research scoring criteria
The case of Alcan Score Weight (%) Weighted score
Policy on diversity/employment equity 2.5 8.9 0.2
Managerial structure and responsibility 0.0 5.4 0.0
Public reporting on diversity issues 0.0 5.4 0.0
Employee training and communication 4.0 7.1 0.3
Recruitment/retention/promotion programs 1.1 10.7 0.1
Maternity/parental benefits 3.5 7.1 0.3
Other diversity initiatives/benefits 2.5 5.4 0.1
Percentage of women on the board 2.2 12.5 0.3
Percentage of women among senior officers 5.0 12.5 0.6
Diversity controversies 10.0 12.5 1.3
Other data 5.0 12.5 0.6
Diversity score (out of 10) 3.8
350 Re
´
al Labelle et al.
Bruns, W. J. Jr. and K. A. Merchant: 1990, ‘The Dan-
gerous Morality of Managing Earnings’, Management
Accounting 72(2), 22–25.
Burgstahler, D. and I. Dichev: 1997, ‘Earnings Manage-
ment to Avoid Decreases and Losses’, Journal of
Accounting and Economics 24, 99–126.
Bushee, B.: 1998, ‘The Influence of Institutional Inves-
tors on Myopic R&D Investment Behaviour’, The
Accounting Review 73(3), 305–333.
Bushee, B. J., D. A. Matsumoto and G. S. Miller: 2003,
‘Open Versus Closed Conference Calls: The Determi-
nants and Effects of Broadening Access to Disclosure’,
Journal of Accounting and Economics 34(1), 149–180.
Carter, D. A., F. D’Souza, B. J. Simkins and W. G.
Simpson: 2008, ‘The Diversity of Corporate Board
Committees and Financial Performance’, Working
paper, available at: />Carter, D. A., B. J. Simkins and W. G. Simpson: 2003,
‘Corporate Governance, Board Diversity and Firm
Value’, The Financial Review 38, 33–53.
Chagnon, R., L. Lamarche and F. Tougas: 2004, ‘La loi
canadienne sur l’e
´
quite
´
en matie
`
re d’emploi et les
femmes: Crier « Victoire » ou crier « Au loup… » ?’,
CJWL/RFD 16, 318–341.
Clarkson, P. M., J. L. Kao and G. D. Richardson: 1999,
‘Evidence that Management Discussion and Analysis
(MD&A) is a Part of a Firm’s Overall Disclosure
Package’, Contemporary Accounting Research 16(1), 111–
134.
Clikeman, P. M., M. A. Geiger and B. T. O’Connell:
2001, ‘Student Perceptions of Earnings Management:
The Effects of National Origin and Gender’, Teaching
Business Ethics 5(4), 389–410.
Cohen, J. R., L. W. Pant and D. J. Sharp: 1998, ‘The
Effect of Gender and Academic Discipline Diversity
on the Ethical Evaluations, Ethical Intentions and
Ethical Orientation of Potential Public Accounting
Recruits’, Accounting Horizons 12(3), 250–270.
Cox, T.: 1991, ‘The Multicultural Organization’, Academy
of Management Executive 5(2), 34–47.
Dallas, L. L.: 2002, ‘The New Managerialism and
Diversity on Corporate Boards of Directors’, Public
Law and Legal Theory Working Paper 38(Spring)
(University of San Diego School of Law), p. 30,
/>DeAngelo, E., H. DeAngelo and Skinner D.: 1994,
‘Accounting Choices of Trouble Companies’, Journal
of Accounting and Economics 17(January), 113–143.
Dechow, P., R. Sloan and A. Sweeney: 1995, ‘Detecting
Earnings Management’, The Accounting Review 70(2),
193–225.
Dempsy, S., H. Hunt and N. Schroeder: 1993, ‘Earnings
Management and Corporate Ownership Structure: An
Examination of Extraordinary Item Reporting’, Journal
of Business, Finance and Accounting 20, 479–500.
DuCharme, L. L., P. H. Malatesta and S. E. Sefcik: 2004,
‘Earnings Management, Stock Issues, and Share-
holder Lawsuits’, Journal of Financial Economics 71(1),
27–49.
Flood, P., J. Guthrie, W. Liu and MacCurtain S.: 2005, High
Performance Work Systems in Ireland: The Economic Case
(National Centre for Partnership and Performance).
Francis, B., I. Hasan, J. C. Park and Q. Wu: 2009,
‘Gender Differences in Financial Reporting Decision-
Making: Evidence from Accounting Conservatism’,
2009 FMA Annual Meeting Program, October 21–24,
Reno, Nevada.
Francoeur, C., R. Labelle and B. Sinclair-Desgagne
´
:
2008, ‘Gender Diversity in Corporate Governance
and Top Management’, Journal of Business Ethics 81(1),
83–95.
Gaa, J.: 2007, ‘The Ethics of Earnings Management: The
Case of Income Smoothing’. Presentation, p. 37.
Gaver, J. J., K. M. Gaver and J. R. Austin: 1995,
‘Additional Evidence on Bonus Plans and Income
Management’, Journal of Accounting and Economics 19,
3–28.
Gelb, D.: 2000, ‘Corporate Signaling with Dividends,
Stock Repurchases, and Accounting Disclosures: An
Empirical Study’, Journal of Accounting, Auditing &
Finance 15(2), 99–120.
Gilbert, J., B. Stead and J. Ivancevich: 1999, ‘Diversity
Management, a New Organisational Paradigm’, Journal
of Business Ethics 21(1), 61–76.
Guay, W. R., S. P. Kothari and R. L. Watts: 1996, ‘A
Market-Based Evaluation of Discretionary Accrual
Models’, Journal of Accounting Research 34(Supplement),
83–105.
Gul, F. A., B. Srinidhi and J. Tsui: 2007, ‘Do female
directors enhance corporate board monitoring? Some
evidence from earnings quality’, Working paper, The
Hong Kong Polytechnic University.
He, L., R. Labelle, C. Piot and D. B. Thornton: 2009,
‘Board Monitoring, Audit Committee Effectiveness,
and Financial Reporting Quality: Review and Syn-
thesis of Empirical Evidence’, Available at SSRN:
/>Healy, P. M.: 1985, ‘The Effect of Bonus Scheme on
Accounting Decisions’, Journal of Accounting and Eco-
nomics 7, 85–107.
Heninger, W. G.: 2001, ‘The Association Between
Auditor Litigation and Abnormal Accruals’, The
Accounting Review 76(1), 111–126.
Higgs, D.: 2003, ‘Review of the role and effectiveness of
non-executive directors’, On-line document from
www.dti.gov.uk/cld/non_execs_review
351Ethics, Diversity Management and Financial Reporting Quality
Hinz, R. P., D. D. McCarthy and J. A. Turner: 1997,
‘Are Women Conservative Investors? Gender Differ-
ences in Participant-Directed Pension Investments’, in
M. G. Gordon, O. S. Mitchell and M. M. Twinney (eds.),
Positioning Pensions for the Twenty-first Century (University
of Pennsylvania Press, Philadelphia), pp. 91–103.
Holthausen, R. W., D. F. Larcker and R. G. Sloan:
1995, ‘Annual Bonus Scheme and the Manipulation
of Earnings’, Journal of Accounting and Economics 19,
29–74.
Huang, J. and D. J. Kisgen: 2008, ‘Gender Differences in
Corporate Financial Decision making’, Unpublished
working paper, Boston College.
Huddart, S. and H. Louis: 2006, ‘Managerial stock sales
and earnings management during the 1990s stock
market bubble’, Unpublished working paper, The
Smeal College of Business, The Pennsylvania State
University.
Hunton, J. E., R. Libby and C. L. Mazza: 2006,
‘Financial Reporting Transparency and Earnings
Management’, The Accounting Review 81(1), 135–158.
International Labour Office: 2006, ‘High Performance
Work Research Project Case Studies’, Available at http://
www.ilo.org/public/english/employment/skills/work
place/case/case_toc.htm
Kaplan, S. E. and S. P. Ravenscroft: 2004, ‘The Repu-
tation Effects of Earnings Management in the Internal
Labor Market’, Business Ethics Quarterly 14(3), 453–
478.
Kasznik, R.: 1999, ‘On the Association Between Vol-
untary Disclosure and Earnings Management’, Journal
of Accounting Research 37(1), 57–81.
Klenke, K.: 2003, ‘Gender Influences in Decision-
Making Processes in Top Management Teams’, Man-
agement Decision 41(10), 1024–1034.
Kohlberg, L.: 1984, The Psychology of Moral Development
(Harper & Row, San Francisco).
Krishnan, G. V. and L. M. Parsons: 2008, ‘Getting to the
Bottom Line: An exploration of Gender and Earnings
Quality’, Journal of Business Ethics 78, 65–76.
Lambert, S. J.: 2000, ‘Added Benefits: The Link Between
Work-Life Benefits and Organisational Citizenship
Behaviour’, Academy of Management Journal 43(5),
801–815.
Lang, M. H. and R. J. Lundholm: 1993, ‘Corporate
Disclosure Policy and Analyst Behavior’, The
Accounting Review 71(4), 467–492.
Levi, M., K. Li and F. Zhang: 2008, ‘Mergers and
Acquisitions: The Role of Gender’, Unpublished
working paper, University of British Columbia.
Mallin, C. A.: 2004, Corporate Governance (Oxford Uni-
versity Press, Oxford, UK).
Mard, Y.: 2004, ‘Les socie
´
te
´
s franc¸aises cote
´
es ge
`
rent-elles
leurs chiffres comptables afin d’e
´
viter les pertes et les
baisses de re
´
sultats’, Comptabilite
´
Contro
ˆ
le Audit 10(2),
73–98.
Mason, E. S. and P. E. Mudrack: 1996, ‘Gender and
Ethical Orientation: A Test of Gender and Occupa-
tional Socialization Theories’, Journal of Business Ethics
15(6), 599–604.
Miller, F. A.: 1998, ‘Strategic Culture Change: The Door
to Achieving High Performance and Inclusion’,
Public
Personnel Management 27(2), 151–160.
Mohan, N. J. and C. R. Chen: 2004, ‘Are IPOs Priced
Differently Based upon Gender?’, Journal of Behavioral
Finance 5, 57–65.
Monks, R. A. G. and N. Minow: 2004, Corporate
Governance, 3rd Edition (Blackwell Publishing Ltd,
Malden, MA).
Niu, F. F.: 2006, ‘Corporate Governance and the Quality
of Accounting Earnings: A Canadian Perspective’,
International Journal of Managerial Finance 2(4), 302–327.
O’Connell, P. and H. Russell: 2005, Equality at Work? –
Workplace Equality Policies, Flexible Working Arrange-
ments and the Quality of Work (The Equality Authority,
Dublin), />105&docID=269
Park, Y. W. and H. H. Shin: 2004, ‘Board Composition
and Earnings Management in Canada’, Journal of Cor-
porate Finance 10, 431–457.
Piaget, J.: 1932/1962, The Moral Judgment of the Child
(Collier, New York).
Powell, M. and D. Ansic: 1997, ‘Gender Differences in
Risk Behaviour in Financial Decision-Making: An
Experimental Analysis’, Journal of Economic Psychology
18(6), 605–628.
Reidenbach, R. E. and D. P. Robin: 1991, ‘A Con-
ceptual Model of Corporate Moral Development’,
Journal of Business Ethics 10(4), 273–284.
Riahi-Belkaoui, A.: 2003, ‘The Impact of Corporate
Social Responsibility on the Informativeness of Earn-
ings and Accounting Choices’, Advances in Environ-
mental Accounting and Management 2, 121–136.
Riley, W. B. and K. V. Chow: 1992, ‘Asset Allocation
and Individual Risk Aversion’, Financial Analyst Journal
48(November/December), 32–37.
Smith, N., V. Smith and M. Verner: 2006, ‘Do Women
in Top Management Affect Firm Performance?
A Panel Study of 2,500 Danish Firms’, International
Journal of Productivity and Performance Management 55(7),
569–593.
Sunden, A. E. and B. J. Surette: 1998, ‘Gender Differ-
ences in the Allocation of Assets in Retirement Savings
Plans’, The American Economic Review 88(2), 207–211.
352 Re
´
al Labelle et al.
Thomas, R. R.: 1991, Beyond Race and Gender: Unleashing
the Power of Your Total Work Force by Managing Diversity
(American Management Association, New York).
Thomas, R.: 1992, ‘Managing Diversity: A Conceptual
Framework’, in S. E. Jackson (ed.), Diversity in the
Workplace: Human Resources Initiatives (Guilford, New
York), pp. 13–35.
TIAA-CREF: 1997, TIAA-CREF policy statement on
corporate governance (New York).
Trinidad, C. and A. H. Normore: 2005, ‘Leadership and
Gender: A Dangerous Liaison?’, Leadership & Organi-
zation Development Journal 26(7), 574–590.
Warfield, T. D., J. J. Wild and K. L. Wild: 1995,
‘Managerial Ownership, Accounting Choices, and
Informativeness of Earnings’, Journal of Accounting and
Economics 20(1), 61–91.
Watts, R. L. and J. L. Zimmerman: 1986, Positive
Accounting Theory (Prentice Hall, Englewood Cliffs).
Zmijewski, M. and R. Hagerman: 1981, ‘An Income
Strategy Approach to the Positive Theory of
Accounting Standard Setting/Choice’, Journal of
Accounting and Economics 3, 129–149.
Re
´
al Labelle and Claude Francoeur
HEC Montreal,
Montreal, QC, Canada
E-mail:
Rim Makni Gargouri
FSEG Sfax,
Sfax, Tunisia
353Ethics, Diversity Management and Financial Reporting Quality