anderson and campbell - 2004 - cg of japanese banks
Bạn đang xem bản rút gọn của tài liệu. Xem và tải ngay bản đầy đủ của tài liệu tại đây (238.58 KB, 28 trang )
Corporate governance of Japanese banks
Christopher W. Anderson
a,
*
, Terry L. Campbell II
b
a
School of Business, University of Kansas, 1300 Sunnyside Avenue, Lawrence, KS 66045, USA
b
College of Business and Economics, University of Delaware, Newark, DE 19716, USA
Received 10 July 2002; accepted 7 October 2002
Abstract
We investigate external and internal corporate governance activity observed at Japanese banks
over 1985–1996. External governance appears to be inactive, and even after the onset of the banking
crisis of the 1990s there are few mergers, failures, and other changes in ownership and control. Prior
to the banking crisis we do not find a relation between bank performance and executive turnover. In
contrast, non-routine turnover of bank presidents is inversely related to both stock returns and
profitability in the 1990s. Consequently, internal governance activity is observable following the
onset of the Japanese banking crisis, a period otherwise characterized by inactive external
governance and regulatory forbearance.
D 2003 Elsevier B.V. All rights reserved.
JEL classification: G21; G34
Keywords: Japanese banks; Banking crisis; Managerial turnover; Corporate governance
1. Introduction
The banking sector plays a prominent role in the Japanese economy. For much of the
post-war period, banks were the predominant source of external financing for Japanese
firms and anchored a governance system characterized by relationships among firms
belonging to keiretsu corporate groups (Aoki et al., 1994). The Japanese financial system
experienced significant changes in the 1980s and 1990s, however. Important changes in
the operating environment of Japanese banks incl ude a shift by large Japanese firms
toward financial markets for external financing, globalization, the collapse of asset prices
in the 1990s, deterioration of banks’ financial health, a subsequent decade of meager
growth, and a decline of the keiretsu syst em (Hoshi and Kashyap, 1999, 2001).
0929-1199/$ - see front matter D 2003 Elsevier B.V. All rights reserved.
doi:10.1016/S0929-1199(03)00029-4
* Corresponding author. Tel.: +1-785-864-7340.
E-mail address: (C.W. Anderson).
www.elsevier.com/locate/econbase
Journal of Corporate Finance 10 (2004) 327–354
The prominence of banks in the Japanese economy and the frequent linking of bank-
sector health to the overall economy suggest that corporate governance of Japanese banks
themselves is an important topic for research. However, in contrast to the many studies of
the implications of Japanese-style corporate governance for non-financial firms, there are
conspicuously few studies that investigate corporate governance of Japanese banks per se.
Consequently, there is little evidence on the extent to which governance of Japanese banks
contributed to, exacerbated, or responded to the banking crisis.
This study investigates governance activity at more than 100 Tokyo Stock Exchange-
listed Japanese banks for the 12-year period 1985–1996. We divide the sample period into
a pre-crisis period characterized by growth, profitability, and positive stock-price perform-
ance and a crisis period characterized by stagnation, poor profitabi lity, and stock-price
depreciation. For both periods we examine ownership structure, control activity, top-
executive turnover, and bank performance.
We first investigate external governance activity, broadly defined to include any material
change in ownership or control. There are few failures and mergers among Japanese banks
during our sample period, even after the onset of the banking crisis. Detailed examination
also reveals rigidity in ownership and control. The marked absence of external governance
activity suggests that governance of Japanese banks must be accomplished by internal
mechanisms. We presume that bank performance is a reliable proxy for executiv e
effectiveness and interpret executive turnover following poor stock returns or profitability
and as eviden ce of active internal governance. We do not detect a relation between turnover
and stock returns, profitability, or asset growth in the pre-crisis years of 1985–1990,
however. This finding could reflect that absolute bank performance, especially when
measured by stock prices, was high during the pre-crisis period, and that relative perform-
ance did not factor into evaluations of top executives. Perhaps bank managers were
evaluated on other criteria during this period, such as non-public performance measures or
the collective performance of firms in the banks’ client networks. A less benign inter-
pretation is that Japanese bank managers did not face performance incentives in the late
1980s when lending decisions exposed banks to risks that subsequently became manifest in
the collapse of asset prices, the recessions, and the bad loan problems of the 1990s.
Incentives for Japanese bank executives appear to sharpen during the crisis perio d of
1991–1996. Specif ically, we find an inverse relation between bank performance and non-
routine presidential turnover, i.e., when a president is replaced yet does not succeed to the
chairmanship. For instance, the observ ed freque ncy of non-routin e presidential turnover
for a bank in the worst quintile of market-adjusted stock return is 7.0%, versus 1.6% for a
bank in the best performance quintile. Similarly, the frequency of non-routine turnover for
a bank in the worst quintile of industry-benchmarked profitability is 15.1% versus about
2.5% for other banks. Performance–turnover relations of this magnitude are commonly
interpreted as economically significant and are comparable to those observed at U.S. banks
and Japanese industrial firms (Barro and Barro, 1990; Kaplan, 1994; Kang and Shivdasani,
1995). In short, our results suggests that Japanese bank executives faced consequences for
poor performance in the 1990s, a period otherwise characterized by inactive external
governance an d regulatory forbearance.
Our investigation contributes to our knowledge of corporate governance in several
ways. First, relative to our understanding of corporate governance of Japanese industrial
C.W. Anderson, T.L. Campbell II / Journal of Corporate Finance 10 (2004) 327–354328
firms we know very little about the governance of Japanese financial institutions,
particularly with respect to the banking crisis of the 1990s. For example, several studies
address whether Japanese banks face so-called ‘‘market discipline’’ and establish that
bank performance and risk are reflected in stock prices even when financial statements
are opaque and regulators follow policies that prop up poorly performing banks (Genay,
1998; Brewer et al., 1999; Yamori, 1999; Bremer and Pettway, 2002). Our study is
important because it suggests that internal mechanisms at Japanese banks provide
performance incentives to executives in the 1990s, a period otherwise characterized by
regulatory forbearance and inactive external governance. On the other hand, Hoshi and
Kashyap (1999) indicate that deregulation, disintermediation, internationalization, dete-
riorating balance sheets, and other characteristics of the Japanese banking sector in the
1990s prom pt a dire need for consolidation and restructuring. Jensen (1993) and Kaplan
(1997) suggest, however, that internal governa nce mechanisms, in general, and perform-
ance–turnover relations of the economic magnitude we docum ent, in particular, may not
be sufficiently powerful to motivate restructuring in response to economic shocks. In
light of our findings, the long delay in restructuring of the Japanese banking sector, along
with its collateral effects on the Japanese economy as a whole, could be viewed as such
a case.
Section 2 discusses how aspects of corporate governance may have played a role in the
Japanese banking crisis and its aftermath. Section 3 presents evidence on ownership and
control of Japanese banks. Section 4 describes data on top executive turnover. Section 5
investigates the relation between bank performance and managerial turnover. Section 6
discusses our results and concludes.
2. The Japanese banking crisis: origins and implications for governance activity
External shocks to an industry provide researchers intriguing opportunities to inves-
tigate the performance and adaptation of corporate governance systems (Kole and Lehn,
1997). We treat the Japanese banking crisis of the early 1990s as such a shock, and we
examine governance acti vity at Japanese banks both prior to and after the onset of the
crisis. Before suggesting implications of the banking crisis for governance activity, it is
first necessary to briefly discuss the origins of the crisis itself.
In response to changes in their operating environment in the 1980s, Japanese banks
altered their lending practices and exposed themselves to risks that subsequently became
manifest in the banking crisis of the 1990s. In particular, globalization of capital markets
and liberalization of Japanese bond markets in the 1980s prompted many prominent
corporations to borrow directly from the capital markets and bypass banks, formerly the
primary suppliers of capital (Anderson and Makhija, 1999; Hoshi and Kashyap, 2001).
Individual savers did not enjoy parallel liberalization that would promote widespread
access to non-bank savings vehicles, and a complex web of regulations that restricted
banks to segmented regions and product lines was not dismant led (Sibbitt, 1998; Hoshi
and Kashyap, 1999). Thus, Japanese banks faced an exodus of prominent borrowers,
retained a captive deposit base, and were rest ricted to traditional markets for bank services.
Confronted by this change in operating environment Japanese banks shifted their lending
C.W. Anderson, T.L. Campbell II / Journal of Corporate Finance 10 (2004) 327–354 329
to risky borrowers and relied heavily on real-estate collateral as security (Hoshi and
Kashyap, 1999).
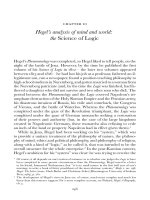
The shift in lending strategies proved disastrous when collateral values collapsed and
recession ensued. Indeed, the Japanese banking crisis is often associated with the collapse
of asset prices in the early 1990s. Fig. 1 shows the evolution of land prices and Japanese
bank-stock prices from 1982 to 1997. Land and bank-stock prices more than tripled from
the mid-1980s to their respective peaks in late 1989 and mid-1990. Land and bank-stock
prices dropped precipitously thereafter to 40% and 30% of peak value, respectively, by the
end of 1997. The drop in asset prices substantially decreased both the collateral values
against which banks had made commercial loans and the value of equity positions held by
banks, eroding their hidden capital reserves. The decline in asset prices, the ensuing
recession, and poor performance by corporate borrow ers are considered the proximate
causes of the banking crisis.
Regulation is often posited as a primary mechanism for governance of financial
institutions, but denial, regulatory forbearance, political gridlock, minimal policy response,
and systemic moral hazard marked the years following the collapse of the ‘‘bubble
economy’’ in Japan (Cargill et al., 2000). The severity of the bad loan problem, estimated
to be three to four times larger than the U.S. savings and loan crisis of the 1980s as a
fraction of GDP (Hoshi and Kashyap, 1999), was ignored or, at best, underestimated.
Regulators coerced healthier banks to support weak banks and mask their problems,
resulting in the so-called convoy system (Wall Street Journal, 1992). Reforms were
Fig. 1. Bank stock prices and land prices in Japan, December 1989 = 100. Sources: PACAP Database for Japan
and Japanese Real Estate Institute.
C.W. Anderson, T.L. Campbell II / Journal of Corporate Finance 10 (2004) 327–354330
delayed as politicians, regulators, and bankers gambled on dramatic recovery of asset
prices and the ov erall economy that did not materialize. Ban k regulatory agencies
appeared understaffed and inexperienced, and in some cases regulators even cooperated
in concealment of non-performing assets or accepted bribes by providing advance notice
of surprise inspections. In short, Prowse’s (1997) characterization of regulatory scrut iny of
banks as an inefficient substitute for other governance mechanisms seems especiall y true
of Japan in the 1990s.
We investigate the extent to which non-regulatory government mechanisms are active
for Japanese banks. First, observation of changes in ownership concentration, shifts in
ownership and control, and an increase in bank mergers and failures would be consistent
with external governance activity. Transfers of ownership and control are frequently
characterized as an effective manner to redeploy assets in response to economic shocks,
especially banking sector shocks (Jensen, 1993; Mitchell and Mulherin, 1996; Berger et
al., 1999). We hypothesize that external governance mechanisms would respond to the
Japanese banking crisis by reallocating ownership and control to efficient monitors and by
motivating managers to restructure and make efficient capital allocation decisions.
In Japan, ho wever, governance occurs largely via internal mechanisms because the
market for corporate control is relatively inactive (Kaplan, 1997). Internal mechanisms
include board oversight of management and the threat of dismissal for ineffectiveness. No
extant study examines the performance–turnover relation for Japanese banks, but prior
research documents that poor performance increases the likelihood of managerial turnover
at U.S. industrial firms (Warner et al., 1988), U.S. banks (Barro and Barro, 1990), and
Japanese industrial firms (Kaplan, 1994, 1997; Kaplan and Minton, 1994; Kang and
Shivdasani, 1995). Presuming that observa ble bank performance is a proxy for the
effectiveness of managers, the likelihood of managerial turnover should be inversely
related to bank performance under the hypothesis of active internal governance. Further-
more, incentives for bank executives might sharpen in the 1990s in response to changes in
operating environment. Hubbard and Palia (1995) and Crawford et al. (1995), for example,
report that managerial incentives for bank executives increase following deregulatory
shocks in the U.S Nevertheless, internal governance at Japanese banks may be ineffective
for several reasons. For instance, boards of directors at banks are composed mostly of
current or former employees and retired regulators, and therefore are not representatives of
outside shareholders. Similarly, most banks hold annual meetings, in which executive
appointments are approved, simultaneously and therefore discourage shareholder input.
In the following sections we investigate observable external and internal governance
activity at Japanese banks. Again, we hypothesize that corporate control activity and
meaningful managerial incentives would be consistent with active governa nce. Further-
more, we investigate whether governance mecha nisms respond to the economic shocks
experienced by Japanese banks following the onset of the banking crisis.
3. Ownership and control of Japanese banks
In this section we investigate external governance of Japanese banks by examining data
on ownership and control. Our analysis indicates indicate that the market for corporate
C.W. Anderson, T.L. Campbell II / Journal of Corporate Finance 10 (2004) 327–354 331
control among Japanese banks is relatively inactive over our entire sample period. Notably
pre-crisis ownership structures of Japanese banks remain entrenched well after the onset of
the banking crisis.
3.1. Data on ownership and control of Japanese banks
Our data are for banks from the First Section of the Tokyo Stock Exchange listed in the
Japan Company Handbook (JCH) from 1985 to 1996. The 110 banks listed in the JCH
during this period include 13 city banks, three long-term credit banks, seven trust banks,
and 87 regional banks. Following conventions in the business press, we group the city
banks, long-term credit banks, and trust banks together as the ‘‘top 23.’’ We identify banks
that cease to be listed in the JCH for reasons of failure or merger. The JCH also reports
shareholdings for the top 10 owners of sample banks. Managerial shareholdings per se are
not ide ntified, and examination of the list of top 10 shareholders reveals that top
executives are among sample banks’ top 10 shareholders in only a small handful of
instances over the sample period. The JCH also reports the total percentage of shares
owned by foreign investors. The JCH volumes published in August are the first to provide
financial statements for the fiscal year ending in the prior March, so data from these
volumes are most likely to correspond to the end of the fiscal year.
Our 1985 to 1996 sample period coincides with the end of what Hoshi and Kashyap
(2001) refer to as the deregulatory period for Japanese banks. We divide our 12-year
period into a pre-crisis period of 1985–1990 and a crisis period of 1991 – 1996. Our
division identifies the fiscal year beginning in April 1990 and ending in March 1991 as the
first crisis year. This division of the sample period coincides with the observed downturn
in real-estate prices but occurs after the initial drop in Japanese bank stock prices. Cargill,
et al. (2000, pp. 42–43) refer to the 1991–1994 period as one of ‘‘denial and forbearance’’
by Japanese bank regulators. They also suggest that 1995 and1996 were characterized by a
‘‘minimal policy response’’ that ‘‘retains elements of the old supervision and regulation
framework’’.
3.2. Mergers and failures of Japanese banks over 1985 – 1996
When mark ets for corporate control are active, economic shocks such as those
experienced by Japanese banks in the late 1980s and early 1990s should prompt an
increase in corporate control activity, in general, and mergers and failures, in particular
(Jensen, 1993; Mitchell and Mulherin, 1996) . We therefore search our sample of banks
listed in the JCH for corporate control events such as mergers and bank failures, but
document few in our sample period. There are three bank mergers in the 1990s: Taiyo
Kobe Bank merged with Mitsui Bank in 1990; Saitama Bank merged with Kyowa Bank
in 1991; and Bank of Tokyo merged with Mitsubishi Bank in 1996. Two regional banks
failed at the end of our sample period: Hyogo Bank in 1995 and Taiheiyo Bank in
1996.
On one hand, the three mergers and two failures we observe over 1991– 1996 contrast
with virtually no mergers or failures in the prior 6-year period. On the other hand,
regulatory changes in Japan’s financial markets in the 1980s and 1990s, the collapse of
C.W. Anderson, T.L. Campbell II / Journal of Corporate Finance 10 (2004) 327–354332
asset prices in the early 1990s, and the subsequent recession did not prompt widespread
merger activity or failure until the late 1990s, after our sample period ends. Finally,
removing incumbent bank executives does not seem to be the motive for the three mergers
in our sample period; in each of the three cases the presidents of the two predecessor banks
immediately became chairman and president of the merged bank.
In contrast to the low level of control activity in Japan, Becher (2000) reports 511
mergers of U.S. banks between 1980 and 1996, involving transactions of more than
US$151 billion in bank equity. Nearly 60% of these U.S. bank mergers, account ing for
70% of the value transacted, occurred in the 1990s. The extensive restructuring activity in
the U.S. banking sector is due to material changes in operating environment caused by
deregulation and other factors (Berger et al., 1999). The absence of a similar response to
the shock of the Japanese banking crisis is inconsistent with an active market for corporate
control.
3.3. Ownership concentration and foreign ownership
Although we observe few mergers and failures, perhaps other changes in ownership and
control occur at Japanese banks during our sample period. For example, theories of
ownership structure predict that heightened uncertainty of a firm’s operating environment
leads to an increase in ownership concentration in order to motivate or facilitate more
intense monitoring of managerial decisions (Demsetz and Lehn, 1985). Table 1 reports
Table 1
Ownership structure at Japanese banks
Year N Mean (median) % of shares held by major holders Herfindahl Foreign
Top holder Top 3 Top 5 Top 10
ratio (%) ownership (%)
1985 87 5.2 (5.0) 13.0 (12.4) 18.8 (17.7) 25.8 (24.6) 1.01 (0.79) 0.4 (0.1)
1986 91 5.1 (5.0) 12.8 (12.3) 18.6 (17.9) 24.1 (22.9) 0.96 (0.76) 0.4 (0.0)
1987 94 5.0 (4.9) 12.4 (12.1) 18.0 (17.0) 23.6 (22.8) 0.90 (0.74) 0.6 (0.1)
1988 99 4.9 (4.8) 12.3 (12.1) 17.9 (17.1) 25.7 (24.2) 0.93 (0.78) 0.4 (0.1)
1989 99 4.9 (4.7) 12.1 (11.7) 17.7 (16.8) 25.5 (24.2) 0.91 (0.76) 0.6 (0.3)
1990 103 4.8 (4.6) 12.0 (11.7) 17.6 (16.9) 25.4 (23.7) 0.89 (0.74) 0.9 (0.6)
1991 102 4.9 (4.7) 12.3 (11.8) 18.0 (17.2) 25.8 (23.8) 0.93 (0.78) 1.0 (0.7)
1992 107 5.0 (4.8) 12.6 (12.2) 18.5 (18.0) 26.0 (24.5) 0.97 (0.85) 1.5 (0.9)
1993 107 4.9 (4.8) 12.5 (12.2) 18.3 (17.6) 25.7 (23.8) 0.94 (0.82) 1.4 (0.8)
1994 105 4.9 (4.8) 12.5 (12.1) 18.2 (17.5) 25.7 (23.6) 0.93 (0.81) 1.8 (1.1)
1995 107 5.4 (4.8) 13.0 (12.1) 18.8 (17.6) 26.2 (23.8) 1.37 (0.80)
a
2.2 (1.4)
1996 105 5.4 (4.7) 13.0 (12.0) 18.8 (17.3) 26.1 (24.2) 1.37 (0.80)
a
2.7 (1.9)
This table reports the mean (median) percentage of shares held by the largest shareholder and the top 3, 5, and 10
shareholders as reported in the August volumes of the Japan Company Handbook (JCH). Also reported is the
mean (median) Herfindahl ratio for share ownership, computed as the sum of the squared holdings across the top
10 shareholders. By design, the Herfindahl ratio has a maximum of 100%. Foreign ownership, reported separately
by the JCH, is for all foreign shareholdings. The sample includes long-term credit banks, city banks, regional
banks, mutual savings banks, and trust banks listed in the Japan Company Handbook in each sample year.
a
The increase in mean Herfindahl index in 1995 is due entirely to Mitsubishi Bank’s share in Nippon Trust
Bank, which went from 5% in 1994 to 68.8% in 1995. Excluding Nippon Trust from the sample results in a mean
Herfindahl index of 0.93% for both 1995 and 1996.
C.W. Anderson, T.L. Campbell II / Journal of Corporate Finance 10 (2004) 327–354 333
measures of ownership concentration for our sample banks over time. The evidence in
Table 1 suggests that ownership concentration is relatively constant across time, however.
For example, the top 3 shareholders control a mean (median) of 13.0% (12.4%) of
outstanding shares in 1985. There is little subsequent variation in percentage owned by the
top 3 shareholders, and in 1996 their mean (median) stakes total 13.0% (12.0%) of all
shares. Similarly, there is little variation in ownership concentration for the top share-
holder, top 3 shareholders, or top 10 sha reholders. We also construct a Herfindahl
concentration ratio by summing the squared ownership shares across the top 10 share-
holders. The Herfindahl ratio remains largely invariant over time, with a mean increase in
1995 due to a single extreme observation, i.e., Mitsubishi Ba nk’s move to 68.8%
ownership in Nippon Trust Bank from a previous level of 5%. In short, the evidence is
inconsistent with the prediction that equity ownership becomes more concentrated after the
onset of the banking crisis.
Table 1 also shows the level of foreign ownership in sample banks over time. Foreign
ownership increases from a mean (median) of 0.4% (0.1%) in 1985 to a mean (median) of
2.7% (1.9%) in 1996. The JCH woul d identify foreign shareholders only if they were
among the top 10 in terms of shares held. Even among the banks with the largest
concentrations of foreign shareholders (e.g., Sumitomo Trust and Banking with 11.4% of
shares held by foreign investors in 1996), no foreign investor is listed among the top 10
shareholders. Consequently, the increase in foreign shareholdings of Japanese banks over
our sample period appears to be due to an increase in participation in the Japanese stock
market by passive foreign investors with dispersed ownership, not control transactions
involving foreign block holders.
3.4. Changes in ownership and control among top shareholders
Table 1 indicates that ownership concentration among top shareholders of Japanese
banks is nearly constant over time. Nevertheless, there may be shifts of controlling blocks
among top owners. In particular, the upheaval in the Japanese banking sector in the 1990s
may prompt shifts in ownership away from former controlling shareholders to new owners
who could provide better monitoring or risk bearing. Bethel et al. (1998), for example, find
increased block share purchases for U.S. firms following poor performance and preceding
restructuring activity. Control activity of this nature could change the identities of the top
shareholders without affecting ownership concentration levels.
To measure control activity of this nature we track the shareholdings of each of the
top 5 shareholder s for banks listed in the 1985 Japan Company Handbook over the
next 5 years ending in fiscal year 1990. In other words, we observe the extent to which
the top 5 shareholders as of 1985 alter their ownership over the subsequent 5 years,
both individually and as a group. Then, using the 1990 JCH’s list of top 5 shareholders,
we repeat the experiment over the next 5 years. We can thus compare the net
transactions of the top 5 shareholders over the 5 years preceding the banking crisis
to the 5 years afterwards. This procedure excludes banks that cease to be listed due to
failure or merger, but includes the post-merger banks compared to the acquirer banks
before the merger. The time horizon of 5 years allows us to observe shifts in equity
ownership that are completed over several years. The measure is biased because
C.W. Anderson, T.L. Campbell II / Journal of Corporate Finance 10 (2004) 327–354334
reductions in equity stakes that cause a top 10 shareholder to fall off the list are treated
as complete sell-offs when perhaps shareholdings remain positive yet below the
threshold for the top 10. Censoring the change in stake to a sell-off sufficient to put
a shareholder at parity with the smallest listed shareholder does not affect our
inferences below, however.
Table 2 reports changes in ownership for the top 5 shareh olders over the pre- and
crisis periods. Under the effective external governance hypothesis, the banking crisis in
the 1990s should prompt an increase in control transactions involving these influential
shareholders. In general, the opposite conclusion is drawn from Table 2. Panel A of
Table 2 reports the changes in the summ ed stake of the top 5 shareholders over a 5-year
period. There are fewer and less dramatic changes in ownership among the top 5
Table 2
Changes in ownership among ‘top 5’ shareholders
Pre-crisis 1985 to 1990 Crisis 1990 to 1995
Panel A. Top 5 shareholders per bank
Number of sample banks 86 101
Mean change for top 5 in aggregate À 2.4% À 0.5%
a
Median change for top 5 in aggregate À 1.8% À 0.4%
Standard deviation for top 5 in aggregate 2.7% 1.8%
a
Distribution of changes per bank N (% sample) N (% sample)
Decreases < À 5% 14 (16.3%) 6 (5.9%)
Decreases of À 1% to À 5% 50 (58.1%) 24 (23.8%)
Change of F 1% 18 (20.9%) 67 (66.3%)
Increases of + 1% to + 5% 4 (4.7%) 2 (2.0%)
Increases >5% 0 (0.0%) 2 (2.0%)
Panel B. Individual top 5 shareholders
Number of top 5 shareholders at sample banks 430 505
Mean change per shareholder À 0.5% À 0.1%
a
Median change per shareholder À 0.2% 0.0%
Standard deviation of change per shareholder 2.7% 0.9%
a
Distribution of changes per shareholder N (% sample) N (% sample)
Decreases < À 1% 68 (15.8%) 40 (7.9%)
Decreases of no more than À 1% 249 (57.9%) 162 (32.1%)
No change 37 (8.6%) 200 (39.6%)
Increases of less than 1% 71 (16.5%) 95 (18.8%)
Increases >1% 5 (1.2%) 8 (1.6%)
This table shows the change in ownership stake of the top 5 shareholders for each bank listed in the Japan
Company Handbook from 1985 to 1990 (86 banks, 430 listed top 5 shareholders) and from 1990 to 1995 (101
banks, 505 listed top 5 shareholders). The ownership changes are noted both for the sum of ownership stakes of
the top 5 shareholders for each bank as well as for the pooled sample of individual shareholders. Top five
shareholders whose stake declines sufficiently such that they are no longer listed among the top 10 shareholders
are treated as complete sell-offs. Results obtained by comparing 1986 to 1991 and 1991 to 1996 result in similar
inferences and are available from the authors by request.
a
Mitsubishi Bank increased its stake in Nippon Trust Bank from 5.0% in 1990 to 68.8% in 1995, and this
observation is excluded for the means and standard deviations reported in this table. Including the observation for
Nippon Trust’s top 5 owners results in a standard deviation of 5.7% for the change in ownership by the top 5
shareholders from 1990 to 1995 and a standard deviation of 3.0% for changes among all top 5 shareholders.
C.W. Anderson, T.L. Campbell II / Journal of Corporate Finance 10 (2004) 327–354 335
shareholders over the 1990 to 1995 period compared to the preceding period. Spe cif-
ically, the top 5 shareholders decreased their proportionate stake, on average, by À 2.4%
over the 1985–1990 period but only by À 0.5% over the 1990–1995 period. The
standard deviation of the change in the top 5 shareholders’ combined stake was 2.7% in
the 5 years ending in 1990, but only 1.9% over the 1990–1995 period. Recall from
Table 1 that the mean (median) ownership stake of the top 5 shareholders was 18.8%
(17.7%) in 1985 and 17.6% (16.9%) in 1990, so this variation is relatively small. The
distribution of these changes in the pre-crisis versus crisis years indicates that shifts in
control involving the top 5 shareholders are less dispersed in the crisis period.
Specifically, in the later period 67 of the 101 sample banks (66.3%) experienced a
change of the combined stake of the top 5 shareholders within F 1%, compared to only
18 of the 86 sample banks (20.9%) in the earlier period. To put this another way, in the
pre-crisis period of 1985–1990, 79.1% of sample banks had changes in ownership by
the top 5 shareholders of greater than 1% in absolute terms, whereas in the crisis period
of 1990 –1995 only 33.7% of sample banks had ownership changes of greater than 1%
in absolute terms. Ownership by the top 5 shareholders is more entrenched after the
banking crisis than before.
Changes per top 5 shareholder, reported in panel B of Table 2, reinforce the inference of
fewer control transactions after the banking crisis. The average change in ownership stake
per shareholder is À 0.5% over 1985 – 1990, but only À 0.1% for 1990– 1995. In fact,
39.6% of the top shareholders as of 1990 display no change in their owne rship stake over
the following 5 years, compared to just 8.6% over the previous 5-year period. About
17.0% of controlling shareh olders experience changes of greater than 1% in absolute
magnitude over 1985–1990, compared to just 9.5% of shareholders over 1990– 1995. In
short, ownership by controlling shareholders is more invariant after the banking crisis
compared to the previous period. Observation of entrenched ownership structure following
an economic shock such as the Japanese banking crisis suggests apparently inactive
external governance mechanisms.
4. Executive turnover at Japanese banks
In this section we describe executive turnover observed at Japanese banks during our
sample period of 1985–1996. We also investigate one prediction of the hypothesis of
active internal governance. Namely, we should observe an increase in managerial turnover
in the 1990s if executives were punished for decisions that heightened the exposure of
their banks to the banking crisis. The banking crisis did not increase the frequency of
turnover for Japanese bank presidents, however.
4.1. Data on executive turnover at Japanese banks
We record the presidents and chairmen for the 110 banks listed on the First Section of
the Tokyo Stock Exchange as reported in the JCH from 1984 to 1996. Not all sample
banks are listed from the start of this sample period, but JCH coverag e of all banks except
one persists unless they are acquired or fail. Consequently, we focus on turnover for bank-
C.W. Anderson, T.L. Campbell II / Journal of Corporate Finance 10 (2004) 327–354336
years for which a sample bank does not fail and is not acquired.
1
Our primary emphasis is
on bank presidents, consistent with earlier studies of Japanese managerial turnover
(Kaplan, 1994; Kang and Shivdasani, 1995). The JCH, for example, states, ‘‘In general,
the president of a Japanese company possesses greater decision-making powers than the
chairman’’ (Autumn 1998 volume, p. 67). Neve rtheless, we also report data and discuss
some results for turnover of bank chairmen.
In total, we track 354 distinct individuals who serve as president or chairman at
sample banks over this time period. We note changes in the identities of either reported
titleholder in each subsequent quarterly volume of the JCH, star ting with the third quarter
volume available for 1984. Fiscal years for all sample banks end in March, and the
annual financial statements first appear in the subsequent August volume of the JCH. We
also observe a disproportionat e number of management changes in the August volumes.
For example, about 60% of all presidential turnovers and 56% of all chairman turnovers
are observed in the August volumes of the JCH. Clustering in executive changes could
be because they tend to occur at the end of the fiscal year or because the management
masthead in the JCH tends to be updated only in the August volumes. We therefore
assign turnover between consecutive August volumes to the fiscal year ending in March
of the latter year.
4.2. Observed frequency of executive turnover
Observed turnover is presented in Table 3. Our procedure for observ ing and dating
turnover results in 1198 fiscal years, 243 fiscal years with some change in titleholder,
134 annual changes in chairman, 160 changes in president, and 43 non-routine departures
of president, i.e., a president does not succeed to the chairmanship.
2
The frequencies of
annual turnover that correspond to these observations are: turnover of any executive,
20.3%; turnover of chairman, 11.2%; turnover of president, 13.4%; and turnover of
president without succession to the chairmanship, 3.6%. About one-third of all bank
years have only a president and no incumbent chairman listed in the JCH.
3
Chairman
turnover for the sample of bank years with an incumbent chairman is 16.8%, or an
implied tenur e of 6.0 years. The 13.4% turnover rate for presidents implies an average
tenure of 7.5 years.
A president assuming the chairmanship appears routine at Japanese banks, occurring
73% of the time when a president surrenders his title. Observed presidential turnover
without succession occurs in 27% of all presidential turnovers, accounting for only
3.6% of our sample bank years. Turnovers of presidents without face-saving succes sion
1
For each of the three mergers, the presidents of the pre-merger banks became chairman and president of the
successor bank. We cannot confirm the fate of the executives at two failed banks and Nishi Nippon Bank, which
ceases to be listed in the JCH after its conversion to a regional bank in 1986.
2
Incidentally, we also note when both a chairman and distinctly listed president depart within a fiscal year.
The number of such cases is small (seven, in total), and spread evenly across the sample period. We regard the
number of such instances as too small to serve as a basis for reliable inference.
3
We cannot explain why bank chairmen are not listed in the JCH for some sample banks, but the
phenomenon appears to be persistent and widespread across our sample period. All JCH-listed banks identify the
president, however, and our results in the next section focus on presidential turnover.
C.W. Anderson, T.L. Campbell II / Journal of Corporate Finance 10 (2004) 327–354 337
to the chairmanship are not only rare but also occur after a relatively short tenure.
Mean (median) tenure of delisted presidents who do not succeed to the chairmanship is
4.5 (4.0) years, while mean (median) presidential tenure is 6.9 (6.0) years for ex-
presidents that assume or retain the chairmanship. Both parametric and nonparametric
tests reject that these observed tenures are equal. We therefore interpret presidential
turnover without succession as non-routine and as more likely to be due to discipline
of management due to poor performance. This classification is identical to that
employed Kang and Shivdasani (1995) in their investigation of Japanese industrial
firms. We also search for news on the non-routine turnover events in our sample. We
identify eight non-routine turno vers in which the president dies or retires due to illness,
resulting in an adjusted non-routine turnover rate of 2.9%. Without additional
biographic information on sample executives further distinguishing turnover events as
strictly attributable to bank performance is difficult, but our news search identifies 10
Table 3
Executive turnover observed at Japanese banks, 1985–1996
Fiscal
years
Turnover of
either chairman
or president
Turnover of
chairman
a
Turnover of
president
Turnover of
president
without
succession to
chairman
Non-succession
turnover
excluding deaths
and illness
Panel A. All banks
All years,
1985 – 1996
1198 243 (20.3%) 134 (11.2%) 160 (13.4%) 43 (3.6%) 35 (2.9%)
Pre-crisis,
1985 – 1990
568 111 (19.5%) 56 (9.9%) 78 (13.7%) 23 (4.0%) 15 (2.6%)
Crisis,
1991 – 1996
630 132 (20.9%) 78 (12.4%) 82 (13.0%) 20 (3.2%) 20 (3.2%)
Panel B. Top 23 banks
All years,
1985 – 1996
256 72 (28.1%) 50 (19.5%) 50 (19.5%) 10 (3.9%) 6 (2.3%)
Pre-crisis,
1985 – 1990
131 34 (26.0%) 23 (17.6%) 26 (19.8%) 7 (5.3%) 3 (2.3%)
Crisis,
1991 – 1996
125 38 (30.4%) 27 (21.6%) 24 (19.2%) 3 (2.4%) 3 (2.4%)
Panel C. Regional banks
All years,
1985 – 1996
942 171 (18.2%) 84 (8.9%) 110 (11.7%) 33 (3.5%) 29 (3.1%)
Pre-crisis,
1985 – 1990
437 77 (17.6%) 33 (7.6%) 52 (11.9%) 16 (3.7%) 12 (2.7%)
Crisis,
1991 – 1996
505 94 (18.6%) 51 (10.1%) 58 (11.5%) 17 (3.4%) 17 (3.4%)
This table reports the sample frequency of executive turnover per fiscal year observed at 110 First Section TSE
banks with data available from the Japan Company Handbook (JCH) during 1985 to 1996. Fiscal years are April
through March. Turnover is assigned to a fiscal year if managerial change is observed between third quarter JCHs
published in August.
a
Not all banks have a chairman listed in the JCH in all bank years; adjusted turnover rates for banks years
with incumbent chairmen are provided in the text.
C.W. Anderson, T.L. Campbell II / Journal of Corporate Finance 10 (2004) 327–354338
instances in which non-routine turnover is linked to poor bank performance in the
financial press.
The turnover rates in our sample are similar to those reported for U.S. banks and
Japanese industrial firms. Barro and Barro (1990), for example, report a 12.8% annual rate
of CEO change for 83 U.S. banks over 1982–1987. Kaplan (1994) reports a 15.0%
incidence of presidential turnover at 119 Japanese industrial firms over 1980–1988, 4.7%
when the president does not succeed the chairman. Kang and Shivdasani (1995) report
presidential replacement at 12.9% and replacement without promotion at 4.7% for 270
non-financial Japanese firms over 1985–1990. However, non-routine turnover of presi-
dent without promotion to chairman is less frequent for our sample of banks (2.9%,
adjusted for death or illness) compared to the 4.7% annual rate reported for non-financial
Japanese firms in both Kaplan (1994) and Kang and Shivdasani (1995). This comparison
suggests that potentially disciplinary turnover of presidents is less common at Japanese
banks than at industrial firms.
Observed turnover also differs for the 23 city banks, credit banks, and trust banks
versus the 87 regional banks. The top 23 banks experience turnover at the following
annual rates: any turnover, 28.1%; departure of chairman, 19.5%; change of presiden t,
19.5%; non-succession president turnover, 3.9%; and non-succession turnover excluding
death or illness, 2.3%. Most large banks have an incumbent chairman (88% of bank years),
and adjusting for banks that do not results in chairman turnover of 22.2% and implied
tenure of 4.5 years, similar to the implied tenure of 5.1 years for presidents. Broad
measures of turnover are materially lower for the 87 regional banks, i.e., 18.2% incidence
of any change, 8.9% departure of chairman, and 11.7% change of president. Regional
banks are less likely to have an incumbent chairman listed in the JCH (61% of fiscal
years), and adjusting for this results in chairman turnover of 14.6% and implied tenure of
6.8 years. Implied tenure for regional bank presidents is 8.6 years. Chi-squared tests reject
that these turnover frequencies for regional banks are identical to those for the larger banks
at the 1% level. Non-succession turnover rates for bank president are not significantly
different between the top 23 banks and the regional banks, however.
4.3. Changes in turnover following the onset of the banking crisis
Table 3 also compares turnover in the pre-crisis period of 1985–1990 to the crisis
period of 1991–1996. Increased turnover rates would be consistent with ex-post settling
up with bank presidents following the onset of the banking crisis. In other words, boards of
directors at Japanese banks might hold bank presidents accountable for the exposure of
their bank to banking crisis. Also, uncertainty induced by the crisis and the need for
restructuring in its aftermath might call for replacement of incumbents with executives
who possess requisite managerial skill for the new environment.
The frequency of any turnover increases slightly from 19.5% to 20.9% (26.0% to
30.4% for the large banks, 17.6% to 18.6% for the small banks). This is largely due to an
increase in turnover of bank chairmen from 9.9% over 1985 – 1990 to 12.4% over 1991–
1996. Adjustment for banks without incumbent chairmen only slightly diminishes this
difference (15.6% for the pre-crisis period versus 17.7% for the crisis period), and chi-
squared tests reject that these frequencies are different at a p-value less than 1%. These
C.W. Anderson, T.L. Campbell II / Journal of Corporate Finance 10 (2004) 327–354 339
adjusted rates of turnover are c onsistent with a decline in average chairman tenure from
6.4 to 5.6 years. This pattern holds for both the largest 23 banks and for the smaller banks,
both before and after adjustment for the presence of an incumbent chairman. In contrast,
presidential turnover rates do not change materially after the onset of the banking crisis
(13.0% crisis compared to 13.7% pre-crisis). However, non-routine turnover of president
(adjusted for deaths or illness) increases slightly for all banks from 2.6% to 3.2%, mostly
due to an increase from 2.7% to 3.4% among regional banks. Notably, 8 of the 10
instances in which the financial press links non-routine turnover to performance occur
after the onset of the banking crisis.
No increase in presidential turnover in the 1990s suggests an absence of ex-post
settling up for the decisions made by incumbent presidents that increased bank risk
prior to the banking crisis.
4
It also indicates an absence of widespread replacement of
incumbents by executives with skills better suited to the crisis environment. Absolute
bank performance deteriorated dramatically following the banking crisis, so a lack of a
dramatic increase in presidential turnover also implies the absence of a relation with
absolute bank performance. There is a slight acceleration in the departure of incumbent
chairmen, however. This phenomenon could suggest that some chairmen, rather than
presidents, are responsible for devising and implementing bank policies, and hence are
held accountable for exposure to the banking crisis and poor bank performance. On the
other hand, perhaps bank chairmen resign as a symbolic gesture in the face of
organizational inadequacies for which they are not largely responsibl e. Our inves-
tigation of the relation betwee n tu rno ver and bank performan ce addresses these
questions.
5. Bank performance and executive turnover
We next investigate the relation between managerial turnover and bank performance
measured by stock prices and accounting profitability. We do not detect a relation between
non-routine turnover and bank performance before the banking crisis, but managerial
incentives sharpen measurably in the 1990s.
5.1. Measures of bank performance
We rely on the University of Rhode Island’s Pacific-Basin Capital Markets (PACAP)
Database to compute performance measures for Japanese banks. After accounting for
unavailable data for some banks, the sample comprises 101 banks and 1133 bank years.
5
4
One interpretation is that the decisions of Japanese bank executives were ex-post disastrous only due to bad
luck, but banks differed in their decisions to expose themselves to risks inherent in lending to volatile sectors such
as real estate and construction (Dincß, 1999; Van Rixtel and Hassink, 1998).
5
Data are not available from PACAP for nine regional banks that account for 65 bank years out of the JCH
sample of 1198. The missing data are distributed evenly over the sample period and the JCH provides data until
the fourth quarter of 1996 for all but three of these nine banks. Consequently, survivorship bias does not explain
why data for most of these banks do not appear in the PACAP database. Additional bank years are lost due to data
inadequacies with regard to particular performance measures we discuss below.
C.W. Anderson, T.L. Campbell II / Journal of Corporate Finance 10 (2004) 327–354340
We calculate three performance measures based on stock price s: the raw stock return
for each fiscal year; market-adjusted return calculated as raw return minus the return on
the PACAP equally weighted market index; and an industry-adjusted return calculated as
the raw return minus the return on the PACAP index for bank stocks.
6
We calculate
three performance measures based on accounting income: return on assets (ROA)
calculated as net income divided by year-end assets; change in ROA calculated as
ROA minus the previous year’s ROA; and industry-adjusted ROA calculated as ROA
minus the median ROA for the fiscal year.
7
Consistent with other studies, we employ
indicator variables for low or negative profitability in addition to continuous measures.
Finally, we also measure bank performance based on asset growth and industry-adjusted
asset growth.
Table 4 provides summary statistics on bank performance. Performance measures in
the crisis period of 1991 – 1996 versus the pre-crisis period of 1985 – 1990 reflect
dramatic change in the operating environment of Japanese banks. Specifically, mean
(median) raw stock return is 29.43% (21.60%) before the crisis, but À 7.55% ( À 7.59%)
after the crisis. Mean (median) return on assets is 0.2445% (0.2364%) before the crisis,
but only 0.0636% (0.1424%) after the crisis. Finally, bank assets grow at a mean
(median) annual rate of 11.88% (11.10%) before the crisis, compared to 1.14% (1.21%)
afterwards.
We presume that boards of directors rely on publicly observable measures of perform-
ance such as stock prices or accounting profitability when they evaluate bank executives.
Prior studies suggest that managerial turnover at banks, in general, is more likely to be
related to stock returns than accounting performance. Barro and Barro (1990),for
example, suggest that incentives for bank managers should be based on stock prices
because banks enjoy greater accounting discretion than other firms. For Japanese banks, in
particular, Genay (1998) finds that Japanese banks smooth accounting income, that the
strength of the relation between accounting performance and stock returns varies over
time, and that ‘‘Japanese accounting, disclosure, and regulatory practices might have
driven a wedge between banks’ accounting and stock returns in recent years’’ (p. 13).
Several studies suggest, nevertheless, that stock price s reflect differential bank risk and
operating performance in spite of opaque financial reporting and lax regulatory policies in
Japan (Brewer et al., 1999; Yamori, 1999; Bremer and Pettway, 2002). Nevertheless, there
will be a bias against an empirical relation between observable performance and executive
turnover if boards of directors also rely on private information to assess managerial
effectiveness.
5.2. The relation between performance and executive turnover
To assess the empirical relation between bank performance and managerial turn-
over we estimate separate logit models of the following parsimonious form for
6
The PACAP stock-price index for banks excludes dividends, hence so do we. Our results for raw stock
returns or market-adjusted returns do not materially change if we measure these returns with dividends.
7
We also utilized profitability measures based on either operational income or net income adjusted for taxes
and extraordinary items. Results were similar to those based on net income. We omit these results for brevity.
C.W. Anderson, T.L. Campbell II / Journal of Corporate Finance 10 (2004) 327–354 341
Table 4
Summary statistics for bank performance measures pre- and post-banking crisis
Performance measures Panel A. Pre-crisis bank years, 1985 –1990 Panel B. Crisis bank years, 1991–1996
Mean Standard
deviation
25% Median 75% Mean Standard
deviation
25% Median 75%
Stock return 0.2943 0.3363 0.0700 0.2160 0.4458 À 0.0755 0.1695 À0.1842 À 0.0759 0.0184
Market-adjusted stock return 0.1339 0.3166 À 0.0788 0.0542 0.2966 À 0.0323 0.1457 À0.1241 À 0.0265 0.0798
Industry-adjusted stock return 0.0522 0.3213 À 0.0946 0.0327 0.1999 À 0.0377 0.1437 À0.1297 À 0.0338 0.0682
Return on assets (
Â
100) 0.2445 0.0759 0.1916 0.2364 0.2842 0.0636 0.5176 0.0776 0.1424 0.1978
Industry-adjusted ROA (
Â
100) 0.0109 0.0715 À 0.0382 0.0000 0.0499 À 0.0655 0.5065 À0.0395 0.0000 0.0482
Change in ROA (
Â
100) 0.0005 0.0425 À 0.0204 À 0.0022 0.0232 À 0.0845 0.5835 À 0.0630 À 0.0230 0.0018
Asset growth 0.1188 0.0666 0.0748 0.1110 0.1506 0.0114 0.0657 À 0.0177 0.0121 0.0360
Industry-adjusted asset growth 0.0065 0.0620 À 0.0287 À 0.0012 0.0341 À 0.0018 0.0623 À 0.0243 0.0000 0.0210
This table shows summary statistics on bank performance measures. The sample consists of First Section TSE-listed banks with data available from the Japan Company
Handbook during 1985 to 1996. Stock return in computed without dividends for the fiscal year. Market-adjusted stock return is fiscal year stock return net the equally
weight PACAP market index. Industry-adjusted stock return is fiscal year stock return net the return on PACAP index of bank stocks. Return on assets is computed as net
income over end-of-year assets. Change in ROA is current year ROA net previous year ROA. Industry-adjusted ROA is ROA net the median ROA for sample banks in the
same fiscal year. Asset growth is year-end asset growth from previous year assets. Industry-adjusted asset growth subtracts the median asset growth for sample banks for
each fiscal year.
C.W. Anderson, T.L. Campbell II / Journal of Corporate Finance 10 (2004) 327–354342
samples from the pre-crisis sample period of 1985 – 1990 and the crisis period of
1991–1996:
ln½q=ð1 À qÞ ¼ a þ b  PERFORMANCE þ d  PREVIOUS TURNOVER þ l
ð1Þ
where q is the probability of non-routine presidential turno ver (adjusted for death or
illness), PERFORMANCE i s measured using either stock returns or accounting
profitability, and PREVIOUS TURNOVER is an indicator variable equal to 1 when
the incumbent president for a sample bank has less than 2 years of tenure at the start
of the fiscal year, indicating that it is unlikely that turnover will occur (Kang and
Shivdasani, 1995). Under the hypothesis of active internal governance we predict an
inverse relation between measures of bank performance and non-ro utine presidential
turnover. We use estimated coefficients from Eq. (1) and calculate an implied
probability of turnover as follows for a given level of performance under the
assumption of no prior turnover:
qðPERFORMANCEÞ¼e
aþbÂPERFORMANCE
=ð1 þ e
aþbÂPERFORMANCE
Þð2Þ
We are particularly interested in how the relation between performance and non-
routine turnover differs in the pre-crisis period versus the crisis period. With regard to
the sample of bank years from 1985 to 1990, estimates of Eq. (1) will inform us
whether Japanese bank presidents faced performance incentives in the years preceding
the onset of banking crisis. With regard to the crisis period, we hypothesize that bank
performance more strongly affects managerial turnover than in the earlier period since
the shocks of the 1990s heighten the importance of managerial decisions to bank
profitability and survival. Such a result would be consistent with findings of Crawford
et al. (1995) and Hubbard and Palia (1995) who show that managerial incentives
become stronger when U.S. banks experience deregulation and increased competition.
Kole and Lehn (1999) report simil ar results for the U.S. airline industry w hen
deregulation heightened the contribution of managerial decision-making to firm profi t-
ability and survival. Other studies that examine the performance–turnover relat ion
around a common event include Mikkelson and Partch’s (1997) investigation of U.S.
firms before and after a decline in aggregate takeover activity and Dahya et al. (2002)
investigation of U.K. firms before and after the promulgation of a code of best practice
regarding boards of directors.
5.3. Non-routine executive turnover and stock-price performance
Table 5 reports estim ates of logit equations of the likelihood o f non-routine
presidential turnover (adjusted for death or illness) conditioned on stock returns in
both the pre-crisis and crisis periods. Panel A of Table 5 reports results for the sample
of 501 bank years from 1985 to 1990 for which return data are available from PACAP.
The coefficient estimates for all three return measures are positive but statistically
indistinguishable from zero. The coefficient estimate for previous turnover is negative
C.W. Anderson, T.L. Campbell II / Journal of Corporate Finance 10 (2004) 327–354 343
as predicted for each specification but not statistically different from zero. Omission of
the previous turnover indicator variable does not result in different inferences for the
stock return performance measures from those reported in Table 5. The chi-squared
statistics derived from the likelihood functions for each equation indicate that the
estimated equations do not explain the likelihood of non-routine turnover over this
sample period. In general, Panel A of Table 5 indicates an absence of a relation
between bank stock returns and non-routine turnover prior to the onset of the banking
crisis.
8
The results for the 584 bank years from 1991 to 1996 are reported in Panel B of
Table 5. An inverse and statistically significant relation exists between stock returns
and non-routine turnover in the crisis period. The coefficient estimate for raw stock
return is À 2.3043 ( p-value of 11.54%), but the coefficient estimates for both market-
adjusted return and industry-adjusted return are more negative and statistically different
from zero (coefficients of À 4.8972, p-value of 0.22%, and À 5.0300, p-value of
0.20%, respectively). The coefficients for the indicator variable for previous turnover
are negative and significant in all three specifications, indicating that tenure affects
turnover likelihood in the 1990s. Specifically, the unconditional probabilities of non-
routine turnover for recently hired presidents (implied by the coefficient estimates in
Table 5
Likelihood of non-routine turnover based on stock price performance
Explanatory
variables
Panel A. Pre-crisis bank years, 1985 –1990
(501 bank years, 15 turnovers)
Panel B. Crisis bank years, 1991 –1996
(584 bank years, 18 turnovers)
Intercept À 3.6073
(0.0000)
À 3.4887
(0.0000)
À 3.4786
(0.0000)
À 3.2811
(0.0000)
À 3.4807
(0.0000)
À 3.5132
(0.0000)
Stock return 0.5193
(0.4174)
À 2.3043
(0.1154)
Market-adjusted
stock return
0.3207
(0.6681)
À 4.8972
(0.0022)
Industry-adjusted
stock return
0.4953
(0.5009)
À 5.0300
(0.0020)
Previous turnover À 0.0968
(0.8568)
À 0.0913
(0.8647)
À 0.0923
(0.8631)
À 1.4012
(0.0286)
À 1.3085
(0.0417)
À 1.3215
(0.0398)
v
2
statistic (2 df )
( p-value)
0.5969
(0.7420)
0.1944
(0.9074)
0.4429
(0.8014)
8.3518
(0.0154)
15.2991
(0.0005)
15.4655
(0.0004)
This table provides coefficients on logit regressions of non-routine presidential turnover, defined as change of
president not due to death or illness and the ex-president does not become chairman. The sample consists of fiscal
years for First Section TSE-listed banks with data available from the Japan Company Handbook during 1985 to
1996. Stock return is computed without dividends for the fiscal year. Market-adjusted stock return is raw return
net the equally weighted PACAP market index. Industry-adjusted stock return is fiscal year stock return net the
return on the PACAP index of bank stocks. Previous turnover is equal to one if the observed tenure of the
incumbent president is less than 2 years at the start of the fiscal year. Figures in parentheses below coefficient
estimates are p-values associated with asymptotic t-tests.
8
We also estimate but do not report versions of Eq. (1) using raw stock return and indicator variables for
fiscal years. This specification also fails to detect a relation between returns and non-routine turnover for the pre-
crisis period. Conversely, such a specification indicates a significantly negative relation between returns and non-
routine turnover in the crisis period.
C.W. Anderson, T.L. Campbell II / Journal of Corporate Finance 10 (2004) 327–354344
Table 5) are less than 1% in the crisis period but about 3% in the pre-crisis period.
Incidentally, when this indicator variable is omitted, the coefficient estimates on the
latter two performance measures change only slightly from those reported in Table 5
and remain different from zero at 1% significance levels. Finally, when we pool the
pre-crisis and crisis samples we find that the coefficients on stock price performance
are significantly more negative in the crisis period. We omit reporting these specifi-
cations for brevity.
Table 6 reports turnover probabilities implied by the logit equation estimates from
Table 5 as well as observed turnover frequency across stock return quintiles. Observed
frequency is reported for sample banks with an incumbent president with fewer than 2
years of tenure at the start of the fiscal year. Predicted turnover is calculated using the
coefficient estimates from Table 5 with the performance meas ure set at each quintile’s
respective median and the indicator variable for previous turnover set to zero. Panel A
reports this comparison for the pre-crisis bank years of 1985–1990. Consis tent with our
inferences from Table 5, the implied probabilities and observed frequencies of non-routine
turnover do not suggest that non-routine turnover decreases as stock performance
improves.
Panel B of Table 6 reports the observed and predicted frequency of non-ro utine
turnover for the crisis period. Predicted turnover frequencies across performance quintiles
reflect economically significant dispersion. Specifically, for predicted frequency of non-
routine turnover for the worst versus best quintiles are 6.8% versus 2.7% in the case of raw
return, 8.1% versus 1.4% in the case of market-adjusted return, and 8.2% versus 1.4% in
the case of industry-adjusted return. Observed frequencies of turnover are not monotoni-
cally decreasing across performance quintiles. Nevertheless, for market-adjusted return
and industry-adjusted return the worst quintiles display the highest rates of turnover
frequency (7.0% and 7.4%, respectively) and the best quintiles display the lowest rates
(1.6% and 0.0%, respectively).
The results reported in Tables 5 and 6 indicate that stock-price performance does not
affect the likelihood of non-routine turnover before the onset of the banking crisis. After
the onset of the crisis, however, there is a significant inverse relation between stock returns
and turnover. In fact, the relation is comparable in magnitude to results obtained
employing similar methodologies for samples of Japanese industrial firms. Kang and
Shivdasani (1995), for example, report that the probability of non-routine turnover for
Japanese firms in the bottom decile of excess stock return is 6.4% versus 2.5% for firms in
the top decile (Kang and Shivdasani, 1995, Table 4, p. 43). Kaplan (1994), Kang and
Shivdasani (1995), and Kaplan and Ramseyer (1996) interpret relations of this magnitude
as evidence of effective internal governance for Japanese industrial firms. Jensen and
Murphy (1990), in contrast, question whether performance related dismissal probabilities
of these magnitudes provide economically significant incentives for managers. They view
the expected loss of managerial wealth due to performance-related dismissal as small
relative to the losses of shareholders. Viewed from this perspective, the incentives we
document for Japanese bank e xecutives in the 1990s could be regarded as small.
Regardless of the perspective, however, our results clearly indicate that stock-price
incentives for Japanese bank presidents sharpened measurably after the onset of the
banking crisis.
C.W. Anderson, T.L. Campbell II / Journal of Corporate Finance 10 (2004) 327–354 345
Table 6
Predicted and observed non-routine turnover by stock price performance
Performance Stock return Market-adjusted return Industry-adjusted return
category
Median return
for category
Predicted
turnover
probability
(%)
Observed
turnover
frequency
(%)
Median return
for category
Predicted
turnover
probability
(%)
Observed
turnover
frequency
(%)
Median return
for category
Predicted
turnover
probability
(%)
Observed
turnover
frequency
(%)
Panel A. Pre-crisis bank years, 1985 – 1990
Worst quintile À 0.0150 2.6 3.6 À 0.1744 2.8 1.5 À0.3196 2.6 1.7
2nd quintile 0.1026 2.8 3.1 À 0.0609 2.9 3.9 À 0.0567 2.9 5.4
3rd quintile 0.2160 2.9 1.9 0.0542 3.0 5.0 0.0327 3.0 0.0
4rd quintile 0.4095 3.2 3.3 0.2516 3.2 1.7 0.1623 3.2 4.8
Best quintile 0.6868 3.7 3.4 0.5134 3.5 3.4 0.3998 3.6 3.4
Panel B. Crisis bank years, 1991–1996
Worst quintile À 0.2875 6.8 5.0 À0.2143 8.1 7.0 À 0.2172 8.2 7.4
2nd quintile À 0.1633 5.2 7.1 À 0.1068 4.9 4.3 À 0.1097 4.9 4.2
3rd quintile À 0.0759 4.3 2.9 À 0.0265 3.4 6.3 À 0.0338 3.4 6.3
4th quintile 0.0000 3.6 3.2 0.0573 2.3 3.0 0.0441 2.3 4.5
Best quintile 0.1325 2.7 4.3 0.1538 1.4 1.6 0.1444 1.4 0.0
This table reports predicted and observed incidence of non-routine presidential turnover at Japanese banks based on stock price performance. Non-routine turnover is
defined as change of president not due to death or illness and the ex-president does not become chairman. The pre- and crisis samples of bank years are categorized by raw
stock return, market-adjusted return, or industry-adjusted return. Predicted turnover is calculated as e
a + b
Â
RETURN
/(1 + e
a + b
Â
RETURN
), where a and b are the coefficient
estimates reported in Table 5, RETURN is the quintile median return, and the indicator variable for previous turnover is set to zero. Observed turnover is number of
turnover observations divided by bank years with an incumbent president with more than 2 years of tenure at the start of the fiscal year.
C.W. Anderson, T.L. Campbell II / Journal of Corporate Finance 10 (2004) 327–354346
5.4. Non-routine executive turnover and profitability
Table 7 reports estimates of logit equations of non-routine turnover conditioned on
accounting-based measures of profitability. Panel A reports results for the sample of 534
bank years from 1985 to 1990 for which financial statement data are available from
PACAP. The coefficient estimates for return on assets (ROA), change in ROA, and
industry-adjusted ROA are not statistically distinguishable from zero. The fourth column
uses an indicator varia ble equal to 1 if industry-adjusted return on assets is in the lowest
quintile and otherwise 0. For this specification, the coefficient is positive (1.0256, p-value
of 5.71%), indicating that the poorest performing bank years had significantly higher
likelihood of turnover. The implied probability of turnover for banks in the worst quintile
in terms of industry-adjusted ROA is 5.7% versus 2.1% for other banks. When indicator
variables for low ROA or low change in ROA are included the coefficient estimates are
positive but not significant at conventional levels. For brevity, we omit results for these
variables from Table 7. There are no bank years with negative income in the pre-crisis
period, so we cannot employ an indicator variable for negative income. Finally,
coefficients on the previous turnover variable remain insignificant for the pre-crisis period
across all specifications.
In contrast to the pre-crisis years, results in Panel B for the 596 bank years from the
crisis years of 1991–1996 consistently indicate a negative and statistically significant
relation between profitability and non-routine turnover. In particular, the coefficien t
estimates on return on asset s, change in ROA, and industry-adjusted ROA are negative
and statistically significant (coefficients and p-values of À 0.4735 (1.96%), À 0.4374
(3.53%), and À 0.4703 (2.07%), respectively). An indicator variable for worst quintile
industry-adjusted ROA is positive and statistically signi ficant (coefficient of 1.4410, p-
value of 0.37%). The implied probability of turnover for banks in the worst quintile in
terms of industry-adjusted ROA is 11.8% versus 3.1% for other banks.
9
This result is
similar to that reported by Kaplan (1994) and Kang and Shivdasani (1995) for Japanese
industrial firms. Specifically, these studies use an indicator variable for negative income
and find that it is strongly related to managerial turnover. For our sample, no bank reports
negative income in the pre-crisis period of 1985–1990, and observations of negative
income are clustered near the end of our sample period. Nevertheless, for the crisis period
we find that a negative income indicator variable is also a good predictor of non-routine
managerial turnover (coefficient estimate of 2.2834, p-value less than 0.0001). Finally,
coefficients on the indicator variable for previous turnover are significantly negative across
all crisis-period specifications, implying a reduction in non-routine turnover for recently
hired presidents.
Table 8 reports turnover probabilities implied by our logit equation estimates in Table 7
as well as the observed frequency of non-routine turnover across profitability quintiles.
Observed frequency is reported for sample banks with an incumbent president with fewer
than 2 years of tenure at the start of the fiscal year. Predicted turnover is calculated using
the coefficient estimates from Table 7 with the continuous performance measures set at
9
Indicator variables for worst quintile performance in terms of ROA and change in ROA (unreported) also
have positive coefficients that differ from zero at p-values less than 1%.
C.W. Anderson, T.L. Campbell II / Journal of Corporate Finance 10 (2004) 327–354 347
Table 7
Likelihood of non-routine turnover based on profitability
Explanatory variables Panel A. Pre-crisis bank years, 1985 – 1990
(534 bank years, 15 non-routine turnovers)
Panel B. Crisis bank years, 1991 –1996
(596 bank years, 18 non-routine turnovers)
Intercept À 3.7972
(0.0000)
À 3.5706
(0.000)
À 3.5121
(0.0000)
À 3.8228
(0.0000)
n.a. À 3.0387
(0.0000)
À 3.1139
(0.0000)
À 3.0966
(0.0000)
À 3.4526
(0.0000)
À 3.3992
(0.0000)
Return on assets
(
Â
100)
1.1590
(0.7283)
À 0.4735
(0.0196)
.
Change in ROA
(
Â
100)
8.5746
(0.1468)
À 0.4374
(0.0353)
Industry-adjusted
ROA (
Â
100)
À 0.1525
(0.9671)
À 0.4734
(0.0207)
LOWROA
( = 1 if industry-
adjusted ROA
in worst quintile)
1.0256
(0.0571)
1.4410
(0.0037)
NEGINC
( = 1 if ROA < 0)
n.a. 2.2834
(0.0000)
Previous turnover À 0.0824
(0.8777)
À 0.1002
(0.8519)
À 0.0737
(0.8905)
À 0.0424
(0.9370)
n.a. À 1.5687
(0.0226)
À 1.5179
(0.0250)
À 1.5715
(0.0224)
À 1.5778
(0.0148)
À 1.5417
(0.0182)
v
2
statistic (2 df )
( p-value)
0.1375
(0.9336)
2.0363
(0.3613)
0.0215
(0.9893)
3.3138
(0.1907)
n.a. 9.6672
(0.0080)
8.7986
(0.0123)
9.5813
(0.0083)
13.6089
(0.0011)
19.3934
(0.0001)
This table provides coefficients on logit regressions of non-routine presidential turnover, defined as change of president not due to death or illness and the ex-president
does not become chairman. The sample consists of fiscal years for First Section TSE-listed banks with data available from the Japan Company Handbook during 1985 to
1996. Return on assets is computed as net income over end-of-year assets. Change in ROA is current year ROA net previous year ROA. Industry-adjusted ROA is ROA
net the median ROA for sample banks in the same fiscal year. LOWROA is equal to 1 if industry-adjusted ROA is in the bottom quintile and otherwise 0. NEGINCis
equal to one if net income is negative (there are no negative income bank years in the pre-crisis sample period). Previous turnover is equal to 1 if the observed tenure of the
incumbent president is less than 2 years at the start of the fiscal year. Figures in parentheses below coefficient estimates are p-values associated with asymptotic t-tests.
C.W. Anderson, T.L. Campbell II / Journal of Corporate Finance 10 (2004) 327–354348
Table 8
Predicted and observed non-routine turnover by bank profitability
Performance Return on assets (ROA)
Â
100 Change in ROA
Â
100 Industry-adjusted ROA
Â
100
category
Median
ROA for
category
Predicted
turnover
probability
(%)
Observed
turnover
frequency
(%)
Median
DROA for
category
Predicted
turnover
probability
(%)
Observed
turnover
frequency
(%)
Median
ROA for
category
Predicted
turnover
probability
(%)
Observed
turnover
frequency
(%)
Panel A. Pre-crisis bank years, 1985 – 1990
Worst quintile 0.1565 2.6 3.2 À 0.0468 1.8 3.3 À 0.0688 2.9 4.6
2nd quintile 0.1997 2.7 1.6 À 0.0160 2.4 0.0 À 0.0294 2.9 0.0
3rd quintile 0.2364 2.9 1.7 À 0.0022 2.7 3.2 0.0000 2.9 3.0
4th quintile 0.2721 3.0 2.8 0.0175 3.2 1.4 0.0351 2.9 1.6
Best quintile 0.3365 3.2 5.3 0.0480 4.1 7.4 0.1022 2.9 5.1
Panel B. Crisis bank years, 1991–1996
Worst quintile 0.0401 4.5 12.3 À 0.1304 4.5 11.3 À0.0737 4.5 15.1
2nd quintile 0.0891 4.4 1.6 À 0.0548 4.4 1.5 À 0.0319 4.4 3.3
3rd quintile 0.1424 4.3 4.0 À 0.0230 4.3 4.7 0.0000 4.3 3.8
4th quintile 0.1879 4.2 1.4 À 0.0475 4.3 1.4 0.0337 4.3 0.0
Best quintile 0.2497 4.1 2.9 0.0259 4.2 4.1 0.1132 4.1 2.7
This table reports predicted and observed incidence of non-routine presidential turnover at Japanese banks based on profitability. Non-routine turnover is defined as change
of president not due to death or illness and the ex-president does not become chairman. The pre- and crisis samples of bank years are categorized by return on assets
(ROA), change in ROA, and industry-adjusted ROA. Predicted turnover is calculated as e
a + b
Â
PROFIT
/(1 + e
a + b
Â
PROFIT
), where a and b are the coefficient estimates
reported in Table 7, PROFIT is the quintile median profitability measure, and the indicator variable for previous turnover is set to zero. Observed turnover is number of
turnover observations divided by bank years with an incumbent president with more than 2 years of tenure at the start of the fiscal year.
C.W. Anderson, T.L. Campbell II / Journal of Corporate Finance 10 (2004) 327–354 349
each quintile’s respective median and the indicator variable for previous turnover set to
zero. Panel A reports this compar ison for the pre-crisi s bank years of 1985–1990.
Consistent with our inferences from Table 7, the predicted frequencies show little
dispersion across performance quintiles. Furthermore, the observed frequencies do not
monotonically decrease from worst quintile to best quintile. Table 8 also suggests that the
result from Table 7 regarding banks in the worst quintile of performance with respect to
industry-adjusted ROA is not very robust. Specifically, while the turnover in the worst
quintile is higher than the others combined, a large part of the difference is because there
are no turnover observations in the second-worst performance quintile. Based on a simple
below median versus above median cut of the data, there is no perceptible indication that
more profitable firms have lower levels of turnover, and in fact for all three pre-crisis
profitability measures the highest rates of turnover are observed in the best performing
quintiles.
Panel B of Table 8 reports the observed and predicted frequency of non-routine
turnover by accounting income quintile for the crisis period. The predicted levels of
turnover decline as performance improves, but the dispersion across performance quintiles
is low, ranging from a maximum of 4.5% in the worst quintiles to a minimum of 4.1% in
the best quintiles. Furthermore, examination of the observed frequencies indicates that a
logit specification with continuous accounting performance variables does not fit the data
well. In particular, there is an unusually high rate of observed turnover in the worst
performing quintiles (12.3% for ROA, 11.3% for change in ROA, 15.1% for industry-
adjusted ROA), but little evidence of a relation across the remaining performance
quintiles. Furthermore, the implied probability of non-routine turnover for negative
income bank-years is 24.7% versus 3.2% for other bank years. In other words, over
1991–1996 non-routine presidential turnover occurs disproportionately among banks that
perform very poorly and at a materially lower but more or less uniform rate among other
banks. Prior studies characterize differences in conditional turnover rates of this magnitude
as economically significant and evidence of effective internal governance.
5.5. Additio nal results
Finally, in addition to the results reported in the previous tables, we also consider
measures of bank performance based on asset growth as well as alternative categories of
executive turnover, including routine turnover of presidents and turnover of chairmen. In
general, the null hypotheses associated with the additional tests we conduct are not
rejected, and consequently we do not report these results.
First, bank managers may have incentives to incre ase or maintain bank size. A feature
of the pre-crisis environment is rapid growth of banks. Recall that Table 4 reports that the
mean (median) annual rate of growth over the 1985– 1990 period was 11.88% (11.10%).
In the crisis environment, mean (median) annual asset growth slows to 1.14% (1.21% ),
indicating preservation of bank size, on average, in spite of the change in operating
environment. We investigate whether growth in assets or industry-adjusted growth in
assets condition non-routine turnover of Japanese bank presidents. Contrary to our
expectations, we do not find a relation between growth in assets and turnover for either
the pre-crisis period or crisis period. In short, Japanese bank managers are not punished for
C.W. Anderson, T.L. Campbell II / Journal of Corporate Finance 10 (2004) 327–354350
slow growth in the 1980s, but on the other hand, neither are they punished for failure to
downsize in the 1990s.
Second, we investigate whether routine presidential turnover, i.e., when an incumbent
president ceases to be president but then obtains or retains the title of chairman, is related
to performance. Allowing a president of a poorly performing bank to acquire the title of
chairman, even if just for a year or two, may permit him to save face and preserve social
prestige. Consequently, perhaps some routine turnovers are related to performance . The
annual rate for routine turnover is about 9.7% in the pre-crisis period and 9.8% in the crisis
period. We investigate whether bank performance measures condition routine turno ver in
both the pre-crisis and crisis periods subject to alternative ways of controlling for the
different frequency between top 23 banks and regional banks. In general, we find that bank
performance measured alternativel y by stock prices, accounting income, or asset growth
does not influence the frequency of routine turnover in either period for either large or
small banks.
Finally, Table 3 reports an increase in the rate of turnover of chairmen over the 1991–
1996 compared to the pre-crisis period. Examining only those observations for which there
is a listed chairman at the start of the fiscal year, chairman turnover rates increase from
16.8% to 17.7%. In Section 4, we conjecture that this increase in turnover could be related
to declining bank performance in the crisis period. To formally investigate this notion, we
identify bank years for which there is an incumbent chairman and note his tenure in that
office. We then investigate the relation between bank performance and chairman turnover
for this sample of firms. In all specifications, we fail to find a statistically significant
relation between chairman turnover and stock price performance, profitability, or asset
growth in either the pre-crisis period or crisis period. Various methods for addres sing the
effect of chairman tenure and the different rates of turnover at large banks versus regional
banks do not alter the inference that turnover of bank chairmen is unrelated to recent bank
performance.
6. Conclusion
The banking sector plays a prominent role in the Japanese economy and experienced
myriad changes during the past two decades. Such changes include deregulation,
increasing exposure to globalization, the collapse of asset prices in the early 1990s,
the banking crisis that followed, and the decay of the bank-centered keiretsu system of
corporate governance (Hoshi and Kashyap, 2001). In light of the importance of the
banking system in the Japanese economy, the scarcity of empirical evidence on corporate
governance of Japanese banks is conspicuous. In particular, there is little evidence on
how corpor ate governance activity at Japanese banks conditioned or responded to these
events.
We investigate governance activity at over 100 TSE-listed Japanese banks for a 12-year
period centered on the onset of the banking crisis in the early 1990s. External governance
mechanisms appear relatively inactive throughout our sample period. Specifically, own-
ership concentration is largely invariant, top shareholders appear entrenched, and there are
few mergers or failures in spite of the economic shocks associated with the banking crisis.
C.W. Anderson, T.L. Campbell II / Journal of Corporate Finance 10 (2004) 327–354 351