development of a simplified concept for process benchmarking of urban wastewater management xây dựng một phương pháp đơn giản cho benchmarking ngành quản lý nước thải đô thị
Bạn đang xem bản rút gọn của tài liệu. Xem và tải ngay bản đầy đủ của tài liệu tại đây (915.11 KB, 115 trang )
[
Le Quynh Dung
DEVELOPMENT OF A SIMPLIFIED CONCEPT
FOR PROCESS BENCHMARKING OF URBAN
WASTEWATER MANAGEMENT
MASTER THESIS
Hanoi - 2011
DRESDEN UNIVERSITY OF TECHNOLOGY VNU UNIVERSITY OF SCIENCE
[
Le Quynh Dung
DEVELOPMENT OF A SIMPLIFIED CONCEPT
FOR PROCESS BENCHMARKING OF URBAN
WASTEWATER MANAGEMENT
Major: Waste Management and Contaminated Site Treatment
MASTER THESIS
SUPERVISOR: PROF. DR. RER. NAT DR. H. C PETER WERNER
MSC-ENG. PHAN HOANG MAI
Hanoi - 2011
DRESDEN UNIVERSITY OF TECHNOLOGY VNU UNIVERSITY OF SCIENCE
1
TABLE OF CONTENTS
ABBREVIATIONS 3
LIST OF FIGURES AND TABLES 4
ACKNOWLEDGEMENTS 5
INTRODUCTION 6
CHAPTER I 8
Theoretical Foundations of Urban Wastewater Management System 8
1.1 Characteristics of Urban Wastewater 8
1.1.1 What is Urban Wastewater? 8
1.1.2 Constituents of Wastewater 8
1.2 Overview of the Urban Wastewater Management System 22
1.2.1 Components of Urban Wastewater Management System 22
1.2.2 Types of Wastewater Management System 23
1.3 Sub-processes of Wastewater Management System 26
1.3.1 Collection Systems 26
1.3.2 Wastewater Treatment 28
1.3.3 Sludge Treatment and Disposal 36
1.3.4 Effluent Disposal and Reuse 37
1.4 Current situation of Urban Wastewater Management in Vietnam 37
1.4.1 The Development of the Urban Drainage System 37
1.4.2 Current Structure and Operation of Urban Drainage Systems 38
1.4.3 The Organizations of Urban Drainage Services in Vietnam 39
1.4.4 Financial Aspects of Urban Drainage Companies 40
1.4.5 Legal and Institutional Frameworks 40
1.4.6 Investment and Management of Urban Drainage System 41
CHAPTER II 42
Benchmarking in the Urban Wastewater Management Sector 42
2.1 Fundamentals of Benchmarking 42
2.1.1 Definition of benchmarking 42
2.1.2 Types and elements of benchmarking 43
2.2 International Benchmarking System in Water Industry 46
2.2.1 Benchmarking of large Municipal Wastewater Treatment Plants in Austria 46
2.2.2 Benchmarking in Canada 48
2.2.3 North European Benchmarking Co-operation 49
2.3 Process Benchmarking in Wastewater Sector 52
2.3.1 What is Process Benchmarking? 52
2.3.2 The Objectives of Process Benchmarking 52
2.3.3 Methodology in Process benchmarking 53
2.3.4 Different Process Benchmarking Concepts 53
2
CHAPTER III 55
Performance Indicators of Benchmarking in Wastewater Service 55
3.1 Basis of Performance Indicators 55
3.1.1 Systems of Performance Indicators 55
3.1.2 The Usage of Performance Indicators (PIs) 57
3.1.3 Performance Indicators – A component of Benchmarking 59
3.2 The System of IWA-PIs for Wastewater Services 60
3.2.1 Context Information 60
3.2.2 Performance Indicators 62
CHAPTER IV 65
Performance Assessment and Data Collection for Benchmarking in Wastewater Services
of Vietnam 65
4.1 Approach of the Performance Assessment 65
4.1.1 Classification of various Undertakings 65
4.1.2 Performance Indicators 66
4.1.3 Confidence Grades 67
4.1.4 Structure of Questionnaire 67
4.2 Questionnaire of Wastewater Management System 68
4.3 Performance Indicators for Wastewater Management System 79
4.3.1 Environmental Impacts 79
4.3.2 Operation and Maintenance 80
4.3.3 Quality of services 86
4.3.4 Employees 89
4.3.5 Economic and financial aspects 90
4.4 Data Collection 92
CONCLUSIONS 93
REFERENCES 95
APPENDIX 99
3
ABBREVIATIONS
CSOs
CI
EWA
IWA
NEBC
No.
PIs
p.e.
WWTPs
Combined Sewer Overflows
Context Information
European Water Association
International Water Association
North European Benchmarking Co-operation
Number
Performance Indicators
Population Equivalent
Wastewater Treatment Plants
4
LIST OF FIGURES AND TABLES
Figures
Figure 1.1 Representation of a Centralized Wastewater Collection and Treatment
System
Figure 1.2 Representation of a Decentralized Wastewater Collection and Treatment
System
Figure 1.3 Schematic of unit operations and processes in a wastewater treatment plant
Figure 1.4 Schematic of plug flow and complete mix activated sludge process
Figure 1.5 Schematic of trickling filter with rock packing and plastic packing
Figure 2.1 Main steps of a benchmarking process
Figure 2.2 Extended process model for wastewater treatment plants above 100,000 PE
Figure 2.3 Methodology for the development of process performance indicators
Figure 2.4 NEBC’s benchmarking model
Figure 2.5 Procedure of process benchmarking
Figure 3.1 Structure of Wastewater Context Information & Performance Indicator
Figure 3.2 Wastewater undertaking context
Tables
Table 1.1 Principal constituents of concern in wastewater treatment
Table 1.2 Important metals in Wastewater Management
Table 1.3 Comparison of ratios of various parameters used to characterize wastewater
Table 1.4 Typical wastewater flowrates from urban residential sources in the USA
Table 1.5 Typical wastewater flowrates from commercial sources in the USA
Table 1.6 Typical composition of untreated domestic wastewater
Table 1.7 Typical wastewater constituent data for various countries
Table 1.8 Major biological treatment processes used for wastewater treatment
Table 2.1 Holistic approach versus Selective approach in Process benchmarking
Table 3.1 Reliability bands of collected data
Table 3.2 The IWA Performance Indicators
Table 4.1 Summary of Performance Indicators for Urban Wastewater Management
5
ACKNOWLEDGEMENTS
This thesis has been developed in Dresden, Germany with the support of some people
to whom I would like to express my special thanks.
I would like to thank Prof. Nguyen Thi Diem Trang - Hanoi University of Science and
Prof. Bernd Bilitewski - Institute of Waste Management and Contaminated Site Treatment
(IAA), Dresden University of Technology (TUD) as well as DAAD because of giving me the
chance to do my thesis in Germany.
I would like to send my special thanks to Msc. Phan Hoang Mai, (IAA-TUD), who
gave me this topic, supervised and encouraged me to write my thesis. I have learnt some
things for my studying from her.
Also I would like to thank Dr. Catalin Stefan (IAA-TUD) because of his kind help
during the time I was in Dresden. Thanks are also expressed to Msc. Le Thi Hoang Oanh
(IAA-TUD) who was always willing to help me as I need.
Especially, I would like to thank my family and friends, who always support and
encourage me to finish my thesis.
6
INTRODUCTION
Wastewater Management is one of the most concerns in any urban area. An efficient
management contributes to the wealth of a community, never the less a poor management
leads to unpredictable hazards related to health, environmental pollution, etc. In developed
countries, the issues of water and sanitation are solved, floodings are well controlled. However,
the issues of water supply and sanitation are not solved in developing countries, poor
management of floodings as well as improper operation and maintenance of sewer systems are
very popular. Therefore, it is an urgent requirement to improve the system of wastewater
management in developing countries. Benchmarking is promised to be a solution to this
problem as it is always the useful tool for improvement in management.
Benchmarking was first time introduced by Xerox Company in the late 1970s when
their peer company Fuji produced the photocopiers with better quality and lower prices. Xerox
was forced to critically review their products and production costs by adopting the Japanese
philosophy: gaining the best of the bests by learning, adapting and improving (Parena et al.,
2001). That was how benchmarking appeared.
In many countries experiences (Xerox model inspired) have been developed to adapt
benchmarking procedures in the water context (Parena et al., 2001). Benchmarking has been
conducted in many developed countries such as Australia, Canada, England, Germany etc. to
assess the performance of water and wastewater service providers, to estimate the quality of
services as well as the satisfaction of customers. These benchmarking projects have achieved
initial success and are supposed to sustain. Some systems of performance indicators have been
developed with the purpose of large scale application such as the system International Water
Association or Qualserve system, etc. In some developing countries such as India, Vietnam,
etc. certain benchmarking projects regarding the issue of water and sanitation have been
carried out under the support of the World Bank.
Aiming at developing a simplified concept for process benchmarking of urban
wastewater management which can be applied in developing countries, performance indicators
and questionnaire prepared for benchmarking in Vietnam, a representative of developing
7
countries are adapted in this thesis based on the International Water Association (IWA) system
of performance indicators for wastewater services. There are four chapters in the thesis.
Chapter I considers the foundation of urban wastewater management in general and the
current situation of wastewater management in urban areas of Vietnam. In chapter II,
fundamentals of benchmarking and process benchmarking for the water industry are discussed.
To make clear the tool of performance assessment presented in the thesis the performance
indicators for wastewater services of IWA as well as the basis of performance indicators are
given in chapter III. Chapter IV explains the performance indicators selected for process
benchmarking in wastewater services of Vietnam; also, the questionnaire as well as the excel
file to collect data from wastewater undertakings are presented.
Benchmarking of wastewater utilities is emerging as an important tool of performance
improvement by regular monitoring and analyses can be the solution to this reality. It can play
a significant role in the sector as a tool for institutional strengthening. Sustained benchmarking
can help utilities in identifying performance gaps and gaining improvements by the sharing of
information and best practices, ultimately resulting in better services to people. It is expected
that benchmarking in wastewater services in developing countries will soon be supported to
implement.
8
CHAPTER I
Theoretical Foundations of Urban Wastewater Management System
In this chapter the theoretical foundations of urban wastewater management will be
considered, including: (1) characteristics of urban wastewater, (2) overview of the urban
wastewater management system, (3) sub-processes of wastewater management system and (4)
current situation of urban wastewater management in Vietnam.
1.1 Characteristics of Urban Wastewater
1.1.1 What is Urban Wastewater?
According to Tchobanoglous et al. 2003, urban wastewater components may vary
depending on type of collection system and may include:
1. Domestic (sanitary) wastewater. Wastewater discharged from residential areas, and
from commercial, institutional and similar facilities.
2. Industrial wastewater. Wastewater in which industrial wastes predominate.
3. Stormwater. Runoff resulting from rainfall
4. Infiltration/Inflow. Water that enters the collection system through indirect and
direct means. Infiltration is extraneous water that enters the collection system through
leaking joints, cracks and breaks, or porous walls. Inflow is stormwater that enters the
collection system from storm drain connections, roof leaders, foundation and basement
drains, or through access port (manhole) covers.
1.1.2 Constituents of Wastewater
The constituents of wastewater can be classified as physical, chemical and biological.
Of the constituents listed in table 1.1, suspended solids, biodegradable organics and pathogen
organisms the most concerning ones are referred. All wastewater treatment facilities are
designed to remove these constituents completely.
1.1.2.1 Physical Characteristics
Solids
There are many kind of solids present in wastewater, varying from coarse to colloidal
ones. Before any analysis of solids in wastewater the coarse material should be removed. In
wastewater treatment, the solids can be classified by their size and state (suspended solids &
9
dissolved solids), by their chemical characteristics (volatile & fixed solids) and by settleability
(settable suspended solids & non-settable suspended solids) (Sperling, 2007)
Table 1.1 Principal constituents of concern in wastewater treatment
a
Constituents Reason for Concern
Total suspended solids Sludge deposits and anaerobic conditions
Biodegradable organics Depletion of natural oxygen resources and the
development of septic conditions
Dissolved inorganics (e.g. total
dissolved solids)
Inorganic constituents added by usage. Recycling and
reuse applications
Heavy metals Metallic constituents added by usage. Many metals are
also classified as priority pollutants
Nutrients Excessive growth of undesirable aquatic life,
eutrophication, nitrate contamination of drinking water
Pathogens Communicable diseases
Priority organic pollutants Suspected carcinogenicity, mutagenicity, teratogenicity, or
high acute toxicity. Many priority pollutants resist
conventional treatment methods (known as refractory
organics)
a: From Crites & Tchobanoglous, 1998
Particle Size Distribution
The determination of particle size is to understand more about nature of particles
composing TSS in wastewater. In addition, this analysis is also used to assess the effectiveness
of treatment process (biological treatment, disinfection process, sedimentation, etc).
Turbidity
Turbidity is a measure of the light-transmitting properties of water. Turbidity is used to
indicate the quality of waste discharges and natural waters regarding colloidal and residual
suspended matter (Tchobanoglous et al., 2003).
Color
Color in wastewater is caused by suspended solids, colloidal matters and dissolved
substances. With suspended solids, it is called apparent color whereas true color is caused by
colloidal matters and dissolved substances.
10
The sources of color in wastewater include infiltration/inflow (humic substances),
industrial discharges (e.g. dyes or metallic compounds, etc) and the decomposition of organic
compounds in wastewater.
Transmittance/ Absorption
Transmittance is the ability of a liquid to transmit light of a specified wavelength
through a known depth of solution. Absorbance is the loss of radiant energy as light pass
through a fluid (Tchobanoglous et al., 2003).
The components that affect transmittance include selected inorganic compounds (e.g.
iron and copper), organic compounds (e.g. organic dyes, humic substances, and conjugated
ring compounds such as benzene), and TSS (Tchobanoglous et al., 2003).
Odor
Variety of malodorous compounds released under anaerobic conditions in biological
process of wastewater treatment.
The typical compound that cause bad odor is hydrogen sulfide. Other compounds such
as indole, skatole and mercaptanes, in anaerobic conditions may cause odors that are much
more offensive than that of hydrogen sulfide.
Temperature
The measurement of temperature is very important because most wastewater treatment
facilities include the biological step, a temperature-dependent process. The temperature of
wastewater depends on season and location. In cold regions, the temperature will vary from 7
to 18
0
C, in warmer regions it will vary from 13 to 30
0
C.
Temperature is a fatal parameter in water because it affects the chemical reactions,
reaction rates and aquatic life. The change in temperature can be a significant factor for the
survival of a means of fish species. In addition, higher temperature means lower dissolved
oxygen in water. The increase in biochemical reaction rate due to higher temperature probably
leads to the depletion of oxygen in water (Tchobanoglous et al., 1998).
Density, Specific Gravity and Specific Weight
The density of wastewater, ρ
w
is defined as its mass per unit volume expressed as g/l or
kg/m
3
(SI). Density is an important parameter because it is needed for the design of some
treatment units such as sedimentation tanks, constructed wetland, etc.
11
Conductivity
The electrical conductivity (EC) of a liquid is the ability of that liquid to conduct an
electrical current. Because the electricity is transported by ions in solution, the measured value
of EC is used to determine the concentration of total dissolved solids.
The electrical conductivity is expressed in SI units as millisiemens per meter (mS/m).
1.1.2.2 Inorganic Chemical Characteristics
The chemical constituents of wastewater can be classified as inorganic and organic. In
this section, the inorganic constituents are considered.
pH value
pH is a convenient measure of the acidity/alkalinity of an aqueous solution at a
specified temperature, usually 20
0
C or 25
0
C. It is typically measured on a continuous scale
from 0 to 14 (Prichard et al., 2003). The pH is defined as the negative logarithm of the
hydrogen-ion concentration:
pH = -lg [H
+
]
The suitable range for the existence of most biological life is very narrow, typically
between pH 5 and 9. If the pH value of wastewater is below 5 and greater than 9, it is difficult
for the activity of microorganisms in biological treatment. Without adjustment of pH most
effluent from domestic wastewater treatment facilities will alter the pH of receiving water
(Tchobanoglous et al., 1998).
Nitrogen
Nitrogen and phosphorus are essential nutrients for biological growth or biostimulants.
Because nitrogen is a building block in the synthesis of protein, sufficient nitrogen is required
to make wastewater treatable. All kinds of nitrogen present in wastewater are ammonia, nitrite,
nitrate, and organic nitrogen. Organic nitrogen corresponds to amina groups (Sperling, 2007).
Ammonia exists in aqueous solution in two forms the ammonium ion or ammonia gas,
depending on the pH of solution as the following equilibrium reaction:
NH
4
+
+ OH
-
↔ NH
3
+ H
2
O
At pH levels above 9.3, ammonia gas is predominant; at level below 9.3 the ammonium ion is
major.
Nitrite nitrogen is an unstable form, easily oxidized to nitrate form. Although present
in wastewater at low concentration nitrite can be very important because it is toxic with almost
12
fish and other aquatic species. In wastewater, the concentration of nitrite seldom exceeds
1mg/l (Tchobanoglous et al., 1998).
Nitrate nitrogen, the highest oxidized form of nitrogen found in wastewater becomes
toxic only under conditions in which it is reduced to nitrite. Therefore it is important when
effluent from wastewater treatment is used as recharge for ground water. Nitrate can be a very
serious problem because it causes blue baby syndrome or methemoglobinemia in young
infants at a certain concentration. Nitrate varies from 2 to 30 mg/l as N in wastewater effluents
(Tchobanoglous et al., 1998).
Phosphorus
Phosphorus is also an essential nutrient to the growth of biological organisms but the
assimilation of phosphorus in water bodies causes the problem of eutrophication. In effort to
prevent the eutrophication of water bodies, phosphorus in domestic and industrial wastewater
and natural runoff is concerned
The usual forms of phosphorus found in aqueous solution are orthophosphate,
polyphosphate and organic phosphate. The orthophosphates (e.g. PO
4
3-
, HPO
4
2-
, H
2
PO
4
-
,
H
3
PO
4
and HPO
4
2-
complexes) can be absorbed by organisms without any breakdown.
Polyphosphates convert to orthophosphate by hydrolysis process but this process is normally
quite slow. Organic phosphate can be an important constituent in industrial wastewater and
wastewater sludges (Tchobanoglous et al., 1998).
Alkalinity
Alkalinity of a solution is the ability of acid-neutralizing of that solution.
Alkalinity in wastewater results from the presence of the hydroxides [OH
-
], carbonates
[CO
3
2-
], and bicarbonates [HCO
3
-
] of elements such as calcium, magnesium, sodium,
potassium. Of these elements, calcium and magnesium are the most common. Borates,
silicates, phosphates and some similar compounds can cause alkalinity but insignificantly;
perhaps in industrial or agricultural wastewater (Tchobanoglous et al., 1998).
Wastewater is normally alkaline; this alkalinity comes from water supply, the
groundwater and domestic use.
For most practical purposes alkalinity can be defined in terms of molar quantities as:
[Alk], mole/l = [HCO
3
-
] + [CO
3
2-
] + [OH
-
] - [H
+
]
In terms of equivalents:
13
[Alk], eq/m
3
= meq/l = [HCO
3
-
] + 2[CO
3
2-
] + [OH
-
] - [H
+
]
Chlorides
The chloride concentration in wastewater is an important parameter with respect to the
reuse of wastewater. Chlorides in wastewater result from the usage.
Because conventional wastewater treatment method does not remove chloride to any
significant extent, the higher than usual concentration of chloride can be an indication that the
water body is being used to dispose treated wastewater.
Sulfur
The sulfate ion occurs naturally in most water supplies and as a result is present in
wastewater. Sulfur is required in the synthesis of proteins and released during the digestion of
proteins. Sulfate is reduced biologically to sulfide under anaerobic condition, and then sulfide
combines with hydrogen to form hydrogen sulfide.
Hydrogen sulfide is concerned because of the oxidation to sulfuric acid which is
corrosive to concrete sewer pipes. Hydrogen sulfide gas accumulated at the crown of the pipe
due to the not flowing full of the sewer pipe can be oxidized biologically to sulfuric acid,
which is corrosive to concrete sewer pipes. Also in digester H
2
S is corrosive to gas piping
(Tchobanoglous et al., 2003). Sulfates are reduced to sulfides in sludge digester can upset the
process if the concentration exceeds 200 mg/l (Tchobanoglous et al., 1998).
Metals
All living organisms require an amount of metallic compounds (from micro to macro)
such as iron, copper, zinc…for proper growth. Though certain amounts of metals are
necessary, the elevated concentration of them can be toxic to all kinds of creatures. Therefore,
metals are always the concern in wastewater treatment (Tchobanoglous et al., 1998).
The sources of metals in wastewater include residential areas, groundwater infiltration,
commercial and industrial discharges.
The importance of metals are given in table 1.2
14
Table 1.2 Important metals in wastewater management
a
Metal
Symbol
Nutrients necessary
for biological growth
Concentration
thresholds of
inhibitory effect
on heterotrophic
organisms (mg/l)
Used to
determine
whether biosolids
are suitable for
land application
Macro
Micro
b
Arsenic
Cadmium
Calcium
Chromium
Cobalt
Copper
Iron
Lead
Magnesium
Manganese
Mercury
Molybdenum
Nickel
Potassium
Selenium
Sodium
Tungsten
Vanadium
Zinc
As
Cd
Ca
Cr
Co
Cu
Fe
Pb
Mg
Mn
Hg
Mo
Ni
K
Se
Na
W
V
Zn
x
x
x
x
x
x
x
x
x
x
x
x
x
x
x
x
x
0.05
1.0
10
c
, 1
d
1.0
0.1
0.1
1.0
1.0
x
x
x
x
x
x
x
x
x
a: From Tchobanoglous et al. 1998
b: often identified as trace elements needed for biological growth
c: total chromium
d: hexavalent chromium
Gases
Measurements of dissolved gases, such as ammonia, carbon dioxide, hydrogen sulfide,
methane, oxygen are important in the operation of wastewater treatment systems e.g. to
control the work of anaerobic process,…
Henry’s law is the basis to consider the activity of dissolved gas in water. Henry’s law
(More et al., 2008) expresses the relationship between gas pressure and solubility as follow:
S
g
= k
H
* P
g
Where: S
g
: the solubility of the gas in the liquid [mol/m
3
]
P
g
: the pressure of the gas above the solution (or the partial pressure of the gas if the
solution is in contact with a mixture of gases) [Pa]
15
k
H
: Henry constant (depends on temperature as well as characteristics of the gas and
the liquid) [Pa m
3
/mol]
1.1.2.3 Organic Compounds Characteristics
Purposes of the analyses of aggregate organic constituents are to characterize untreated
and treated wastewater, to assess the performance of treatment process and to study receiving
waters. In this section biochemical oxygen demand (BOD), chemical oxygen demand (COD),
total organic carbon (TOC), oil and grease and surfactants are discussed.
Biochemical Oxygen Demand (BOD)
The most used parameter of organic pollution applied to both wastewater and surface
water is the 5-day BOD (BOD
5
). This determination involves the measurement of the
dissolved oxygen used by microorganisms in the biochemical oxidation of organic matter.
The normal incubation time for BOD test is normally 5 or 7 days at 20
0
C, but other
length of time or temperature can be used.
Chemical Oxygen Demand (COD)
“The COD test is used to measure the oxygen equivalent of the organic material in
wastewater that can be oxidized chemically by using dichromate in an acid solution”
(Tchobanoglous et al., 1998)
An advantage of COD test is that it can complete in 2.5 hours (compare to 5-day test of
BOD)
Total Organic Carbon (TOC)
The TOC test is used to determine the total organic carbon in a sample. The TOC value
of a wastewater sample can be used to assess its pollutional characteristics or sometimes to
relate TOC to BOD and COD. TOC test is also in favor because it only takes 5-10 minutes to
get the result. If a reasonable relationship between TOC and BOD can be established in a
wastewater sample, use of TOC test is recommended.
The relationship of BOD, COD and TOC
There are interrelationships between BOD/COD and BOD/TOC and they are shown in
table 1.3. This relationship can be used to determine whether a wastewater sample can be
treated by biological process or not. For example, if the BOD/COD ratio of wastewater is 0.5
16
or greater, it can be treated biologically; if this ratio is below about 0.3, the sample needed to
be treated before any biological process.
Table 1.3 Comparison of ratios of various parameters used to characterize wastewater
a
Type of wastewater BOD/COD BOD/TOC
Untreated 0.3-0.8 1.2-2.0
After primary settling 0.4-0.6 0.8-1.2
Final effluent 0.1-0.3
b
0.2-0.5
c
a: From Tchobanoglous et al., 2003
b:CBOD / COD (CBOD: Carbonaceous Biological Oxygen Demand – the oxygen demand
exerted by oxidizable carbon in the sample when the nitrification occurs.)
c:CBOD / TOC
Oil and Grease
“The term oil and grease as commonly used, includes fats, oils, waxes and other
related constituents found in wastewater.” (Tchobanoglous et al., 1998)
The sources of fats and oil contributed to domestic wastewater includes: butter,
margarine, vegetable fats and oils. Fats can be found in meats, in cereals, in seeds, in nuts and
in certain fruits (Tchobanoglous et al., 2003)
Oil and grease in liquid form may not appear to be harmful but as being cooled it
becomes solids and causes many problems. It sticks to inner lining of drainage pipes and
restrains the flow leading to blockages in sewers. These blockages can cause the flooding in
sewer and odor problems (Best Management Practice for Catering Outlets, Welsh Water –
Water UK).
Surfactants
Surfactants are organic molecules that are composed of strongly hydrophobic
(insoluble in water) and hydrophilic group (soluble in water).
The presence of surfactants in wastewater results from household detergents, laundry
industries, and other cleaning operations. Surfactants tend to collect at the air-water interface
and can cause foaming in wastewater treatment facilities or at the surface of discharge
receiving water.
1.1.2.4 Biological Characteristics
Biological characteristics of wastewater are in major importance not only because of
the hygienic issues but also the significance of microorganisms in water and wastewater
17
treatment. In this section, these following subjects will be discussed: (1) microorganisms
found in wastewater, (2) pathogenic organisms related to human diseases, and (3) the use of
indicator organisms.
Microorganisms found in wastewater
The microorganisms found in wastewater can be classified as eukaryotes, eubacteria
and archaea. Their cell structure, typical size, characterization and representative member are
illustrated in table 1 (appendix).
Pathogenic Microorganisms
Pathogens found in wastewater may be discharged by human who are suffering with
diseases or who are carriers of a particular disease. The pathogenic microorganisms found in
wastewater can be classified into three broad categories: bacteria, parasites (protozoa and
helminths) and viruses.
Bacteria
There are many types of harmless bacteria in human intestinal track and human feces.
Pathogens are only found in the infected humans feces therefore wastewater contain both
pathogenic and nonpathogenic bacteria
One of the most common pathogenic organisms found in domestic wastewater is the
genus Salmonella. The Salmonella group contains variety species causing diseases to human
and animals. Other bacteria isolated from raw wastewater which causes cholera is Vibrio
cholerae.
Protozoa
Because of their significant impact on individuals with compromised immune systems
including very young children, persons with cancer and individuals with AIDS,
Cryptosporidium parvum, Cyclospora and Giardia lamblia are the most concerning protozoan.
It is important to note that these protozoans are found in wastewater because conventional
disinfection techniques (UV radiation or chlorine) have not proven their inactivation or
destruction.
Helminths
The most important helminthic parasites probably found in wastewater are intestinal
worms. The infective stage of some helminths is adult organisms or larvae. The eggs and
larvae with the size from 10 µm to more than 100 µm are resistant to environmental stresses
18
and survive normal disinfection procedures though eggs can be removed by common
treatment processes such as sedimentation, filtration (Tchobanoglous et al., 1998).
Viruses
More than hundred types of enteric viruses capable of producing infection or disease
are released in the fecal matter of infected humans. Of the most important human enteric
viruses, only Norwalk virus and rotavirus which cause diarrheal disease have been shown to
be major waterborne pathogens (Tchobanoglous et al., 1998).
Use of Indicator Organisms
The Coliform organism which is numerous and easily tested for is commonly used as
an indicator organism. Each person discharges from 100 to 400 billion Coliform bacteria with
other kinds of bacteria per day. Therefore, the presence of Coliform bacteria can be an
indication that other pathogens may be present.
Easy and common but the limitation of Coliform test is that it only indicates for the
presence of pathogenic bacteria and viruses, not for waterborne protozoa or pathogenic
organisms that may arise from nonhuman sources. Therefore the use of new indicator
bacteriophages is much more concerned (Tchobanoglous et al., 1998).
1.1.3 Flowrates and Composition of Wastewater
The analysis of wastewater data involves the determination of the flowrate and mass
loading variations. From the standpoint of treatment processes, average flowrates and average
BOD and TSS loadings are two of the most concerning parameter in design (Tchobanoglous et
al., 2003). In this section, flowrates and composition of wastewater will be considered.
1.1.3.1 Wastewater Flowrates
The hydraulic design of both collection and treatment facilities is influenced by
variations in wastewater flowrates; therefore the flowrate characteristics have to be analyzed
carefully.
Wastewater flowrates vary during the day, day of the week, season of the year or
depend on the sources of discharge to the collection system. Short-term variations have diurnal
pattern which minimum flows occur during the early morning, the first and the second peak
flows occur in late morning and early evening respectively. Seasonal variations are normally
observed in small communities with college campuses and in communities which have
seasonal commercial and industrial activities. Industrial variations are difficult to predict and
19
the most troublesome in smaller wastewater treatment plants where the loading capacity is
limited (Tchobanoglous et al., 2003).
The principal sources of domestic wastewater in a community are the residential areas
and commercial districts. Data on ranges and typical flowrate values from urban residential
and commercial sources in the United States are illustrated in table 1.4 and 1.5 as followings.
Table 1.4 Typical wastewater flowrates from urban residential sources in the USA
a
Household size
no. of persons
Flowrate, L/capita.d
Range Typical
1 285-490 365
2 225-385 288
3 194-335 250
4 155-268 200
5 150-260 193
6 147-253 189
7 140-244 182
8 135-233 174
a: From Tchobanoglous et al., 2003.
20
Table 1.5 Typical wastewater flowrates from commercial sources in the USA
a
Source Unit
Flowrate, L/unit.d
Range Typical
Airport Passenger 11-19 15
Apartment Bedroom 380-570 450
Automobile service station Vehicle served 30-57 40
Employee 34-57 50
Bar/cocktail lounge Seat 45-95 80
Employee 38-60 50
Boarding house Person 95-250 170
Conference center Person 40-60 30
Department store Toilet room 1300-2300 1500
Employee 30-57 40
Hotel Guest 150-230 190
Employee 30-57 40
Industrial building
(sanitary waste only)
Employee
57-130 75
Laundry (self-service) Machine 1500-2100 1700
Customer 170-210 190
Mobile home park Unit 470-570 530
Motel (with kitchen) Guest 210-340 230
Motel (without kitchen) Guest 190-290 210
Office Employee 26-60 50
Public lavatory User 11-19 15
Restaurant
Conventional Customer 26-40 35
With bar/cocktail lounge Customer 34-45 40
Shopping center Employee 26-50 40
Parking space 4-11 8
Theater (indoor) Seat 8-15 10
a: From Tchobanoglous et al., 2003.
1.1.3.2 Composition of Wastewater
The principal factors responsible for variations of loading are (1) the established habits
of community residents which cause short-term variations, (2) seasonal changes which often
cause long-term variations and (3) industrial activities which cause both long and short-term
variations.
Typical data on the composition of raw domestic wastewater found in wastewater
collection systems in the USA is presented in table 1.6. It should be noted that there is no
“typical” wastewater therefore the data in this table is only used as a guide. The amounts of
wastewater discharged by individuals in countries can vary significantly because of
21
differences in culture and socioeconomic conditions. The comparison between wastewater
discharged by individuals in the USA and other countries is illustrated in table 1.7.
Table 1.6 Typical composition of untreated domestic wastewater
a
Contaminants Unit
Concentration
b
Low
strength
Medium
strength
High
strength
Solids, total (TS) mg/L 390 720 1230
Dissolved, total (TDS) mg/L 270 500 860
Fixed mg/L 160 300 520
Volatile mg/L 110 200 340
Suspended solids, total (TSS) mg/L 120 210 400
Fixed mg/L 25 50 85
Volatile mg/L 95 160 315
Settleable solids mg/L 5 10 20
Biochemical oxygen demand 5-
d, 20
0
C (BOD
5
, 20
0
C)
mg/L 110 190 350
Total organic carbon (TOC) mg/L 80 140 260
Chemical oxygen demand
(COD)
mg/L
250 430 800
Nitrogen (total as N) mg/L 20 40 70
Organic mg/L 8 15 25
Free ammonia mg/L 12 25 45
Nitrites mg/L 0 0 0
Nitrates mg/L 0 0 0
Phosphorus (total as P) mg/L 4 7 12
Organic mg/L 1 2 4
Inorganic mg/L 3 5 10
Chlorides
c
mg/L 30 50 90
Sulfates
c
mg/L 20 30 50
Oil & grease mg/L 50 90 100
Volatile organic compounds
(VOCs)
mg/L < 100 100-400 > 400
Total Coliform No./100ml 10
6
-10
8
10
7
-10
9
10
7
-10
10
Fecal Coliform No./100ml 10
3
-10
5
10
4
-10
6
10
5
-10
8
Cryptosporidum oocysts No./100ml 10
-1
-10
0
10
-1
-10
1
10
-1
-10
2
Giardia lamblia cysts No./100ml 10
-1
-10
1
10
-1
-10
2
10
-1
-10
3
a: From Tchobanoglous et al., 2003
b: Low strength is based on an approximate wastewater flowrate of 750 L/capita.d
Medium strength is based on an approximate wastewater flowrate of 460 L/capita.d
High strength is based on an approximate wastewater flowrate of 240 L/capita.d
c: Values should be increased by amount of constituent present in domestic waster supply
22
Table 1.7 Typical wastewater constituent data for various countries
a
Country/
Constituent
BOD
g/capita.d
TSS
g/capita.d
TKN
g/capita.d
NH
3
-N
g/capita.d
Total P
g/capita.d
Brazil 55-68 55-68 8-14 ND 0.6-1
Denmark 55-68 82-96 14-19 ND 1.5-2
Egypt 27-41 41-68 8-14 ND 0.4-0.6
Germany 55-68 82-96 11-16 ND 1.2-1.6
Greece 55-60 ND ND 8-10 1.2-1.5
India 27-41 ND ND ND ND
Italy 49-60 55-82 8-14 ND 0.6-1
Japan 40-45 ND 1-3 ND 0.15-0.4
Palestine 32-68 52-72 4-7 3-5 0.4-0.7
Sweden 68-82 82-96 11-16 ND 0.8-1.2
Turkey 27-50 41-68 8-14 9-11 0.4-2
Uganda 55-68 41-55 8-14 ND 0.4-0.6
United States 50-120 60-150 9-22 5-12 2.7-4.5
a: From Tchobanoglous et al., 2003
1.2 Overview of the Urban Wastewater Management System
1.2.1 Components of Urban Wastewater Management System
Wastewater Management System includes three main components: (1) collection, (2)
treatment and (3) disposal or reuse.
The first step in any wastewater management system of a community is the collection
and conveyance of wastewater from various sources. The pipes that collect and transport away
wastewater from its sources are called sewers and the network of sewers is a collection system
(George Tchobanoglous, 1981). Most sewers are placed underground to prevent interference
due to repair of this system (Punmia and Jain, 1998). The types of collection systems will be
discussed later.
Treatment is an essential step in a wastewater management system. This step not only
reduces the amount of pollutants coming into the environment but also protects humans from
pathogens (Punmia and Jain, 1998). The treatment of wastewater is carried out by
combination of many unit processes. The methods of treatment are various, including
mechanical, physical, chemical, biological methods or the combination of these ones such as
physiochemical method etc. The variety of these methods will be considered in following
sections.
23
After treatment, water will be disposed or reused. The disposal of treated effluent is
related very closely to self-purification of water bodies. Based on the selected receiving water
or effluent standard engineers will decide the degree of treatment and type of plant required.
Treated wastewater can be discharged into lakes, rivers or the ocean. The reuse of treated
effluent can be applied for groundwater recharge, irrigation, etc. These issues will be referred
later.
1.2.2 Types of Wastewater Management System
There are two typical types of wastewater management system, including centralized
and decentralized model. The former one is the traditional system and applied successfully in
many industrialized countries over decades. However, the cost of investment and
implementation of this system is a big problem for any community. Decentralized wastewater
systems in which wastewater are treated near the source of generation are getting more
concern as a potential alternative of traditional centralized wastewater management system.
These two wastewater management systems will be discussed as followings.
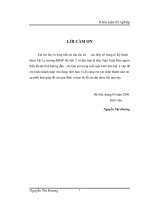
Centralized Wastewater Management
Figure1.1 Representation of a Centralized Wastewater Collection and Treatment System
(Source: Wilderer and Schreff, 2000)
Centralized wastewater management is used to describe the system consisting of a
collection system that collect all wastewater from households, industrial zones, small
enterprises, storm water runoff and convey to the treatment plant located very far or outside
the city or village boundary (fig. 1.1). The treated wastewater which meets the standard will be
discharged to the closest receiving water. The remaining part after eliminating pollutants from