Chapter 14 investments financial statement analysis
Bạn đang xem bản rút gọn của tài liệu. Xem và tải ngay bản đầy đủ của tài liệu tại đây (1.88 MB, 33 trang )
Chapter 14
Financial Statement Analysis
14.1 The Major Financial Statements
Income statement
Balance sheet
Statement of cash flows
14-2
Income Statement
•
Four broad types of accounts:
- Cost of goods sold
- General and administrative expenses
- Interest expense
- Taxes on earnings
•
Common Size income statements
- Divide each account by net sales
- Eliminates size distortions
14-3
Table 14.1 Consolidated Statement of Income
14-4
Balance Sheet
•
Assets
- Current: Converted into cash within 1 year.
- Long-term
•
Liability (current and long term) and stockholders’ equity
•
Common size balance sheet
- Divide each account by total assets
- Each account presented as a percent of the total
14-5
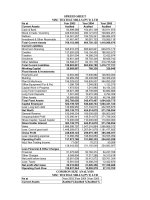
Table 14.2 Consolidated Balance Sheet A
14-6
Table 14.2 Consolidated Balance Sheet B
14-7
Statement of Cash Flows
•
A financial statement showing a firm’s cash receipts and cash payments during a specified pe
riod.
- Recognizes transactions only if cash changes hands.
-
“Undoes” much of accrual accounting to get at cash
changes.
- Does not allocate capital expenditures through time via depreciation as income statement does.
14-8
Statement of Cash Flows
Three main sections
•
Cash flow related to operations
•
Cash flow related to investing
•
Cash flow related to financing
•
Allows the analyst to understand which of the firm’s activities are using and which generating cash.
14-9
Statement of Cash Flows
•
Not all sources of cash are equally sustainable.
•
Would you rather invest in a firm that is primarily generating cash through operations or through financing?
•
It is difficult to evaluate whether the amount of cash flow related to investing is ‘good’ or ‘bad.’ What else woul
d we need to know?
•
Rate of return on the investment
•
Comparable data over time or from competitors
14-10
Table 14.3 Consolidated Statement of Cash Flows
14-11
14.2 Accounting Versus Economic Earnings
14-12
Accounting Versus Economic Earnings
•
Accounting earnings
•
Earnings of a firm as reported on its income statement
•
Economic earnings
•
The real flow of cash that firm could pay out to its stockholders without impairing its productive capacity.
14-13
14.3 Profitability Measures
14-14
Past Versus Future ROE
ROE = Net Profits / Equity
•
Data from recent past may provide information regarding future ROE
•
Analysts should always keep an eye on the future
•
Expectations of future dividends and earnings determine intrinsic value of stock
14-15
Financial Leverage and ROE
•
Pay careful attention to the firm’s debt-equity mix and to the interest rate on its debt.
•
The relationship among ROE, ROA, and leverage:
•
ROE = Net Profits / Equity
•
ROA = EBIT / Total Assets
•
If ROA > the borrowing rate, the firm earns more on its money than it pays out to creditors.
•
If ROA< the interest rate paid on debt, ROE will decline by an amount that depends on the debt/equit
y.
14-16
(1 Tax rate) ( Interest rate)
Debt
ROE ROA ROA
Equity
= − + −
Financial Leverage and ROE
14-18
Nodett: All equity nanced; Total assets of $100M; 40%
of corporate tax.
Somdett: 40% debt nancing of $100M assets; Interest rate of
8%
14.4 Ratio Analysis
14-19
Ratio Analysis
•
Purpose of Ratio Analysis
- Understand the factors that affect performance
•
Methods
- Trend analysis
- Comparative analysis
- Combination of the two
•
Use by External Analysts
- Important information for investment community
- Important for credit markets
14-20
DuPont Decomposition of ROE
ROE can be decomposed into various ratios that reflect different aspects of a firm’s
performance:
14-21
Burden Burden
Leverage Turnover Margin Interest Tax
(5) (4) (3) (2) (1)
Assets
Sales
Sales
EBIT
EBIT
ProfitPretax
ProfitPretax
ProfitNet
ROE
××××
××××
××××=
Equity
Assets
Type of Financial Ratios
•
Ratio (1) Tax Burden (TB):
- Measures the percentage of pretax profit that the firm keeps after paying taxes
•
Ratio (2) Interest Burden (IB):
- Measures the percent of EBIT kept after paying interest expense
-
-
This ratio is 1 if the firm has no debt
- Closely related to the interest coverage ratio, defined as EBIT/Interest expense
14-22
EBIT
Expense InterestEBIT
EBIT
ProfitPretax −
=
Burden Burden
Leverage Turnover Margin Interest Tax
(5) (4) (3) (2) (1)
Assets
Sales
Sales
EBIT
EBIT
ProfitPretax
ProfitPretax
ProfitNet
ROE
××××
××××
××××=
Equity
Assets
Type of Financial Ratios
•
Ratio (3) Operating Profit Margin
-
Measures the percentage of sales revenue that remains after subtracting cost of
goods sold, selling and administrative expenses and depreciation.
•
Ratio (4) Asset Turnover Ratio (ATO)
-
Measures the efficiency of the firm at generating sales per dollar invested in assets.
- Note: Margin x ATO = ROA
14-23
Burden Burden
Leverage Turnover Margin Interest Tax
(5) (4) (3) (2) (1)
Assets
Sales
Sales
EBIT
EBIT
ProfitPretax
ProfitPretax
ProfitNet
ROE
××××
××××
××××=
Equity
Assets
Type of Financial Ratios
•
Ratio (5) Leverage ratio
- Leverage ratio = (Equity + Debt) / Equity = 1 + (Debt / Equity)
-
The leverage ratio is a measure of the percentage of debt in total capitalization.
-
Note that it appears that using more debt as a percent of capital will
increase ROE, but using more debt also reduces the interest burden ratio
14-24
Burden Burden
Leverage Turnover Margin Interest Tax
(5) (4) (3) (2) (1)
Equity
Assets
Assets
Sales
Sales
EBIT
EBIT
ProfitPretax
ProfitPretax
Profit Net
ROE
××××
××××
××××=
Type of Financial Ratios
•
Ratio (5) Leverage ratio
- Compound leverage factor (CLF) = Interest burden x Leverage
- If the CLF > 1, the use of debt will increase ROE
- If the CLF < 1, the use of debt will decrease ROE
- CLF will be greater than 1 if ROA > Interest rate on debt
- What does this imply about when firms should use more debt?
14-25
Burden Burden
Leverage Turnover Margin Interest Tax
(5) (4) (3) (2) (1)
Equity
Assets
Assets
Sales
Sales
EBIT
EBIT
ProfitPretax
ProfitPretax
Profit Net
ROE
××××
××××
××××=
Sample ROE Decomposition
Compare two firms, Nodett and Somdett
14-26