Bài toán mô phỏng xử lý tín hiệu số DSP trong hệ định vị vô tuyến radar = DSP Simulations in Radar System.PDF
Bạn đang xem bản rút gọn của tài liệu. Xem và tải ngay bản đầy đủ của tài liệu tại đây (10.75 MB, 32 trang )
ĐẠI HỌC QUỐC GIA HÀ NỘI
TRƯỜNG ĐẠI HỌC KHOA HỌC Tự NHIÊN
BÀI TOÁN MỒ PHỎNG x ử LÝ TÍN HIỆU s ố DSP
TRONG HỆ ĐỊNH VỊ VÔ TUYẾN RADAR
(DSP simulations in Radar System)
MÃ SỐ : QT-06-07
CHỦ TRÌ ĐỂ T À I: THS. Đ ỗ TRUNG KIÊN
CÁC CÁN B ộ THAM GIA: THS. TRẦN VĨNH THẮNG
CN. LÊ QUANG THẢO
CN. NGUYỄN ANH ĐỨC
THÂN THANH ANH TUÂN
O A I HOC QUOC G IA HÁ NO '
TRUNG TẦM THÔNG TIN THƯ VIỀN
DT7 m 2
HÀ NỘI - 2006
1
1. Báo cáo tóm tắt (tiếng Việt)
a. Tên đề tài, mã số
BÀI TOÁN MÔ PHỎNG x ử LÝ TÍN HIỆU số DSP TRONG HỆ ĐỊNH VỊ VÔ TUYÊN
Mã số : QT-06-07
b. Chủ trì đề tài
ThS. ĐỖ Trung Kiên, Khoa Vật lý, Trường ĐHKHTN
c. Các cán bộ tham gia
ThS. Trần Vĩnh Thắng
CN. Lê Quang Thảo
CN. Nguyễn Anh Đức
Thân Thanh Anh Tuấn, K48
d. Mục tiêu và nội dung nghiên cứu
Thực hiện thuật toán xử lý tín hiệu siêu cao tẩn radar trên môi trường mô phỏng
e. Các kết quả đạt được
■ 01 báo cáo Hội nghị Vô tuyến toàn quốc, REV2006:
Estimation of Radar Detection and False Alarm Probability in the Presence
of Noise.
■ 02 bài báo Tạp chí Khoa học VNU, 2006:
Design waveform generators and filters in radar system
Radar digital filters using TMS320C6416T DSK
f. Tình hình kinh phí của đề tài
Chi phí hết kinh phí tạm ứng của đề tài là: 15.000.000VNĐ
- Thuê khoán chuyên môn: 9.000.000VNĐ
Seminar 500.000VNĐ
Dịch vụ Internet 1.100.000VNĐ
Mua sắm vặt tư, linh kiện điện tử 3.212.000VNĐ
Chi phí điện, nước, cơ sở vật chất 600.000VNĐ
- Quản lý phí 600.000VNĐ
KHOA QUẢN LÝ
CHỦ TRÌ ĐỂ TÀI
fCs^S, TS. Nguyễn Thế Bình ThS. Đỗ Trung Kiên
TRƯỜNG ĐAI HOC KHOA HỌC T ự NHIÊN
HIẼU iruóng
<J T ự N HIB W ,/• J -
-
tìS.TS? ĩ& ú v r v
2
2. Summary (by English)
a. Project, code
DSP Simulations in Radar System
Code : QT-06-07
b. Main responsible person
MS. Do Trung Kien, Faculty of Physics,
Hanoi University of Science (HUS), Hanoi National University
c. Incorporated members
MS. Tran Vinh Thang
BA. Le Quang Thao
BA. Nguyen Anh Due
Than Thanh Anh Tuan, K48
d. Purposes và contents
Simulation of Radar Ultra-High Frequency Digital Signal Processing
e. Results
■ 01 report: Biennial Vietnam Conference on Radio & Electronics (REV 2006)
- Estimation of Radar Detection and False Alarm Probability in the Presence
of Noise.
• 02 papers: Journal of Science for Mathematics - Physics 2006:
Design waveform generators and filters in radar system
- Radar digital filters using TMS320C6416T DSK
3
MỤC LỤC
Mục lục 4
Mục tiêu đề tài 5
Các kết quả chính 6
1. Sơ lược về hệ thống radar [/, 2] 6
2. Kết quả thực nghiệm 9
Kết luận 10
Tài liệu tham khảo 11
Phụ lục 12
Scientific Project 30
Phiếu đăng ký kết quả nghiên cứu KH -CN 31
4
MỤC n Ê U ĐỂ TÀI
Radar được viết tắt từ thuật ngữ RAdio Detection And Ranging. Hệ thống radar sử
dụng các dạng sóng điểu chế và ăng-ten định hướng để phát đi các sóng điện từ vào
những khoảng không gian nhất định nhầm tìm kiếm mục tiêu. Các mục tiêu trong
không gian tìm kiếm này sẽ phản xạ một phần năng lượng sóng điện từ trở lại ăng-ten.
Những phản xạ này sau đó sẽ được xử lý bởi khối thu radar để tách ra các thông tin của
đối tượng như là vị trí, vận tốc, góc độ và các thông sô' quan trọng khác.
Radar thường được phân loại theo dạng sóng mà chúng sử dụng, hoặc theo tần số
làm việc. Trước tiên, theo dạng sóng, có radar sóng liên tục (Continuous Wave - CW)
và radar xung (Pulsed Radar - PR)
Các radar c w không điều chế có thể xác định chính xác vận tốc mục tiêu (dựa
theo độ dịch tần Doppler) và góc tọa độ. Thông tin vị trí không thể thu được nếu không
sử dụng sóng điều chế.
Radar xung dùng các chuỗi xung (thường có điều chế). Trong loại này, hệ thống
radar có thể được phân loại theo tần số lặp lại xung (Pulse Repetition Frequency -
PRF), như PRF thấp, PRF trung bình, và PRF cao. PRF thấp dùng để xác định vị trí và
không quan tâm đến vận tốc mục tiêu. PRF cao mới được sử dụng chính để xác định
vận tốc. c w cũng như PR đều có thế’ đổng thời xác định được vị trí và vận tốc đối
tượng khi sử dụng các dạng sóng điều chế khác nhau.
Công việc chính của chúng tôi tập trung vào các nguyên tắc hoạt động cơ bản của
radar thể hiện trong các biểu thức toán học. Mục tiêu là phân tích và hiếu thấu các cơ
chế này để có thể phân tích và thiết kế các hệ thống radar thực tế.
Cuối cùng, tôi xin trân trọng cảm ơn Ban Giám hiệu, Phòng Khoa học và Công
nghệ, Phòng Kế hoạch tài vụ, Ban chủ nhiệm Khoa Vật lý đã giúp đỡ và tạo điều kiện
về mặt tài chính và các thủ tục khác trong suốt thời gian tôi làm đề tài.
Xin trân trọng cảm ơn.
5
CÁC KẾT QUẢ CHÍNH
1. S ơ LƯỢC VỂ HỆ THỐNG RADAR [1,2]
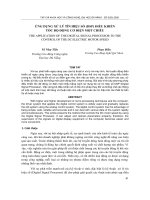
Hình 1 đưa ra một sơ đổ khối của hệ thống radar xung. Khối time control phát ra
tín hiệu đổng bộ thời gian cho toàn hệ thống. Tín hiệu điều chế được phát ra và gửi tới
ăng-ten nhờ khối modulator/tranmitter. Chuyển mạch cho ăng-ten giữa mode phát và
thu được điều khiển bởi bộ duplexer. Duplexer cho phép một ăng-ten có thể dùng
chung cho cả phần phát và thu. Khối thu khuếch đại tín hiệu phản xạ và đưa chúng đến
khối signal processing. Thông tin thu được là đầu ra của khối này.
K
Hình 1. Sơ đồ khối của hệ thống radar xung
1.1 Vị trí
VỊ trí của mục tiêu, R, được tính từ thời gian trễ At là khoảng thời gian mà xung đi
được theo hai chiều giữa radar và mục tiêu. Vì sóng điện từ di chuyển với vặn tốc ánh
sáng, c = 3 X 10H m/s, nên
* = — (1)
2
1.2 Độ phân giải vị trí
Độ phàn giản, kí hiệu là AR, miêu tả khả năng hay khoảng cách tối tiểu mà vẫn có
thê phãn biệt các mục tiêu gần nhau
CT c
AR = — = — (2)
2 2 B
r- độ rộng xung; B - băng thông của radar
Nói chung, người vận hành và thiết kế radar luôn muốn tìm cách cải thiện khả
năng hoạt động cùa radar. Theo biểu thức (2), để đạt được độ phân giải cao thì cần thu
hẹp độ rộng xung. Nhưng khi đó sẽ giảm công suất phát và tãng băng thông. Để vừa có
6
độ phân giải cao trong khi vẫn bảo đảm được công suất phát thì cần xử dụng kỹ thuật
nén xung.
1.3 Tần số Doppler
Radar sử dụng tần số Doppler để xác định vận tốc mục tiêu, cũng như để phân biệt
các mục tiêu chuyển động hay đứng yên. Hiệu ứng Doppler miêu tả độ dịch tần số
trung tâm của sóng tới khi mục tiêu chuyển động tương đối so với radar. Tùy theo
hướng của chuyển động, tần số này có thể có giá trị dương hoặc âm.
Sóng tới mục tiêu có các mặt đẳng pha phân tách bởi bước sóng Ả. Các mục tiêu lại
gần sẽ có các mặt phẳng pha gần nhau hơn. Ngược lại, các mục tiêu ra xa sẽ có các mật
sóng cách nhau xa hơn, hình 2.
► inciikm
rctleiMCil — — -
t
u
iiequeucỴ
/í> frequency Ai
cltiMiK’ KIPJCI ivceiling liiryei
Hình 2. Hiệu ứng của mục tiêu chuyển động lén tấn sô'sóng
f - i L f J k L
J d J 0 -
(
3
)
7
1.4 Phương trình radar
Phương trình radar đưa ra các mối quan hệ của công suất phát, các thông số truyền
sóng với tín hiệu vọng. Hơn nữa, gần như toàn bộ thông sô' tính toán cùa radar đều thể
hiộn trong phương trình radar
(SNR)0 = ■
(4)
(4tt) kT'BFLR*
p, - công suất đỉnh; G - hệ số khuếch đại ăng-ten; ơ- tiết diện cắt của mục tiêu
Te - nhiệt độ hiệu dụng; F - ảnh nhiễu; L - các mất mát của radar
Phạm vi cực đại có thể phát hiện, Rm
'max’
^raax =
r , , V '4
(4^)3 kT'BF(SNR)o
(5)
2. KẾT QUẢ THỰC NGHIỆM
2.1 Nâng cao tỉ số tín hiệu/tạp, khả năng phát hiện, độ phân giải của radar
Tăng tỉ số tín hiệu/tạp nhờ tăng năng suất đỉnh phát ăng-ten, tăng độ phân giải
radar nhờ các xung cực ngắn. Hai yêu cầu mâu thuẫn được giải quyết thỏa đáng nhờ kỹ
thuật nén xung điều chế tần số tuyến tính. Sự trì trễ tín hiệu vọng và dịch tần số
Doppler được qua bộ lọc nhận và soi chiếu nhờ hàm mờ sẽ đánh giá chính xác vị trí và
vận tốc mục tiêu.
2.2 Ước tính khả năng phát hiện và xác suất báo động lầm của radar trong
trường hợp có nhiễu
Đưa ra một số kỹ thuật phát hiện mục tiêu sử dụng công cụ mô phỏng Matlab. Sự
phụ thuộc của xác suất phát hiện PD theo tỉ số tín hiệu/tạp, khi cố định xác suất báo
động lầm để khảo sát, sẽ đưa ra sự lựa chọn thông số tốt nhất cho các hệ thống radar.
pfa được giữ cố định tại giá trị cho phép gần thực tế và điểu chỉnh sao cho PD cực đại.
PD có thể được nâng cao khi cộng tất cả các xung phản xạ theo kỹ thuật tích phân xung
tương can và không tương can. Khi xem xét các mục tiêu không thãng giáng và có
thăng giáng, PD sẽ giảm và tương ứng SNR cũng sẽ giảm đối với mục tiêu thăng giáng.
2.3 Design waveform generators and filters in radar system
Kết quả này sử dụng phần mềm Goldwave để nghiên cứu những nguyên tắc hoạt
động cơ bản cùa một hệ radar điển hình. Dạng sóng như LFM và các chuỗi xung tương
can được phát ra một cách dễ dàng nhờ các mạch điện tử số của máy tính và card, âm
thanh mà không cần dùng các mạch điện tử phức tạp bên ngoài. Thời gian trễ và tần số
Doppler được tách ra từ tín hiệu phản xạ dùng để tính toán vị trí và vận tốc của mục
tiêu. Các bộ lọc cũns được thiết kế để lọc nhiễu, nâng cao tỉ số tín hiệu/tạp.
2.4 Thiết kế bộ lọc radar số sử dụng bo mạch TMS320C6416T DSK
Kết quả này thực hiện các bộ lọc đáp tuyến xung hữu hạn FIR và bộ lọc xung vô
hạn IIR là những bộ phận không thể thiếu trong các khối xử lý tín hiệu sô' của radar,
dùng bo mạch DSP chuyên dụng TMS320C6416T DSK cùa hãna Texas Instrument.
Các mã c được viết với sự trợ giúp của phần mềm Matlab SPTool để tạo ra các file hệ
số phù hợp với cấu trúc địa chỉ vòng của DSK. Bằng cách thay đổi các file hệ số, chúng
ta có thể tạo ra các bộ lọc khác nhau tại các vùng tần số khác nhau.
9
KẾT LUẬN
Các kết quả của đề tài đã đưa ra được các kỹ thuật mô phỏng cho:
- Thuật toán cải thiện tỉ số tín hiệu/tạp sử dụng kỹ thuật nén xung, điển hình với
xung điều tần tuyến tính LFM sử dụng trong hệ định vị vô tuyến radar.
- Hiệu ứng của thời gian trễ và độ dịch tần Doppler được xử lý bởi các bộ lọc
thích hợp và được phân tích bởi các hàm mờ để có thể đo được chính xác các
thông tin về tọa độ và vận tốc của mục tiêu trong hệ định vị vô tuyến.
- Những tính toán về xác suất phát hiện PD và xác xuất báo động lầm pfa theo các
tỉ số SNR yêu cầu.
- Sử dụng phần mềm Goldwave, chúng ta có thể vượt qua được những khó khăn
về trang bị các thiết bị siêu cao tần trong khi nghiên cứu radar. Các dạng sóng
đều có thể được tạo ra dễ dàng, các ước tính về tọa độ, vận tốc và các bộ lọc số
được thiết kế cho ta một công cụ tuyệt vời về mô phỏng hệ radar trong phòng
thí nghiệm. Các công việc sắp tới là đưa các tín hiệu này xử lv trên bo DSP,
hoàn chỉnh hệ thống định vị vô tuyến radar hiện đại
- Thực hiện trên TMS320C6416T DSK, các bộ lọc sô' radar có thể được tạo ra
một cách dễ dàng và linh hoạt. Các tần số chúng ta muốn cho qua, muốn chặn
và dải thông cùa bộ lọc có thể được thiết kế và xuất ra thành các file hệ số
trong môi trường Matlab.
Cụ thể, có 01 báo cáo Hội nghị Vô tuyến toàn quốc 2006, 02 bài báo Tạp chí
Khoa học Toán - Lý VNU 2006 và 02 khóa luận tốt nghiệp sinh viên K47 2006 về
các kết quả nghiên cứu mô phỏng xử lý tín hiệu số DSP cho hệ định vị vó tuyến.
10
TÀI LIỆU THAM KHẢO
1. Bassem R. Mahafza, Radar Systems Analysis and Design Using Matlab,
Chapman & Hall /CRC, 2000.
2. Merrill I. Skolnik, Radar Handbook, Me Graw Hill, Second edition, 1990
3. Rulph Chassaing, “Digital Signal Processing and Applications with the C6713
and C6416 DSK", John Wiley & Sons, Inc., 2005.
4. B. A. Shenoi, “Introduction to Digital Signal Processing and Filter Design”,
John Wiley & Sons, Inc., 2006.
5. A1 Lovrich, “Implementation of FfR/I/R Filters with the
TMS32010/TMS32020", Digital Signal Processing Solutions, Texas Instruments,
1989.
6. “Digital Filters Using the TMS320C6000", Digital Signal Processing Solutions,
Texas Instruments, 1997.
11
PHỤ LỤC
1. Photocopy bài báo kèm bìa và mục lục Tạp chí công bố
01 báo cáo Hội nghị Vô tuyến toàn quốc 2006:
Do Trung Kien, Bach Gia Duong, Tran Thi Bich Hai, Estimation
o f Radar Detection and False Alarm Probability in the Presence
o f Noise, National Conference on Physics 2006, p.231
02 bài báo Tạp chí Khoa học Toán - Lý 2006
Journal of Science for Mathematics - Physics 2006:
- Design waveform generators and filters in radar system
- Radar digital filters using TMS320C6416T DSK
2. Photocopy bìa luận vãn Đại học được thực hiện theo hướng đề tài
Khóa luận Đại học:
• Trần Thị Bích Hải, K47 Vật lý, Bài toán về sự phát hiện mục tiêu trên
nền nhiễu, 2006.
Điểm khóa luận: 10
• Bùi Quang Tuấn, K47 Vật lý, Lý tliuyết nén xung s ố của radar, 2006.
Điểm khóa luận: 10
12
10
*^C5SSSSS®5JRS5S5C!2?!
I l l U M tfM A jy|
rKi v.
November 6~7, 2006 Hanoi^
Ũ
IEEE
COMMUNICATIONS
SOCIETY
ẠIEEE
S iC
RADIO BfCTM W i ASS0SIATÍ3N OF VKTNAM u p
13
SESSION 4. SIGNAL PROCESSING & CODING
Session Chair: Prof. Huynh H uu Tue Co-Chair: Prof. B. Finn
Sessions Index
Num ber
Paper, Author
Page
1
Cyclic codcs based nn Cyclic M ultiplicative groups (C M Gs)
Nguyen Binh
211
2
On the influence of non Gaussian additive N oise on Digital Linearly
m odulated systems
H. H I nc. N.D. Chicn , N T. Hong
214
3 New Q uality M easure for ICA: Sim ple, Effective and Intuitive
Phan Anh Huy and Nguyen Kim Saeh
219
4
1
A New Robust A lgorithm for ICA Based on a- Rcnyi Entropv and
M im im um Spanning Tree
Phan Anil Huy, Nguyen [;m Anil and Nguyen Kim Sach
223
5
Designing Kalm an Filters for Integration of Inertial Navigation System
and Global Positioning System
T. D. Tan. H. H. Tuc. N. T. Long. N. p Thuy, N. V. Chuc
226
6
Estimation o f Radar Detection and False Alarm Probability
in the P rcscncc of Noise
Do '1 rung Kien. Bach Gia Duong, I ran Thi Bich Hal
231 !
7
Research, design and fabrication of a digital signal processing system
based on the technology DSP56307EVM with high speed A /D, D/A
converter for Radio Navigation System s
B;ich Gia D uong. V'u Tuan Anh. Tran Quant; Vinh, Nguyen I rung Kien and Nguyen
Tu;tn Anh
236
14
Estim ation o f Radar Detection and False A larm Probability
in the Presence o f N oise
D o Tru ng Kien a, Bach G ia D uong b, Tran Thi Bich H a ia
a) F acu lty o f Physics. University o f Science, H anoi N ational University
h> College o j Technology, H anoi N a tio nal University.
Abstract — This repo rt investigates some im portant
techniques in ra d ar detection using Matlab
sim ulation. T he dependence of the detection
probability p„ on the signal to noise ratio SNR% with
the false alarm probability Pj, as a param eter,
shows the besr choice of specifications fo r typical
ra dar system. The pf. is held fixed at an acceptable
values and the Pp is m axim ized. The pfi can he
enhanced by summing all of retu rn ed pulses in
coherenr and non-coherent pulse integration
processes. W hen considering the difference between
non-fluctuating and fluctuating targets, th e pa will
decrease, or equivalently, the SNR is reduced in
latter ease.
I. INTRODUCTION
The basic principle o f radar may be very easy to
understand, however, Ihe theory can be quite
complex. Therefore, an acknow ledge of the
operation is essential to work with ihc systems.
Basically, radar is a dcvice that sends out
electromagnetic waves. These waves reflect off o f
objects in spucc, and a proportion of the original
wave energy IS actu ally bounced back towards the
radar The radar then reads this returning signals
and analyzes to determine many properties about
the object. These signals are composed o f the
ceho signal s(f) and noises tiff)
Some results have been invest mated aboul radar
signal waveform, lhc dependence of SNR on radar
parameters, ambiuuily function and matched filler
[/]. Our goal for this paper was 10 simulate the
dclcction o f radar syslem using MATLAB. We
will consider how llie probability of detection
and false alarm p/u depend on SNR with non-
fluctuating target and fluctuating target for single
and integrating o f pulse.
II. DETECTION THEORIES
Noise Probab ility Density Functio n PDF [2-4J
The majority o f noise entering the receiver is
thermal noise, caused by the inevitable
fluctuations in voltage in and around Ihc activc
region of deviccs. Noise power p s has Gaussian
statistics and can be written in the Johnson-
Nyquist form
P s - k T tiB (W) (I)
where k is the Boltzmann’s constant, To is system
noise temperature, B is receiver noise bandwidth.
The total noise at the output of the receiver:
.V = Ps.Fs = kT ,$.N F (W ) (2)
NF. noise figure, quantifies the degradation in
SNR as a signal passes through a component:
(s/N)„
F = 1 < F < 30
Consider a sine wave am plitude A is present along
with the noise at the input to the //•' filter o f the
radar system, with the frequency is equal to the
center frequency o f ỉhc filter. The output has a
PDF Ricean distribution:
exp\
(3)
VỊ/ ■ ^ Vị/ * J \ 2\ụ
Iy(P) is the modified Bessel function of zero order,
2n ;
v e
r is signal and noise, A IS signal amplitude only;
f(r)dr is probability of finding the noise voltage r
in [r. r + iir]\ is variance o f the noise voltage.
The noise entering the fillers has Gaussian
thermal noise PDF.
I
V w I J
The output has a form of ihe Ravleigh PDF:
/ ^ = "7 ^ 7 7 (5)
IỊ/- 2\\>
The pfa for single pulse \2-4\
The pt„ is defined as the probability that noise
voltage exceed the threshold Yr when noise alone
(r-A)2
(4 )
Fig. I - Receiver vol/age output illustrating fulse alarm
due tu noise
231
15
p,u = j. f(rMr= J - j exp(- ~ - r ) d r = e x p f ~ ) (6)
I, ry V 2vịít-V 2 HI
V)
Pfa is also defined as the ratio o f the time that the
output voltage is above yT to the total tim e:
m
N
I '* {'„)
,
: izi = _ 1
p =
_
_____
_
__
/tt N It \
± T t ' ‘
1=1
The /* 0 for single pulse \2-4Ị
Po is a probab ility when r(l) exceed the VT in the
case o f noise plus signal. U sing E q.(3) wc have:
Assume the signal is sine w aveform am plitude A,
its pow er is A:/2. U sing SN R = A 1/2 y ' (single
pulse), (V T!/2\ụ2) = Infl/P /J . Eq. (9) is rewritten:
2/n!
(10)
/ V ■ V I fi-
where M arcu m ’s Q -function is:
Q /a .M = ) ụ 0( a C ,)e-/r-'-'° 'i n dC, (II)
p
North approxim ated this PD:
pu = 0,5 X e r/cỤ - In p,„ - ylS N R + 0,5 ) (12)
with com plementary e rror function is
irfc(: ) - I — je ' dv.
l/s J
III term s o f the P D Fs, the d election and false
alarm process is show n gra phic ally in the Fig.(2)
Pulse integration ị2-4\
Integ ratio n im plemente d b efo re detection is called
pre-detectio n or coherent integratio n, requires the
phase o f ccho signal to be preserved. If a pcrfect
integrator is used, then integrating pulses would
improve the SN R by the sam e factor. C on sider the
m'*pulse: y„(l) = s(t) +■ n„,(l)
w here n,„(l) is w hite uncorrelated additive noise
signal. C oheren t integration o f nr pulses yields
I % n p I
z(t) = — £.}’„,(' ) = *(') + T, — ",,/1)
r> ,,
A lternativ ely, integration im plemented after the
envelope detector w hen the phase o f Ihc rcceivcd
pulse is un known is called post-d eteclion or non
coherent integ ratio n B ccause phase is destroyed,
som e o f the energy con verted to noise in the
dctcctor (detectio n losses). Therefore, post-
detcction SNR , though easier to a chicvc, IS less
than coherent ease. In tegratio n im proves the Pj by
reducing the noise varian ce and (hus narrows the
Noise and S ignal+ N oisc PDFs as shown in Klg.(3)
Torgw Dll* Noh*
IV
—»1
**■ M,
AmcJitvxiw |Vo»a o «|
Fig.3 - Effect of integration on signal anti nt)i\c PDFS
before am! after integration
The in teg ration e fficiency is defined as:
SNR.
E ,(n ) = -
(13)
n (S N R „ )
where SN R , for single pulse and S \R „ is lliat
obtain the sam e P[t as S \'R i when integrating n
pulses. Integratio n im provem en t factor:
I/l l) = nE,(n) (14) ,
C oh erent integration: F.,(n) - I, l,(n) = 11
SA7? „ = - S 7VR, ( 15)
n
N on-cohcrent integration: l,(n j < II
SNR.
SNR', = 1 (16)
nE ( n )
232
16
Threshold VT 12, i |
In practice, the detection threshold, VT, is found
from the pti, using DiFranco and Rubin form:
/> ,„ = l - r , r - Ị L . n , - l ; (17)
where r I is the incomplete Gamma function
I/ - r < » „-1-1
yJnij u *
C(
-\)Ị
K = Y r
c r e
iteration finished when ỊVỵm
= 1.2.3. (18)
10000.0
G (VTJ, ) = (O S )'" - r , ( v T .n t, )
ơ(VTm) = -(c-''V;"' )/(nr -\)!
The initial value for the recursion is
•Yu - y fh ^ + 2-3\ F
Detection of Fluctuating Target |2, i |
All m oving targets (exception of the sphere) will
producc echoes w hose radar cross section (RCS)
changes with time. Swerling calculated for the Pn
of 5 target types. Swerling I, II use for com plex
target o f many (>5) scattcrcrs o f equal amplitude.
Swerling I: echo pulses constant for the target
over one scan but uncorrelated from scan to scan
(slow fluctuations). Swerling II: sam e Sw elling I,
but fluctuations are indepen dent from pulse to
pulse (rapid fluctuations)
/Y A ) - —— e x p (- —— )
rÍ A
A> 0
(19)
Swerling III, IV use for a targel with one large
scattcrcr and many small scatterers.
Swerling III: slow fluctuations (scan-to-scan).
Sw erling IV: rapid fluctuations (pulse-to-pu!se).
4 A 7 A
f ( A j = - ^ - e x p ( - — ) A > 0 (20)
A^Ằị. Aux.
The P[) for a fluctuating targ et is computed in a
similar fashion to Eq.(9), except in this case f(r) is
replaced by the conditional PDF f(r/A ).
SuKTlinf V
Fig. 4 - Returns from targets with Swelling models
Swel ling V corresponds In u Mưuíív RCS lurẹcl ru'it'
Swerling V: The Eq.(10) just mentioned above
the Pu for single pulse case. When nt,> I, the p u
is computed using the Gram-Charlicr series:
P =
fCt(V2-\)
CtV (i-V2 )-C„V(V* - lOV- +15;/
SNR+1/3
fa(2SNR+\)"
Y Vr -n ,(\+ S N R ) c _
SNR+i/A „ ,
=
r„ = c ,2 /2 .m = J n J2SN K + ij
nl,(2 S N R + \J2 v '
Sw erlin g I: The PD was derived by Swerling:
pn =e
_ -V, <\'SNR>
n ẩ, = 1
Po - I - r i ( VT ■", - 1) + 0 + — ~ / '■ ' X (22)
n/to fy K
V T Vị h I * n SN R I
r,r
./1,,- U x c ,n(J> I
1 + —
n r SN R
Swerling II:
(23)
W hen rt/f>50, using Eq.(19) with
C1 = - - U . Q = £ - . C 4 = -± - .u = j r pO + SNR)
-V"/. 2 4'V
Sw erling III: The form ula developed by M arcum
-V , -V . „
p„ = exp(-
“ 7777“ )(~
~ r ~ r ) ' *
\ + n,SN R /2 \ + nt,SN R/2
(I +
—
\—(n-2)) = K„ /1=1.2
\* n rSN R /2 nrSNR 1
v?
+ l-rjVl.n„-l)
R / 2 ) ( n 2 ) ! '
(24)
(\ + nrSN R /2)(n t - 2 )
V,
+ K,r.(-
l + 2/«,5iVR
Sw erlin g IV:
For < 50
.H p-U jo r n r >2
P n = \-
SN R S N R , n ( n - \ )
'<0 + ^
Y:
■SAT?
+ +f':y - ; '■ Y„
. Y, = r ,r-
(25)
\ + S K R /2 '
For nt, > 50, using the G ram-C harlicr series with
I 2 P3 - I _ r = c £ „ , SN R
2
c > = 7T '-C „ = — ;P = 1+-
2
4 « , r2(32 - u - v
233
17
T ^ C O U O C G iA HA N O .
TR U N G J A M t h o n g t in THU V lỆN_
0
III. SIMULATION RESULTS
1. Relation between Pa, Pf„ and SNR.
The Matlab function “marcum_Q.m” implements
Parl’s algorithm to compute the PD defined in
Eq.(lO). The syntax is as follows:
Ipdj = m arcum_Q(a,b)
a = -Ja ' / y 1 = y/zSNR ,b = J 2 ln(\ / p, )
Fig 5 - Detection probability as a function o f signal In
noise ratio with fa lse alarm probability as a parameter
- SNR req uire d is hig h even fo r Pp = 0.5. Th is is
due to the re quirem ent for the Pf„ to be small
- A change in SN R abo ut 4 dB ca n ch ange the pu
from 0.999 to 0.5. T herefo re, th e im provem en t
of SNR IS very important for the radar detecting
- Assum e pulsed radar has a P[i - 0 9, band w idth
B = 1GHz. th e tim e o f false alarm Tfa = 16.67
m inutes, ihe Pfa can be calcula te d using Eq (8):
p =—— =
!
= 101;
‘ T;J 1 6 .67X 6 0 X 109
The Fig .(5) sh ows the (S N R)i =15.75 dB.
Nole that the o f practical radar are qu ite small,
due to their narrow filter b and w id th B and large
the Tm. Tfi, is very sensitiv e to variatio ns in the
thresho ld level VT du e to the ex ponent
relationship show ed in Eq (7) F or exam ple.
V t:/ 2 u t Tfj
12.95 dB 6 m inulc s
14.72 dB 10,000 hou rs
2. Pulse integration investigation
The require m ents o f rem em berin g the phase o f
cach transm itte d p ulse as w e ll as m ain tain ing
cohcrcncy d uring p ro pag atio n is very costly and
challeng ing to ach ieve. In practice, m ost radar
sy stem s utilize no n-coh crcnt integration
Peebles reporte d an em pirically derived
expression fo r the im p ro\e m e n l factor in Eq.(13):
Ing( 1 / p,„ ) ,
IHn, ) L , - 6 w + U-235/>„ )<\ + ^
login ) ( l - 0 Uữlog(np) + 0 0 m w ( l o f ; n l, r )
The fu nction "im p ro Ja c .m " d rau the relations
between Ifrip). Pu and pr„.
/imp_np/ = impro _fac(np,pfa,pd)
np number o f integrated pulses
pfa probability o f false alarm
imp_np im provem entJador
Fig. 6 - Improvement factor as a function o f np
The in tegra tio n factor is not a sensitive function
o f either the Pi, or the Pp as can be seen by the
clustering o f the cu rvcs in the Fig.6
For ex am ple, the figure also show s that with the
Pi) = 0 .9 and P)a - 10 i: m entio ned above, 1(10) *
9.20 dB and from Eq (16) w c gel:
(SN R ) , = t s m ) i = 1 5 .7 5 -9.2 0 = 6.55 dB
T hus, n on-cohe rcnt integration o f 10 pulses where
(SNR ) 10 = 6.55 dB proM dcs the sam e performance
as (S N R )i= 15.77 dB o f a single pulse
3. C om pare the PB of fluctuating target using
integration (ttp> 1) and non-integration («,=1)
The fu nctio n "swerhng 5 m" calculates the Po for
Sw erling V targets u sing Eq (21)
Ipdj = swerling5(np,snr)
snr signal lo noise ratio
"f
SNR - dB
F/g. n - Pi, versus S \'R , p/u Iơ :' for no integration and
non-cuhcrcnt integration in Swcrlmg y model
The Fig 7 notes ứiat It requires less SNR. with
10 pulses integrated non-cohercntly. 10 achievc ihe
same Pu as in the case o f a single pulse. For
exam ple, w ith Pp = 0 9 and p,„ = 1 (SNR)iu =
6 55 d B com pare s w ith (SNR)i = 15 77 dB.
T herefore, in teg ration technique pro vides a good
im provem ent o f rada r dctcctin g
18
DESIGN WAVEFORM GENERATORS AND FILTERS
IN RADAR SYSTEM
Do T ru ng Kien a>, Vu Anh P hi °\ B ach Gia Duong b>
a) F a culty o f Physics, H anoi U niversity o f Science, V N U
b) College o f Technology, H anoi N atio n a l University
Abstract
T his applicatio n rep o rt u ses the tool of Goldwave softw are to investig a te the basic
prin ciples of a typical rad a r system. The radar w aveform s such as LF M and
coherent pulse train are generated easily w itho u t of designing complicated
circuits. The delay tim e and Doppler frequency are extra cted from th e retu rn
signals to c alculate th e ra n ge and velocity of targets. The filters are also
in tro duced th a t gives spectacular im provem ent in sig nal to noise ratios.
1. Introdu ction
Choosing a p a rticula r w aveform type and a sig nal processing techniq ue in a ra d a r
system depend s heav ily on the r a d a r ’s specific m ission and role. R a dar system s can use
C ontinuous W aveform s (CW) or pulse w aveform s w ith or w ithout m odulation. M odulation
techn iq ues can be e ith e r analog or digital [1, 2],
In th e laboratory scale, it is difficult to research on th e radar field because of the
expensive of high frequency devices and complicated circu it if we w a nt to make. One of the
favorite ap p lication s now adays is use every capacity of personal computer to design any
electronic system s. It is sim ila r the FPGA, A S IC or D S P technologies w ith all the needed
basic logic functio ns a n d analog-digital, digital-analog converters inside.
T h at is the re aso n for this report focus on the design ation of waveform generators, the
retu rned sig n als w ith delay, atte n u a tio n , D oppler effects and filters for rad a r system using
Goldwave VÕ .14 softw are of Goldwave Inc [3],
2. Theories o f w aveform s using in radar techn ique
c w rad a r s contin uously emit electrom agnetic energy, and use separate tra n s m it and
receive anten n a s. U nm o dulated c w radars can accurately m easu re targ e t rad ia l velocity
(D oppler shift) a nd a n g u lar position. T arg et range inform ation cann ot be extracted w ithout
utilizin g some form of m odulation. P ulsed radars (PR) use a train of pulsed w aveform s
(m ainly w ith m odulation). In this category, ra d ar system s can be classified on the basis of the
Pulse R epetition Fre quen cy (P R F ). Low P R F radars a re p rim arily used for ranging w here
ta rget velocity is not of inte rest. High PRF radars a re m ainly used to m easure target
velocity, c w as well as PR can m easure both target ran ge and radial velocity by utilizing
different m o d ulatio n schemes.
R a d a r w a v e fo rm s [2]
cvv a n d n ulse d waveform s:
c w is given by (Fig.la): f t( t) = Acosoì0t (1)
N ext consid er th e tim e do m ain of signal fJt) given by (Fig. lb):
19
f 2( t ) = A R e c t ( - ) = \ A 2 * * 2 (2)
1 [ 0 otherw ise
Now is th e coherent gate d cw waveform f 3(t): f 3(t)= ỵ ^ f 2(t - n T ) (3)
n=-co
Clearly f3(t) is periodic, w here T is period (recall th a t fr - 1 IT is the PRF).
_ N
T he function f4(t) (lim ited duration f/t) ) (Fig.lc): f A( t) = Ydf 2 ( t - n T ) (4)
n=0
Fig. 1. A m plitud e spectrum o f c w and pulsed, waveforms.
(a) CW; (b) single pulse; (c) coherent pulse train o f infinite length
L in ear Frequency M odulatio n W aveform s
Frequen cy or phase m odulated waveform s can be used to achieve m uch wider operating
ban dw idths. L in e a r Frequen cy M odu lation (LFM ) is commonly used. In th is case, the
frequency is sw ept linea rly across the pulse w idth, e ith e r upward (up-chirp) o r dow nward
(down-chirp). T he Fig.2a, b shows a typical example of a n L F M waveform . The pulse w idth IS
r, an d the b andw id th is B.
Fig.2. Typical L F M waveforms, (a) up-chirp; (b) down-chirp; (c) m a gnitude spectrum
f j 2 n( ’ J 9 ,
A typical L F M can be expressed: s1( t ) = R e c t(-)e 2 =e s (t) (5)
T
s(l) = R e ct(—)emu is envelope function of s,(t). The spectrum is shown in Fig.2c.
T
c w ra d a rs m ay use LFM waveforms so that both rang e and D oppler info rmatio n can be
m easured. In one special techn iq ue of radar, the pulse com pression is accomplished by
adding frequency m o dulation to a long pulse a t transm issio n , a nd by usin g a m atched filter
receiver in o rder to com press the received sig nal. U sin g long pulses and wideband LFM
m odulation we can achieve large compression ratios.
3. Experim ent R esults
U sing the G o ld w a v e v5.14, we can use th e complex D igital S ignal Processing (DSP)
inside a c o m p uter to m ake a ny requirem ent of digital signal (Fig.3). Sound card is used for
playback and recording w ith sa m ple frequencies of u p to 44.1 kHz. Sam ple frequencies
outside th is ran ge can produce unexpected resu lts. So the rad a r signals th is application
rep ort m ade will also h ave the limited frequency of 44.1 kHz. T herefore it m ay be said th a t
th ese re sults of the re p o rt is ju st for lab-radar model.
20
PC
Oscilloscope
Soundcard
Yokoqawa
L in e out
Digital Oscilloscope
DL1720E
Fig.3. Block diagram of experim ent
R a d a r S ig n a l Generators a n d Processing
A im p o rta n t signal of rad a r is L F M waveform (Fig.4). T h e pulse w idth r an d the
bandwidth B ca n be controlled easily for th e best com pression gain 2 B t.
W ith p u lsed rad a r, we can create a simple sq uare pulses (Fig.5). The pulse w idth ra n d
Pulse R epetitio n Inte rval (PRI) can be adjusted to achieve high signal to noise ratio {SNR)
because of the peak transm itte d power p , in [i] is proportional w ith pulse w idth. As
m entioned above, L F M w aveform s have long p ulse a t tran sm iss io n (T:ransmiUed long), and by
using a m atched filter receiver in ord er to com press th e received signal in order to achieve
high resolu tio n (r„MlW short).
PtG2}?a
R adar equation : (S N R )IIUI =
( 4k ) kT.B F L R
(6);
cx c
R ange resolution: AR = — = —— (7)
2 2 B
Fig.4. Up-chirp LFM observed by
Yokogawa D ig ital Oscilloscope D L1720E
»6^07^17 ze 17:61 ,y t ■
-
—
■.
,k I
(OGMMA ♦ ■— 5
Transm itted P u lt t s
S im .n l.t* a n im rp - iji n i' t 3 n h sp ru p d h v Y nh t
Fig.5. Sim ple square-w ave observed by Yokogawa D igital
Oscilloscope D LỈ7 2 0E
G oldwave also can program to m ake com plicated coherent pulse train in w aveform s of
sine, square, o r esp ecially L F M tra in (Fig.6a, b, c)
111V) O ^U U l V) Ui VOj/V ViUll
rt lS Si t
-
Wra
.
~ ^
W OCH I »
________________
I 1 **
__
tàS/-t 1M»
j f - f - M
(a ) (b) (c)
Fig.6. Coherent puls e train, (a) S in e waveform; (b) Squa re waveform; (c) Ỉ.F \Í w atefvrm
The ta rg e t’s range, R , is com puted by m easurin g th e tim e delay, A t\ it take s a pulse to
trav el the tw o-w ay path betw een th e ra d a r and the target: R = (8)
Fig.7a show s th a t we need to note about the len g th of the pulse w idth should not be to
long, o r overlap easily to occur for a near target cases. Fig. 7c describes th e returns in the
cases have m ore than one ta rgets. We m ust be careful in calcula tions to avoid false alarm s of
wrong targets, or w ro ng b etw een ta rge ts and stationary c lu tters.
Transm it
Echo
-Vi'—"i-v.v-j
ill III iij III
O v e rla p due to sh o rt d e lay time
i f III
Return 'rom t.1
It1 '• ! !
!> ■ n '■
in
fci
(a) (b) (c)
Fig. 7. Rad ar echoes, (a) O verlap due to short delay tim e 0.5 m s; lb) Jf = 1.8ms, more attenuation:
Returns fro m 2 targets at d ifferent positions.
R adars u se D oppler frequency f d to extract targ e t radial velocity, as well as to
distin g uish betw een m oving and s tationary targ ets: fj = - v/ (Fig.8 a, b) (9)
21
****»♦
|lr-
M M ,
i it "*
I'.'-
Qoemq argot cautts frie highg fraqmncy
Racadinfltargst causes the lo w frequency
Li
(a) (b) (c)
Fig.8. (c) Doppler effects, (a) P ositive Doppler frequency f d; Cb) Negative Doppler frequency fd
Filters
F ilters a re n ecessary p a rts in the rad a r system usin g to im prove th e radar detecting
techniques, especially in cre asing the S N R w hen signal is presen t along with th e noise. In our
work, we c reate a sin e wave signal 1.000 kHz plus w ith the w hite noise, and design the band
pass filte r w ith frequency range from 995 Hz to 1005 Hz to remove almost th a t w hite noise
(Fig.9)
t y ệ ệ ặ m t ệ ệ m * I
s ig n a l ♦ W hlta N o isa
O ut p ut of the B P fl
Fig. 9. Effect of the filte r in ra da r detection techniques
4. Conclusions
U sing the G oldwave softw are, we som ewhat overcom e difficulties of h aving expensive
high frequency devices in r a d a r investigations. All the w aveform s m ade and the estim ations
of ranges, velocities and the variou s filters give us th e excellent tool to design a lab -ra dar
model. T he furth er w orks will use th ese w aveforms as the in p u ts of a D SP board for radar
signal processing.
References:
[1], Do Trung Kien, Bach Gia Duong, T ran Van Tuan “Improvements o f Signal to Noise Ratio,
Range Detection and Resolution, o f R adar", National Conference on Physics 2005.
[2]. Bassem R. M ahafza, "R adar Systems Analysis and Design Using M atlab", C hapman & Hal]
/CRC, 2000.
[3]. GoldWave M anual, Copyright by 2006 GoldWave Inc.
22
RADAR DIGITAL FILTERS USING TMS320C6416T DSK
Do Tru ng Kien a>, Than Thanh Anh Tuan °\ Vu Anh Phi a), Bach Gia D uong01
a) Faculty o f Physics, Hanoi University o f Science, V N U
b) College o f Technology, H anoi N atio n a l U niversity
Abstract
T his repo rt d iscusses th e im ple m entatio n of Finite Im pulse R esponse (FIR)
filters, one o f the most critical p a rts of a ra d ar system , using the TMS320C6416T
D S P S ta rter K it of T exas Instrum ents. T he c codes are w ritten w ith th e h elp of
M atla b ’s SPtool to c reate the filter’s coefficients associated w ith the circular
address stru c ture in DSK. By a ltering the sets of coefficients, we can m ake the
filte r respond in d ifferent ways to the different frequencies just in one generic
F IR p rog ram .
1. Introdu ction
T he ability of an F IR filter to operate satisfactorily in an unknow n environm ent and
track tim e v a riations of input statistics m ake th e F IR filter a powerful device for signal-
processing and control applications. Indeed, FIR filters have been successfully applied in
such diverse fields a s comm unications, rad ar, sonar, seism ology, a n d biomedical engineering.
A lthough these applicatio ns are indeed quite different in n a tu re, n e verthele ss, they have one
basic comm on feature: an input vector and a desired resp onse are used to compute an
estim atio n erro r, which is in turn used to control the values of a set of adju stable filter
coefficients.
2. Theory o f filter with TMS320C6416T DSP Starter Kit
For a large varie ty of applications, digital filters are usu ally based on the following
re la tionsh ip s betw een th e filter in p u t sequence x(n) and th e filte r o u tp u t sequence y'n) [4] :
N M
y ( n )= Yi akx ( n - k i - Ỵ 'b Jy (n - j ) (1)
*=0 7=1
E q .(l) is re ferred to as a linear constant coefficient difference equation.
C o n cepts o f th e F IR [1-3]
A discrete sign al x(n) can be expressed as: x ( n ) = Y ^x(m )bt n - m i (2)
m = r,
w here $ n -m ) is im p ulse sequence ã n ) delayed by m . T h e signals a n d system s that we deal
w ith are lin e a r a n d tim e in v a riant, w here both sup erpositio n and shift-invariance apply. If
th e input is a u n it im p ulse ã n ) the resu lting o u tp u t re spon se is h(n), h(n) is designated as
th e im pulse respo nse. T h en x(m )ẵ n -m ) ->x(m )h(n-m ) by the shift-m varia nce property. Using
(2), the respo n se becomes: y ( n ) = ỵ ^ x ( m ) h ( n - m )
L etting k = n-m y ields:y in ) = ị í h (k )x (n - k ) . T h is convolution equation is very useful
*=0
for design of F IR filter since we can app ro xim ate it w ith a finite n u m b er of term s, or
23
N-1
y (n )= ^ h ( k ) x ( n - k ) (3)
*=0
Eq.(l) reduces to Eq. (3) with ak = h(k) and bj = 0
Features o f FIRs
The F IR gen era lly has “linear phase". A signal passin g th o u g h th e filter will be delayed
by a fixed tim e period, so th e re la tionsh ip betw een high frequency and low frequency passing
though the filter stays the same.
The F IR is “in h erently stable". A nalogue filters (and Infin ite Im pulse R esponse IIR
filters) a re very sim ilar to oscillators. Get our design w rong, the filter may oscillate this
can n ot hap p en w ith and F IR filter.
Implem entin g filters on the TMS320C6416T DSP S tarter K it
T he TM S320C6000 family processors are good a t filterin g, h a ving been designed for the
types of operatio n common in rad a r signal processing system s. In th ese sy stem s, sam ples are
ta k e n in a contin uous stream - typically from a radar operatin g in real-tim e. It is im portant
tha t the o u tput is calcula ted as quickly as possible. T his case is called “real-tim e processing”.
However, a n o ther system m ay g a th er a larg e set of data before sta rin g to process it. T his is
known as “block p rocessing". How ever, the F IR is very efficient on the TM S320C6xxx so
block processing is n ot required [4\.
Table 1. M em ory orga nization for Table 2. M emory organization to illustrate
coefficie nts and sample 12] update o f sam ples 12]
i
Coefficients
Sample
Coefficients
Sample
0
h(0)
x(n)
Time n Time n+1 Time n+2
1
h(l)
x(n-l)
h(0)
x(n) x(n+l)
x(n+2)
2
h(2) x(n-2) h(l)
x(n-l)
x(n) x(n+l)
h(2)
x( n-2) x(n-l)
x(n)
N-l
h(N-l) x(n-OM))
h(N-2)
x(n-(N-2)) x(n-(N-3)) x(n-(N-4))
h(N-l)
x(n-Oi-l))
X(n-(N-2)) x(n-(N*-3))
The im p o rtan t poin t in real-tim e applicatio ns is w hen a new sam p le arrives, it is added
to the sam ple set, a nd the oldest sample is disposed of. T his can be perform ed using the
circular addre ssin g hardw a re of th e C6000 family.
3. E xperiment results
F r e q u e n c y r e sp o n s e s o f lo w -pass, h igh -p a ss, b a n d -p a ss, b a n d -sto p filte r s
The c source prog ram FIR.C im plem ents FIR filters by th e Eq.(3). It is a generic FIR
program , since coefficient files specify the filter’s characte ris tics. This is the spectacular
feature of FIR filter. By altering the sets of coefficients, we can m ake the filter respond in
differen t ways to th e d ifferent frequencies. W ith the help of SPTool/FDATool of M atlab, we
can c arry out this m ission easily. For a n F IR filter to have lin ear pha se, th e coefficients m ust
be sym m etric. F o r exam ple, we can see inside the bp2100.cof c reated by SPtool.
Table 3. S et of bp2100.cof symmetric coefficients
#define N89
short h[N] = (-81. -17, 53, 2. 0, -3, -73, 27. 156. -81, -233, 162. 287. -257. -303, 345. 275, -399. -207, 393,
117 -304 -36. 124. 0. 142. -48, -468, 208. 811, -496, -1120. 904, 1341. -1403. -1428, 1944. 1354. -2462. -
1115 2892 734. -3177, 256, 3277. -256. -3177. 734. 2892. -1115. -2462. 1354. 1944 1428 1403. 1341,
904 -1 120 -496. 811, 208, -468. -48. 142, 0, 124. -36, -304. 117. 393, -207, -399, 275. 345, -303. -257.
287,' 162. -233. -81,156.27. -73. -3. 0. 2. 53 17,-811;
B u ilt and ru n this project in D S K CCStudio environm en t. For detail illu stratio n of the
24
F IR of b ass-p a ss 2 100Hz, we can use squa re wave a t the inp u t. The square wave is made up
of a fu n dam e n tal frequency and all odd h arm o nies, theoretically to infinity. Therefo re the
FIR filter ju s t passed the na rrow frequen cy ba nd equal the band-pass of filter. It means th a t
the outp u t is alm ost th e sine w ave (F ig.l).
The am p litudes of th e sin e wave in Fig. lb , c are sm a ller th an th e case 0ỈF ig l.a because
of the fundam e n tal frequ encie s in th e c ases (6) and (c) (1900H z and 2300Hz) are not
•A A A A A A A A /V
'Ỉ '
’
TJ
•A /V W V W W \A
(1) • 48kH< lunlled by Ihe simplmg frequency of 96000M1
<2| - 23kH2 limited by the manmum frequency of sound card
Nyqtjiit-fihamion «»mpHnợ Hwonmj
(b) fc)
F ig .I- In pu t a nd O utput o f the FIR filter, observed by Yokogawa Oscilloscope D LỈ720 E
(a)2100Hz. (b) 1900Hz. (c) 2300Hz
A very im p o rta n t m eth od to in vestigate the
frequency responses of th e filter is using the
w hite noise a s th e input. For th is purpose,
program no ise _ g en .c is w ritte n g enera te a
pseud orand om noise. In th eory, th e w hite noise
has frequency spe ctru m swept from zero to
infinity. H owever, we have som e lim itation in ,
rig.2- Spectrum OJ the white noise generated
frequency range th a t show n in Fig.2. by PSK TMS320C6416T
W hen we load the FIR.C to th e TMS320C6000 processor an d connect th is white noise
signal in to L IN E IN , we w ill observe th e frequency responses of th e filter w ith different
coefficient sets (Fig.3). The Fig.3 show s th a t we can easily change the cut frequency, cen ter
frequency, b a n d w idth of band-pass a n d band-stop w ith the help of the SPTool or FDATool of
M atla b to chan ge the coefficient sets.
-
\\
j (*) Lo w p a s s at 10 kHz
I
I
" ' : " / t r y
T -
■ :
/
■
: :
(c)
(*) B and p a s s at c e n te r fre q u e n c y 12kH z
B an d w id th = 4k H z
'
(•)
(*) B a nd s to p a t c e n te r f re quen c y 10kH z
BW = 2k Hz
observed by V irtins Sound C ard M ultiln stn tm eni
3.2 Frequency responses of multi-band filter
A m ea nin g fu l sign al is som etim es corrup ted by som e undesired o th e r signals th a t th eư
frequencies located a t d ifferent positions of frequ ency spectru m . D igital sig nal processors
have to rem ove th e se “noise" and recover th e m ea sure d signal. The m u lti-bandpass or multi-
bandstop m ay be th e excellent tool for this task. The generic FIR.C oncc more time can use
25