Determinants of Dividend Payments of Non-financial Listed Companies in Hồ Chí Minh Stock Exchange
Bạn đang xem bản rút gọn của tài liệu. Xem và tải ngay bản đầy đủ của tài liệu tại đây (274.23 KB, 18 trang )
VNU Journal of Economics and Business Vol. 29, No. 5E (2013) 16-33
16
Determinants of Dividend Payments of Non-financial
Listed Companies in Hồ Chí Minh Stock Exchange
Nguyễn Kim Thu
*
, Lê Vĩnh Triển, Dương Thúy Trâm Anh, Hoàng Thành Nhơn
*
International University,
Quarter 6, Linh Trung Ward, Thủ Đức Dist., Hồ Chí Minh City, Vietnam
Received 20 December 2013
Revised 20 December 2013; Accepted 30 December 2013
Abstract: This research aims to examine the determinants of dividend payments of non-financial
listed companies in the Hồ Chí Minh Stock Exchange (HOSE) in the period 2007 to 2012. Using
the Pooled Ordinary Least Square and the Fixed effect model (FEM) for panel data, the authors
found that in HOSE, the profitability of firms is statistically significant and negatively related to
payout ratio (DPR). In other words, companies tend to plow back more earnings when profitability
increases. Moreover, leverage has a positive and statistically significant relationship with DPR.
There are no statistically significant differences in DPRs among accommodation services, mineral
ore exploitation, investment consulting services and related services, supporting services, scientific
and technical services and the other services industry. Meanwhile, DPRs in the remaining
industries are statistically lower than those of the above-mentioned industries.
Keywords: Dividend policy, listed companies, HOSE.
1. Introduction
*
Vietnamese companies have been operating
in a difficult time since Vietnam joined the
World Trade Organization (WTO) in 2007. The
year 2007 can be considered as the threshold
when Vietnam opened its door to the world
market. However, with low competitiveness, it
has become harder for Vietnamese companies
to compete with their foreign rivals, especially
when trade protection barriers have been
gradually lowered according to WTO
agreements. In such a difficult context, dividend
policy, which is part of financing policy, has
______
*
Corresponding author. Tel.: 84-902988770
E-mail:
become more important for Vietnamese
companies. The decision of whether a company
should pay out all its net income as dividends,
or plow back part or all of its net income for
reinvestment, is the key decision. If companies
decide to keep a high dividend payout ratio,
they may please shareholders, especially when
other channels of investment such as real estate
turn sour and deposit rates plummet. However,
a high dividend payout policy can be costly in
case the companies have to search for external
financing for their investment projects. A low
(or even no) dividend payout policy, on the
other hand, may save the company from
seeking outside financing. Yet a low dividend
payout policy may not attract short-term
N.K. Thu et al. / VNU Journal of Economics and Business Vol. 29, No. 5E (2013) 16-33
17
investors who have the desire for current
income.
In Vietnam, most studies of dividend policy
are qualitative in nature. To the best knowledge
of the authors, there have been no extensive
studies on the dividend policy of Vietnamese
listed companies during the 2007-2012 period
that use quantitative models to identify the key
determinants of dividend payments. This paper
fills the gap in the literature review about
dividend policy in Vietnam, particularly in
HOSE during the 2007-2012 period.
This research aims to examine the
determinants of dividend policy of listed
companies in HOSE from 2007 to 2012.
Regarding this main objective, this paper will
aim to answer the following two research
questions:
- What are the firm-specific factors that can
affect the dividend policy of listed companies in
HOSE?
- Are there any differences in the dividend
policy among industries?
Besides this section, this paper consists of
five more sections. Section 2 presents the
theoretical background of dividend policy and
summarizes previous empirical studies on
determinants of dividend policy. Section 3
investigates the dividend payment practice of
listed companies in HOSE. Section 4 introduces
the regression model and section 5 presents data
analysis and findings from the regression
results. Finally, section 6 concludes the paper.
2. Literature review
Dividend policy is an integral part of a
firm’s financing decision. When a firm’s
investments generate free cash flow, it must
decide how to use that cash. It can reinvest the
cash in new investment opportunities and
increase the value of the firm. Alternatively, it
can hold those funds to pay cash out to
shareholders. If the firm decides to follow the
latter approach, it has two choices: It can either
pay a dividend or it can repurchase shares from
current owners.
Dividend is defined by Ross et al. (2007) as
the payment made out of a firm’s earnings to its
owners in the form of either cash or stock. The
most common type of dividend is a cash
dividend. A public company’s board of
directors determines the amount of the firm’s
dividend. The board sets the amount per share
that will be paid and decides when the payment
will occur.
An alternative way to pay cash to investors
is through a share repurchase. In this kind of
transaction, the firm uses cash to buy shares of
its own outstanding stock. These shares are
generally held in the corporate treasury and
they can be resold if the company needs to raise
money in the future.
Theories on dividend policy are derived
from the pioneering work of Miller and
Modigliani (M&M). In their seminar paper in
1961, M&M argued that the change in dividend
policy does not affect the value of a share of
stock. Their arguments were based on the
following assumptions: (1) Firms are operating
in perfect markets, which means that there are
neither taxes nor brokerage fees, and no single
participant can affect the market price of the
security through his or her trades; (2) All
individuals have the same beliefs concerning
future investments, profits, and dividends, i.e.,
these individuals have homogeneous
expectations; (3) The investment policy of the
firm is set ahead of time, and is not altered by
changes in dividend policy. Given those
N.K. Thu et al. / VNU Journal of Economics and Business Vol. 29, No. 5E (2013) 16-33
18
assumptions, M&M established that a firm’s
value is affected only by its investment
decisions, its earning power and business risks,
but not by its dividend policy. The changes the
managers make in dividend policy can be
undone by investors by either reinvesting
dividends or selling off stocks to achieve their
desired dividend stream.
However, real world financial markets do
not satisfy the strict conditions of perfect capital
markets. The presence of market imperfections,
such as taxes, asymmetric information, agency
costs and transaction costs implies that dividend
policy is relevant to the firm’s value under
several contexts.
There are two theories that support the
positive effect of dividend payments on firm
value. The first theory is the bird-in-hand
theory proposed by Gordon and Walter (1963),
which argues that since investors are risk-
averse, they prefer the current dividend to a
promise of a higher but risky income in the
future. In other words, “One bird in the hand is
worth more than two in the bush”. The second
theory that favors dividend payment is the
agency cost theory, which was first mentioned
by Rozeff (1982) and Easterbrook (1984). The
agency theory implies that dividend payments
play the role of keeping cash away from
managers, and therefore, reduce the agency
costs for the company.
Two other theories recognize the relevance
of dividend policy under certain conditions. The
signaling theory (which was discussed in
Bhattacharya (1979, 1980), Ross (1977), Miller
and Rock (1985)) argues that in a world with
asymmetric information, dividend policy affects
stock prices when the dividend policy signals
future prospects of the firm. In the context
where investors belong to different tax brackets,
the tax clientele theory (pointed out in John
Graham and Alok Kumar (2006)), establishes
that the dividend policy is relevant as long as
there remains a difference in the demand and
supply of high-dividend paying stocks. As long
as the demand for high-dividend-paying stocks
has been satisfied, dividend policy becomes
irrelevant.
On the contrary, the transaction cost theory
argues against dividend payments (Fama
(1974), Higgins (1972)). The transaction cost
theory argues that firms with high transaction
costs of equity or debt issuance should pay less
dividends, since it will cost them more to raise
external financing to meet investment needs.
The pecking-order theory (see Myers (1984),
and Myers and Majluf (1984)) asserts that firms
with more investment opportunities pay less
dividends, since those firms prefer internal
financing to issuing securities to finance their
investment needs.
Based on various theories, a number of
empirical studies have been conducted to
research the determinants of dividend policy. A
list of dividend policy determinants collected
from empirical studies is provided in Table 1.
Table 1: Independent variables-determinants of dividend payout ratio
Independen
t Variable
Proxy Expected
sign
Explanation Supporting
theory
Authors
Ownership
dispersion
Number of
common
stockholders
/Total
outstanding
shares
(+)
The more dispersed the ownership
structure, the more severe the agency
problems and thus the need for
monitoring managers also increases. If
dividends can act as a monitoring
mechanism by reducing cash available
Agency
theory
Rozeff
(1982)
Alli et al.
(1993)
Chen and
Dhiensiri
N.K. Thu et al. / VNU Journal of Economics and Business Vol. 29, No. 5E (2013) 16-33
19
for managers’ perquisite consumption, a
positive relationship between dividend-
payout ratio and ownership dispersion is
expected.
(2009)
Insider
ownership
Percentage
of common
stock held
by managers
(-)
One of the ways to reduce the agency
conflict between stockholders and
managers is to increase managers’
common stock ownership in the firm to
better align their interest with
stockholders’ interests. The higher the
proportion of common stock held by
managers, the lower the agency problem
and thus there is a reduction in the role of
dividends as a monitoring tool to control
agency costs. Thus, an inverse
relationship between insider ownership
and dividend-payout ratio is expected.
Agency
theory
Rozeff
(1982)
Alli et al.
(1993)
Chay and
Suh (2009)
Chen and
Dhiensiri
(2009)
Free cash
flow
FCF/Total
assets
(+)
The free cash flow hypothesis suggests
that firms with fewer growth
opportunities and more free cash flow
should pay higher dividends to prevent
managers from investing the cash at
below cost of capital or spending it on
wasteful activities
Agency
theory
Amidu and
Abor (2006)
Ahmed and
Javid (2009)
Gill et al.
(2010)
Mehta (2012)
Malik et al.
(2013)
Collateralisa
ble assets
Net fixed
assets/Total
assets
(+)
A firm with more collateralisable assets
has fewer agency problems between
shareholders and bondholders because
these assets may serve as collateral
against borrowing. The higher the
collateralisable assets, the less likely
bondholders will impose severe
restrictions on the firm’s dividend policy,
and hence, this will lead to a higher level
of dividend payments.
Agency
theory
Chen and
Dhiensiri
(2009)
Cash flow
volatility
Standard
deviation
from the
mean of the
ratio of
operating
cash flows
to total
assets
(-)
Dividends act as a signal for the stability
of the firm's future cash flows. If a firm’s
cash flow is volatile, firms maintain a
low dividend payout ratio to avoid having
to cut dividends in the future
Signaling
theory
Chen and
Dhiensiri
(2009)
Size Log of sales (+)
Larger firms tend to have easier access to
capital markets, lower issuing costs and
higher agency costs (Smith, 1977; Jensen
and Meckling, 1967). Therefore, a
positive relationship is expected between
size and dividend payout ratio.
Transaction
cost theory
Agency cost
theory
Alli et al.
(1993)
Eriotis
(2005)
Naceur et al
(2006)
Chay and
Suh (2009)
Chen and
Dhiensiri
(2009)
He et al.
N.K. Thu et al. / VNU Journal of Economics and Business Vol. 29, No. 5E (2013) 16-33
20
(2009)
Ahmed and
Javid (2009)
Rafique
(2012)
Mehta (2012)
Malik et al.
(2013)
Risk (Beta) (-)
Higher beta implies that the firm’s stock
is more risky and volatile in the market,
resulting in higher transaction costs of
external finance (Rozeff, 1982). Firms
with high equity beta will lower the
dividend payout to lower the cost of
external financing, and hence a negative
relationship is expected between beta and
payout ratio.
Transaction
cost
Rozeff
(1982)
Chen and
Dhiensiri
(2009)
Growth
Sales
growth
(-)
If past or anticipated future growth is
rapid, then managers tend to conserve
funds for reinvestment by establishing a
lower payout ratio (Rozeff, 1982). Hence
a negative relationship is expected
between growth rate and dividend
payout.
Transaction
cost
Rozeff
(1982)
Lloyd et al.
(1985)
Alli et al.
(1993)
Collins et al.
(1996)
D’Souza
(1999)
Amidu and
Abor (2006)
Chen and
Dhiensiri
(2009)
He et al.
(2009)
Gill et al.
(2010)
Rafique
(2012)
Malik et al.
(2013)
Profitability
Earnings
before
interest and
taxes/Total
assets
(+)
Since it is expensive to finance
investment with new risky securities,
dividends are low for firms with less
profitability. Thus, controlling for other
effects, more profitable firms pay more
dividends.
Pecking-
order theory
Lintner
(1986)
Jensen et al.
(1992)
Han et al.
(1999)
Fama and
French
(2000)
Naceur et al
(2006)
He et al.
(2009)
Ahmed and
Javid (2009)
Al-Kuwari
(2009)
Gill et al.
N.K. Thu et al. / VNU Journal of Economics and Business Vol. 29, No. 5E (2013) 16-33
21
(2010)
Rafique
(2012)
Mehta (2012)
Malik et al.
(2013)
Financial
leverage
Debt/Equity (-)
-Firms that are highly levered tend to
have high transaction costs, which then
lead to a reduction in dividend payments
in order to avoid the cost of external
financing (Rozeff, 1982; Myers, 1984)
-When a firm obtains debt, it makes a
fixed commitment to creditors, which
then reduces the discretionary funds
available to managers and subjects them
to the scrutiny of debt-suppliers. As a
result, highly leveraged companies will
pay lower dividends (Jensen, 1986)
Pecking
order theory
Transaction
cost theory
Agency cost
theory
Lloyd et al.
(1985)
Crutchley
and Hansen
(1989)
Jensen et al.
(1992)
Agrawal and
Jayaraman
(1994)
Collins et al.
(1996)
D’Souza
(1999)
Faccio et al.
(2001)
Gugler and
Yurtoglu
(2003)
Al-Malkawi
(2008)
Naceur et al
(2006)
Al-Kuwari
(2009)
He et al.
(2009)
Ahmed and
Javid (2009)
Gill et al.
(2010)
Rafique
(2012)
Mehta (2012)
Malik et al.
(2013)
Source: Authors’ summary.
3. Dividend payment of listed companies in
HOSE in the period of 2007-2012
Data related to the dividend payments of
286 non-financial listed companies in HOSE
was collected for the period from 2007 to 2012.
From the database, we make the following
observations on forms of dividend payments
and dividend payout ratios.
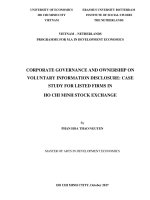
Figure 1 shows that most firms listed in
HOSE paid a cash dividend during 2007-2012.
On average, 66.1% of the total number of listed
firms in HOSE paid a cash dividend in the
study period. However, the proportion declined
in recent years, from 75.8% in 2008 to 46.8% in
2012. Meanwhile, the proportion of firms not
paying any type of dividends increased from
1.9% in 2007 to 45.4% in 2012. As a result, in
2012, the proportion of firms that did not pay
N.K. Thu et al. / VNU Journal of Economics and Business Vol. 29, No. 5E (2013) 16-33
22
any type of dividends approximately equaled
the proportion of firms that paid cash dividends.
Firms also tended to pay less stock dividends.
The number of firms paying stock dividends
accounted for 14.4% in 2007, however, this
proportion fell to 2.8% in 2012. The proportion
of firms paying both cash dividends and stock
dividends also declined from 16.3% in 2007 to
4.9% in 2012 (Data file provided by Vietstock
company).
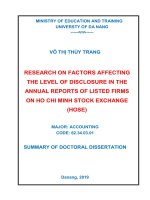
As can be observed from Figure 2, the cash
dividend payout ratio, defined as the cash
dividend per share divided by earnings per
share, climbed up and down during 2007-2009
before steadily increasing in the period of 2009-
2012. In particular, DPR rose from 30.1% in
2009 to 46% in 2012. The increasing trend in
DPR is due to the fact that earnings per share
(EPS) in HOSE was declining at a faster rate
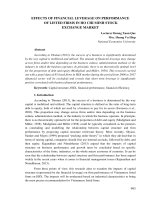
than the decrease in dividend yield. Figure 3
indicates that EPS was on a downward trend
since 2009 and fell by more than half, from
VND 4,433 per share in 2009 to VND 2,097 per
share in 2012. (Data file provided by
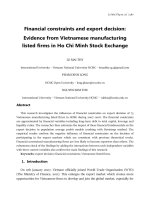
Vietstock). Meanwhile, the cash dividend yield,
defined as cash dividend per share divided by
par value, increased in the 2009-2010 period
before declining gradually from 14.6% in 2010
to 9.6% in 2012 (see Figure 4). EPS in HOSE
went down by 2.11 times from 2009 to 2012,
while dividend per share declined by 1.38 times
in the same time period.
In conclusion, the dividend payment
practices of non-financial listed companies in
HOSE in 2007-2012 can be characterized as
follows:
- Most firms paid dividends in the form of
cash dividends. However, the proportion of
firms paying cash dividends tended to decline,
while the proportion of firms that paid no
dividends rose. The proportion of firms paying
stock dividends also decreased.
- EPS declined dramatically, but dividend
yield (calculated on par value) declined at a
slower pace, hence cash DPR was still rising.
h
Figure 1: Proportions of firms with various forms of dividend payments in HOSE over the 2007-2012 period.
Source: Data file provided by Vietstock.
N.K. Thu et al. / VNU Journal of Economics and Business Vol. 29, No. 5E (2013) 16-33
23
Figure 2: Average cash dividend payout ratio of companies listed in HOSE (2007-2012).
Source: Data files provided by Vietstock.
Figure 3: Average EPS of companies listed in HOSE (2007-2012).
Source: Data file provided by Vietstock.
N.K. Thu et al. / VNU Journal of Economics and Business Vol. 29, No. 5E (2013) 16-33
24
Figure 4: Average cash dividend yield (on par value) of companies listed in HOSE.
Source: Data file provided by Vietstock.
4. Regression model
In this section, we conduct an empirical
study on the determinants of cash dividend
payout ratio of non-financial listed companies
in HOSE. Only the cash dividend payout ratio
is considered since cash dividend is the most
popular form of dividend payments in HOSE in
the period 2007-2012 as discussed in section 3.
In addition, beside the inaccuracy and
complexity of converting value of stock
dividend into cash, stock dividend is not
considered for analysis because of the
inconsistency in the way of calculating stock
dividend values among firms.
The limitation of relevant information and
the stability in dividend policy of financial
firms explain why this study only concentrates
on non-financial firms. For financial
institutions, such as banks and insurance
companies, the stability, including the stability
in dividend payment, is the priority to win the
trust of their customers. The cut or reduction in
dividend payment may result in unfavorable
reactions from the market. Hence, the dividend
payout ratios of financial firms do not show
much volatility compared with those of non-
financial firms. Thus, we find it more
interesting to research the dividend payments of
non-financial listed firms.
4.1. Hypothesis
Due to information unavailability for
ownership dispersion and cash flow volatility,
the study only includes eight firm-specific
factors assumed to have effects on cash DPR of
listed companies in Vietnam, which are insider
ownership, free cash flow, collateralisable
assets, firm size, firm risk, growth
opportunities, profitability and financial
leverage. Based on the theoretical arguments
presented in the literature review, the
corresponding hypotheses about the
relationship between each independent variable
and the dependent variable are as follows:
H
1
: There is a negative relationship
between insider ownership and DPR
H
2
: There is a positive relationship between
free cash flow and DPR
N.K. Thu et al. / VNU Journal of Economics and Business Vol. 29, No. 5E (2013) 16-33
25
H
3
: There is a positive relationship between
the level of collateralisable assets and DPR
H
4
: There is a positive relationship between
firm size and DPR
H
5
: There is a negative relationship
between firm risk and DPR
H
6
: There is a negative relationship
between growth opportunity and DPR
H
7
: There is a positive relationship between
profitability and DPR
H
8
: There is a negative relationship
between financial leverage and DPR
4.2. Methodology
In investigating the determinants of
dividend payout ratio, data was collected on
286 non-financial listed companies in HOSE
during the 2007-2012 period.
Our data set is panel data, which contains
observations on multiple companies observed
over a 6 year period. One appropriate method
for panel data is to use the Pooled Ordinary
Least Square (Pooled OLS) regression model.
However, since the Pooled OLS assumes the
intercept value of all cross-sectional unit are
the same, and that the slope coefficients of the
independent variables are identical for all the
individuals, it may distort the true picture of
the relationship between the dependent
variables and the independent variables
across the individuals.
In order to take into account the specific
nature of each individual, the fixed effect model
(FEM) can also be used. First, FEM will be run
in terms of cross section and time, allowing for
differences across individuals and differences in
time effect, respectively. Then, we take into
account both the individual and the time effects
by running the FEM in both cross section and
time concurrently.
In order to choose between the Pooled
regression model and the FEM, we check the
statistical significance of the estimated
coefficients, the R
2
value and the Durbin-
Watson value. We can also use the restricted F
test to check the validity of the restricted model
(the Pooled OLS). If F value is highly
significant, it means that the Pooled OLS is
invalid, and we may prefer the FEM to the
Pooled OLS.
Although straightforward to apply, fixed
effects modeling can be expensive in terms of
degrees of freedom if we have several cross-
sectional units. We use FEM in case there are
relevant explanatory variables that do not change
over time, and those unobserved variables may
have correlation with the explanatory variables.
However, if there is no correlation between the
error term and the explanatory variables, we use the
Random effect model (REM) to run the regression.
In order to choose between FEM and REM, we
conduct a test developed by Hausman (1978). The
null hypothesis underlying the Hausman test is that
the FEM and REM estimators do not differ
substantially. If the null hypothesis is rejected, the
conclusion is that REM is not appropriate and that
we may be better off using FEM.
4.3. Regression model and variable definitions
Our model can be written as:
DPR
it
= β
0
+ β
1
INSIDER
it
+ β
2
FCF
it
+
β
3
NFA
it
+ β
4
SIZE
it
+ β
5
BETA
it
+ β
6
GROWTH
it
+ β
7
ROA
it
+ β
8
LEVR
it
+ ε
i
(1)
The extended model includes eight non-
dummy explanatory variables and industry
dummies can be specifically expressed as:
DPR
it
= β
0
+ β
1
INSIDER
it
+ β
2
FCF
it
+
β
3
NFA
it
+ β
4
SIZE
it
+ β
5
BETA
it
+ β
6
GROWTH
it
+ β
7
ROA
it
+ β
8
LEVR
it
+ Σ λ
j
(INDS
j
)
i
+ ε
i
(2)
where j denotes industry dummies.
The variables with their definitions are
summarized in Table 2.
N.K. Thu et al. / VNU Journal of Economics and Business Vol. 29, No. 5E (2013) 16-33
26
f
Table 2: Variable definitions
Variable’s name Definition
Dependent Variable
DPR Defined as cash dividends per share divided by EPS
Independent Variables
INSIDER
FCF
NFA
Defined as number of shares owned by the top manager
divided by total number of shares outstanding
Defined as free cash flow divided by total assets
Defined as net fixed assets divided by total assets
SIZE
RISK
GROWTH
Defined as the natural logarithm of total sales
Defined as the company stock’s beta
Defined as the percentage of change in a firm’s sales
PROF Defined as net income divided by total assets
LEV Defined as total debts
(1)
divided by total shareholders’ equity
INDS 1 if the firm belongs to the industrial sector
otherwise
g
Source: Authors’ variable definitions.
5. Data analysis and findings
5.1. Descriptive statistics
Table 3 shows the descriptive statistics for
dependent and independent variables used in
the regression for companies listed in HOSE.
The dividend payout ratio of 286 non-financial
listed firms has a mean value of 57% with a
standard deviation of 59%. This means, on
average, listed firms in HOSE use 57% of their
earnings to pay dividends to shareholders. The
high gap between the maximum and the
minimum DPRs reflects the wild fluctuations in
the dividend payment practices of listed firms
in HOSE. The minimum DPR is a negative
number, which reflects the case that the
company maintains its dividend payment
despite a negative EPS. Like the dependent
variable, independent variables have their mean
and median relatively close to each other,
therefore eliminating the problem of outliers.
k
(1)
______
(1)
The total debts exclude account payables and other payables.
N.K. Thu et al. / VNU Journal of Economics and Business Vol. 29, No. 5E (2013) 16-33
27
d
Table 3: Descriptive statistics for listed firms in HOSE
Variable DPR INSIDER FCF NFA SIZE BETA GROWTH ROA LEV
Mean 0.57 0.05 0.01 0.29 11.88 0.84 0.32 0.09 1.36
Median 0.52 0.01 0.01 0.25 11.86 0.84 0.19 0.07 1.01
Maximum 10.37 0.60 0.45 0.95 13.42 10.05 23.14 0.50 22.77
Minimum -6.49 0.00 -0.48 0.01 9.24 -7.80 -0.73 -0.06 0.00
Std. Dev. 0.59 0.10 0.09 0.20 0.52 0.83 1.06 0.08 1.62
Skewness 5.04 3.26 -0.16 1.14 -0.22 0.00 15.17 1.65 5.96
Kurtosis 144.08 13.86 8.16 4.13 5.11 57.06 310.95 6.62 65.02
Jarque-Bera 575964.80 4619.22 768.32 187.02 133.52 84130.83 2756931.00 688.57 114836.40
Probability 0.00 0.00 0.00 0.00 0.00 0.00 0.00 0.00 0.00
Sum 393.39 31.16 8.49 197.05 8209.67 579.51 224.28 65.16 937.39
Sum Sq. Dev. 240.78 6.94 5.80 26.95 188.57 471.95 780.76 4.00 1813.04
Obs 691 691 691 691 691 691 691 691 691
Source: Table extracted from Eviews software.
5.2. Multicollinearity test
Table 4 shows the correlation coefficient
among variables of listed companies in HOSE.
The table reveals that most of the independent
variables had low correlation with the others, at
the highest absolute value of 0.392. The low
correlations among independent variables are a
great signal for eliminating multicollinearity.
The correlations between the dependent
variables and the independent variables will be
tested with the regression models in later parts.
Table 4: The correlation coefficients between variables of listed companies in HOSE
DPR INSIDER FCF NFA SIZE BETA GROWTH ROA LEV
DPR 1
INSIDER 0.066 1
FCF -0.091 -0.004 1
NFA 0.047 -0.057 -0.077 1
SIZE -0.014 0.081 0.055 -0.066 1
BETA 0.003 0.020 -0.033 -0.067 -0.001 1
GROWTH -0.032 0.041 0.042 -0.036 0.000 0.089 1
ROA -0.201 -0.111 0.147 -0.064 -0.045 -0.043 0.062 1
LEV 0.059 0.018 -0.011 -0.053 0.243 0.028 -0.003 -0.392 1
rg
Source: Table extracted from Eviews software.
5.3. Regression analysis
First, the Hausman test is conducted to
determine whether FEM or REM is a more
appropriate model. The Chi-Square Statistic
and Probability in Table 5 indicate that we
should reject the null hypothesis and choose the
Fixed Effect Model.
N.K. Thu et al. / VNU Journal of Economics and Business Vol. 29, No. 5E (2013) 16-33
28
d
Table 5: Correlated Random Effects - Hausman Test
Test Summary Chi-Sq. Statistic Chi-Sq. d.f. Prob.
Cross-section random 24.610876 8 0.0018
g
Source: Table extracted from Eviews software.
Table 6: Regression results for Pooled OLS and FEMs
Method
Pooled
OLS
FEM
(fixed cross section)
FEM
(fixed period)
FEM
(fixed cross section
and period)
Variables
C 0.9277
*
-2.5182 1.1204
**
1.9842
INSIDER 0.2898 -0.3806 0.2942 -0.5884
FCF -0.3773 -0.4072 -0.2447 -0.2659
NFA 0.0926 -0.0494 0.1007 -0.0118
SIZE -0.0204 0.2701 -0.0383 -0.1159
BETA -0.003 0.0015 0.0084 0.0051
GROWTH -0.0104 -0.0162 -0.0067 0.0228
ROA -1.4695
***
-2.8737
***
-1.4381
***
-2.4436
***
LEV -0.0039 0.1393
***
-0.0027 0.1581
***
R squared 0.0483 0.4487 0.0625 0.461
AdjustedR-
squared 0.0372 0.151 0.0445 0.1605
F stat 4.3332 1.5072 3.4765 1.534
Prob (F-stat) 0.000041 0.000104 0.00003 0.000052
DW value 1.0351 1.7813 1.0328 1.7928
*, **, *** Correlation is significant at the 0.1, 0.05 and 0.01 levels.
g
Source: Table extracted from our regression results using Eviews software
From Table 6, FEM is better than the
Pooled OLS since R-squared is higher in all
three FEMs. Among the three FEMs, the
FEM with fixed cross section and fixed
period is chosen since this model has higher
R-squared than FEM with fixed cross section
and FEM with fixed period; and has more
variables with statistical significance than the
FEM with fixed period.
The Breusch-Pagan test is then conducted
to check for heteroskedasticity problem in the
chosen model. The R-squared of the residual
regression model is 0.0193. With k = 8 and n =
691, the F statistic = 1.679, which is smaller
than the critical value at 5% significance level F
= 1.94. Therefore we cannot reject the null
hypothesis of homoskedasticity. It means there
is no heteroskedasticity in the model.
From Table 6, the FEM with fixed cross
section and fixed period indicates that ROA is
statistically significant and negatively related to
DPR. In addition, LEV has a positive and
statistically significant relationship with DPR.
N.K. Thu et al. / VNU Journal of Economics and Business Vol. 29, No. 5E (2013) 16-33
29
Specifically, the regression result shows
that when ROA increases by 1%, DPR
decreases by 2.44%. The result obtained from
our model is contrary to theoretical
predictions. According to the pecking-order
theory, dividends are lower for firms with
less profitability, since it is expensive to
make financial investments with new risky
securities. In other words, more profitable
firms will pay more dividends.
Our model also indicates that when
financial leverage increases by 1%, DPR
increases by around 0.16%. This result is
unexpected from the transaction cost theory’s
point of view. According to Rozeff (1982), and
Myers (1984), firms that are highly levered tend
to have high transaction costs, which then lead
to a reduction in dividend payments. Jensen
(1986) also argued that when a firm obtains
debt, it makes a fixed commitment to creditors,
which then reduces the discretionary funds
available to managers and subjects them to the
scrutiny of debt suppliers. As a result, highly
leveraged companies will pay lower dividends.
The regression results indicate some unique
features of listed companies in HOSE in the
2007-2012 period. Those companies tend to
plow back more earnings when profitability
increases. One possible explanation for this is
that since the study period is between 2007 and
2012, in which the Vietnamese economy is
under enormous fluctuations due to external
economic shocks and internal economic
problems, it becomes harder for firms to earn
profits. As a result, firms tend to retain more
earnings when their ROA increases to backup
for a later time when the business may run into
difficulties.
The positive relationship between financial
leverage and DPR is also unique in the case of
Vietnam. The financial leverage is calculated
by taking short-term debt (excluding account
payables and other payables) plus long-term
debt divided by equity. According to our data
file, short-term debts on average account for
78.6% of total debts of listed firms in HOSE.
We have conducted interviews with financial
experts and asked for their explanation for the
positive relationship between financial leverage
and DPRs of non-financial listed firms in
HOSE. They confirm the fact that companies
may borrow to pay dividends since it is not
prohibited in Vietnam’s Law on Enterprises. In
addition, there are a number of firms whose
managers are also investors in the stock market,
and when the stock price is declining, they
borrow money to pay dividends for
shareholders (including themselves) to offset
their loss in their stock investment. Also, firms
that incur loss tend to borrow to maintain the
dividend payments because they want to
preserve their reputation in the market.
Next, we run the regression for the
Equation (2) in section 4.3. Table 7 shows the
Pooled OLS regression model for 8
independent variables and the dummy variables.
Table 7: Regression result with dummy variables
Method Pooled OLS
Variables
C 1.7417
***
INSIDER 0.1992
FCF -0.4247
*
NFA 0.0856
N.K. Thu et al. / VNU Journal of Economics and Business Vol. 29, No. 5E (2013) 16-33
30
SIZE -0.0279
BETA -0.0031
GROWTH -0.0057
ROA -1.7768
***
LEV -0.0014
Dmanuf -0.6409
*
Dagr -0.6489
*
Dreal -0.8056
**
Dutility -0.6256
*
Dmineral -0.5464
Dcom -0.7251
**
Dconstruct -0.7597
**
Dtech -0.8314
*
Dtransport -0.8877
**
Daccom -0.4347
Dinvestconslt -0.791
Dsupport -0.7242
Dscientech -0.6265
R squared 0.0738
AdjustedR-squared 0.0448
F stat 2.5417
Prob (F-stat) 0.000186
DW value 1.0571
*, ** Correlation is significant at the 0.1, and 0.05 levels.
g
Source: Table extracted from our regression result using Eviews software.
In Table 7, Dmanuf, Dagr, Dreal, Dutility,
Dmineral, Dcom, Dconstruct, Dtech,
Dtransport, Daccom, Dinvestconslt, Dsupport
and Dscientech are dummy variables for the
manufacturing industry, agricultural-forestry-
fishery industry, real estate industry, public
utility industry, mineral ore exploitation
industry, commerce industry, construction
industry, technology and telecommunication
industry, transportation and storage industry,
accommodation service industry, investment
consulting services and related services,
supporting services industry, and the scientific
and technical services industry. The base
industry which is not included in the model is
the “other services” industry
(2)
.
The regression result in Table 7 indicates
that there are no statistically significant
differences in the DPRs among accommodation
services, mineral ore exploitation, investment
consulting services and related services,
supporting services, scientific and technical
______
(2)
The companies classified in the “other services”
industry in HOSE include Western Bus Station Joint-
Stock Company and Electrical and Technical Service
Joint-Stock Company. The former was listed in 2010 and
the latter was listed in 2011. Therefore data are not
available for the years before 2010.
N.K. Thu et al. / VNU Journal of Economics and Business Vol. 29, No. 5E (2013) 16-33
31
services and the other services industry.
Meanwhile, the DPRs in the remaining
industries are statistically lower than the DPRs
in the other services industry.
Based on the regression result, Table 8
classifies industries into three groups according
to the cash DPRs. Group 1 consists of industries
that have high DPRs, including accommodation
services, mineral ore exploitation, investment
consulting services and related services,
supporting services, scientific and technical
services and the other services industry. Group
2 includes industries that have DPRs around
60% lower than the DPRs of the other services
industry, which are utility, manufacturing, and
agricultural-forestry-fishery industry. Finally,
Group 3 lists those that have DPRs that are
more than 70% lower than the DPRs of the
other services industry, including commerce,
construction, real estate, technology and
telecommunication, transportation and storage.
Table 8: Groups of industries based on rankings of cash DPRs
Group Industries
1 Other services, Mineral ores, Investment consulting, Supporting services, Scientific
and technical services, Accommodation
2 Utility, Manufacturing, Agricultural-Forestry-Fishery
3 Commerce, Construction, Real estate, Technology and telecommunication,
Transportation and storage
Source: Authors’ rankings of industries based on the regression results
6. Conclusion
This paper investigates the dividend
payments of non-financial listed companies in
HOSE in the 2007-2012 period. The qualitative
discussion reveals that companies tend to
reduce or even pay no dividends in difficult
times for the economy. Between cash dividend
and stock dividend, cash dividend is the major
form of dividend payments, indicating the
attractiveness of cash in the context of
economic hardship and stock market slump.
The regression models using panel data
identify that ROA is statistically significant and
negatively related to DPR. In other words, firms
tend to plow back more when profitability
increases. In addition, financial leverage has a
positive relationship with DPR, which is
different from the theoretical prediction of the
relationship between financial leverage and
dividend payment. Other firm-specific variables
have no effects on DPR.
In the period of study, the Vietnamese
economy experienced major ups and downs due
to both the international economic crisis and
domestic economic problems. As a result, firms
tend to be more cautious in their dividend
payments. According to some financial experts
that we interviewed, when the economy gets
tough, firms tend to reserve funds to backup for
future uses. This is reflected in the negative
relationship between ROA and DPR. On the
other hand, the positive relationship between
financial leverage and DPR reflects the fact that
firms tend to borrow money to pay dividends
for various reasons, including keeping the
company’s reputation, or offsetting the
managers’ loss in their stock investment.
Finally, the regression result shows that there
are statistically significant differences in the DPRs
among industries. Mineral ores, accommodation
and service industries are among those that have
high DPRs. Meanwhile, construction, real estate,
N.K. Thu et al. / VNU Journal of Economics and Business Vol. 29, No. 5E (2013) 16-33
32
commerce, technology and telecommunication,
and transportation and storage industries are those
that maintain lower DPRs.
References
[1] Agrawal, A. and Jayaraman, N. (1994), “The
Dividend Policies of All-equity Firms: A Direct
Test of the Free Cash Flow Theory”, Managerial
and Decision Economics, 15(2), pp. 139-148.
[2] Ahmed, H. and Javid, A. (2009), “The
Determinants of Dividend Policy in Pakistan”,
International Research Journal of Finance and
Economics, 29(1), pp. 110-125.
[3] Al-Malkawi, H. and Nizar, H. (2008), “Factors
Influencing Corporate Dividend Decision: Evidence
from Jordanian Panel Data”, International Journal of
Business, 13(2), pp. 177-195.
[4] Al Kuwari, D. (2009), “Determinants of the
Dividend Policy in Emerging Stock Exchanges: The
Case of GCC Countries”, Global Economy and
Finance Journal, 2(2), pp. 38-63.
[5] Alli, K. L., Khan, A. Q., and Ramirez, G. G. (1993),
“Determinants of Corporate Dividend Policy: A
Factorial Analysis”, The Financial Review, 28(4),
pp. 523-547.
[6] Amidu, M. and Abor, J. (2006), “Determinants of
Dividend Payout Ratios in Ghana”, Journal of Risk
Finance, 7(2), pp. 136-145.
[7] Bhattacharya, S. (1979), “Imperfect Information,
Dividend Policy, and “the Bird in the Hand” Fallacy”,
Bell Journal of Economics, 10(1), pp. 259-270.
[8] Bhattacharya, S. (1980), “Non-dissipative Signaling
Structure and Dividend Policy”, Quarterly Journal
of Economics, 95(1), pp. 1-24.
[9] Chay, J. B. and Suh, J. (2009), “Payout Policy and
Cash-flow Uncertainty”, Journal of Financial
Economics, 93(1), pp. 88-107.
[10] Chen, J. and Dhiensiri, N. (2009), “Determinants of
Dividend Policy: The Evidence from New
Zealand”, International Research Journal of Finance
and Economics, 34, pp. 18-28.
[11] Collins, M. C., Saxena, A., and Wansley, J. (1996),
“The Role of Insiders and Dividend Policy: A
Comparison of Regulated and Unregulated Firms”,
Journal of Financial and Strategic Decisions, 9(2).
[12] D’Souza, J. (1999), “Agency Cost, Market Risk,
Investment Opportunities and Dividend Policy – An
International Perspective”, Managerial Finance,
25(6), pp. 35-43.
[13] Easterbrook, F. (1984), “Two Agency-cost
Explanations of Dividends”, The American
Economic Review, 74(4), pp. 650-659.
[14] Eriotis, N. (2005), “The Effect of Distributed
Earnings and Size of the Firm to its Dividend
Policy”, International Business and Economics
Journal, 4(1), pp. 67-74.
[15] Fama E. (1974), “The Empirical Relationship
between Dividend and Investment Decisions of
Firms”, The American Economic Review, 64(3),
pp. 304-318.
[16] Gill, M., Biger, N. and Tibrewala, R. (2010),
“Determinants of Dividend Payout Ratios:
Evidence from United States”, The Open Business
Journal, 3(1), pp. 8-14.
[17] Graham, J. and Kumar, A. (2006), “Do Dividend
Clienteles Exist? Evidence on Dividend Preferences
of Retail Investors”, Journal of Finance, 61(3), pp.
1305-1336.
[18] He, X., Li, M., Shi, J. and Twite, G. (2009),
“Determinants of Dividend Policy in Chinese
Firms: Cash versus Stock Dividends”, Journal of
Corporate Finance.
[19] Higgins, R. C. (1972), “The Corporate Dividend-
saving Decisions”, Journal of Financial and
Quantitative Analysis, 7(2), pp. 1527-1541.
[20] Jensen, G., Solberg, D., and Zorn, T. (1992),
“Simultaneous Determination of Insider Ownership,
Debt, and Dividend Policies”, Journal of Financial
and Quantitative Analysis, 27(2), pp. 247-263.
[21] Lintner, J. (1956), “Distribution of Incomes of
Corporations among Dividends, Retained Earnings,
and Taxes”, The American Economic Review,
46(2), pp. 97-113.
[22] Lloyd, W., Jahera, J. and Page, D. (1985), “Agency
Costs and Dividend Payout Ratios”, Quarterly
Journal of Business and Economics, 24(1), pp. 19-29.
[23] Malik, F., Gul, S., Khan, M. T., Rehman, S. U., and
Khan, M. (2013), “Factors Influence Corporate
Dividend Payout Decisions of Financial and Non-
financial Firms”, Research Journal of Finance and
Accounting, 4(1), pp. 35-46.
[24] Mehta, A. (2012), “An Empirical Analysis of
Determinants of Dividend Policy - Evidence from
the UAE Countries”, Global Review of Accounting
and Finance, 3(1), pp. 18-31.
[25] Miller, M. and Modigliani, F. (1961), “Dividend
Policy, Growth, and the Valuation of Shares”, The
Journal of Business, 34(4), pp. 411-433.
[26] Miller, M. and Rock, K. (1985), “Dividend Policy
under Asymmetric Information”, Journal of
Finance, 40(4), pp. 1031-1051.
[27] Myers, S. (1984), “The Capital Structure Puzzle”,
The Journal of Finance, 39(3), pp. 574-592.
N.K. Thu et al. / VNU Journal of Economics and Business Vol. 29, No. 5E (2013) 16-33
33
[28] Myers, S. and Majluf, N. (1984), “Corporate
Financing and Investment Decisions when Firms
have Information that Investors do not have”,
Journal of Financial Economics, 13(2), pp. 187-221.
[29] Naceur, S. B. and Goaied, M. (2002), “The
Relationship between Dividend Policy, Financial
Structure, Profitability and Firm Value”, Applied
Financial Economics, 12(12), pp. 843-849.
[30] Ross, S. (1977), “The Determination of Financial
Structure: The Incentive Signaling Approach”, Bell
Journal of Economics, 8(1), pp. 23-40.
[31] Ross, S., Randolph, A., Westerfield, W., and Jaffe,
J. (2008), Corporate Finance (Kindle Locations
17034-17035). McGraw-Hill Higher Education.
[32] Rozeff, M. (1982), “Growth, Beta and Agency
Costs as Determinants of Dividend Payout Ratios”,
Journal of Financial Research, 5(3), pp. 249-259.
[33] Rafique, M. (2012), “Factors Affecting Dividend
Payout: Evidence from Listed Non-financial Firms
of Karachi Stock Exchange”, Business
Management Dynamics, 1(11), pp. 76-92.
[34] Faccio, M., Lang, L., and Young, L. (2001),
“Dividends and Expropriation”, American
Economics Association, 91(1), pp. 54-78.
[35] Gugler, K. and Yurtoglu, B. (2003), “Corporate
Governance and Dividend Payout Policy in
Germany”, European Economic Review, 47(4), pp.
731-758.
D