Stock valuation in Vietnam theory, practice and recommendation the case SACOM
Bạn đang xem bản rút gọn của tài liệu. Xem và tải ngay bản đầy đủ của tài liệu tại đây (643.22 KB, 65 trang )
vietnam national university, HANOI
hanoi school of business
Ngo Viet Duc
STOCK VALUATION IN VIETNAM
THEORY, PRACTICE AND RECOMMENDATION
THE CASE SACOM
master of business administration thesis
Hanoi - 2007
vietnam national university, HANOI
hanoi school of business
Ngo Viet Duc
Stock valuation in Vietnam
THEORY, PRACTICE AND RECOMMENDATION
the case sacom
Major: Business Administration
Code: 60 34 05
Master of business administration thesis
Supervisor:
1. DR. CHU THANH
2. TRAN PHUONG LAN, MBA
Hanoi – 2007
TABLE OF CONTENTS
ABSTRACT i
TÓM TẮT ii
ACKNOWLEDGMENTS iii
LIST OF TABLES v
LIST OF FIGURES vi
INTRODUCTION 3
CHAPTER 1:
LITERATURE REVIEWS: STOCK AND STOCK VALUATION 5
1.1. STOCK – DEFINITION, TYPES AND FEATURES 5
1.2. VALUATION 8
1.2.1. Valuation 8
1.2.2. Value 8
1.2.3. Price 10
1.2.4. Time value of money 10
1.2.5. Present value 11
1.3. VALUATION MODELS 13
1.3.1. Internal Rate of Return (IRR) 15
1.3.2. CAPM 16
1.3.3. Book Value (BV) 18
1.3.4. P/E ratio (P/E) 18
1.3.5. Dividend Discount Model (DDM), Discounted Cash Flow (DCF) 19
CHAPTER 2:
APPLIED VALUATION METHODS IN EVALUATING CABLES AND
TELECOMMUNICATION MATERIALS JOINT-STOCK COMPANY (SAM) 22
2.1. OVERVIEW OF VALUATION METHODS IN VIETNAM 22
New requirements for enterprise valuation. 23
2.1.1. Valuation before 1996 23
2.1.2. Valuation 1996 – 1998 24
2.1.3. Valuation 1998 – present 25
2.1.4. Pros and cons of valuation methods in Vietnam 27
2.2. CABLES AND TELECOMMUNICATION MATERIALS JSC – SACOM
OVERVIEW 30
2.3. HISTORY OF SAM VALUATION AND PRICE 31
2
2.3.1. Stock market and SAM at early stage 31
2.3.2. Price adjustment and decrease period 32
2.3.3. SAM Internal Value 33
2.4. VALUATION OF SAM AT PRESENT 35
2.4.1. Applied Advantageous valuation method to value SAM quarterly stock prices in
2006 35
2.4.2. Applied P/E (Group D) to value SAM quarterly stock prices in 2006 36
2.4.3. Applied Dividend discount model – DDM (group C) to value SAM quarterly stock
prices in 2006 37
2.4.4. Applied Discounted Cash Flow Model – DCF (group C) to value SAM quarterly
stock prices in 2006 40
CHAPTER 3:
COMMENTS AND RECOMMENDATION OF THE VALUATION METHODS IN
VIETNAM 44
3.1. COMMENTS 44
3.1.1. Advantegeous value 44
3.1.2. P/E multiple 45
3.1.3. DDM, DCF 45
3.2. RECOMMENDATION TO APPLY VALUATION MODELS IN VIETNAM 47
3.2.1. Internal adjusting factors 49
3.2.2. External adjusting factors 50
CONCLUSION 52
REFERENCES 53
APPENDIX 54
APPENDIX 1. Beta of SAM over 280 weeks (2000-2006) 54
APPENDIX 2. SAM’s historical Balance Sheets 60
APPENDIX 3. SAM’s historical Income Statements 62
LIST OF FIGURES
Figure 1.3.2. Securities Market Line 17
Figure 2.3.2. SAM price movement (2000 – 2006) 30
LIST OF TABLES
Table 1.3.4. P/E facts 19
Table 2.1. Number of joint stock companies 2000-2004 22
Table 2.1.1. Equitized enterprises before 1996 24
Table 2.2. SAM Fundamental Financial Indicies 2000-2005 28
Table 2.3.1. Comparison between market price and listed price as expected by
enterprises 29
Table 2.3.3. Value of five listed securities according to accounting figures 31
Table 2.4.1. SAM 3 years Fundamental Financial Indicies 35
Table 2.4.2. P/E of listed stock 36
Table 2.4.4 (a). Historical FCFE for 05 years (2002-2006) 37
Table 2.4.4(b). Cashflow projection until the end of high growth period (2008).
Table 2.4.4(c). Cashflow projection until the end of high growth period (2008).
3
INTRODUCTION
1. Necessity of the thesis
The activity in stock market exchanges has increased much in Vietnam nowadays.
Consequently, the stock market is playing a growing important role to the society.
Many institutions as well as individuals are heavily invested in the stock market. In
order for the stock market to develop normally and stably, understanding valuation
techniques of firms is very important. Without some sorts of model to estimate
value, investors would not be able to arrive at conclusions on what price to buy or
sell an asset.
When researching different valuation results of a specific firm, the value often
differs – we can see the sample in SAM case discuss in next chapter. Different in
valuation may come from different views of the future or assumption or technique
and, hence, different recommended values. We can’t know which of these values is
the most accurate and this is only one of the many difficulties involved in valuation.
In Vietnam stock market, the situation is much more difficult since it’s an emerging
market and to some aspect, there’s no rule for market like this in its early stage.
This study will focus on several valuation models that mostly use in firm valuation
in Vietnam: Multiples (P/E), ABV, DDM and DCF in order to show the different of
each method and their results, through understanding of those model and try to find
the possible adjustment to make it accuracy.
2. Purpose
The overall purpose of this study is to establish some improvements of the available
valuation method currently applied in Vietnam stock market. The aim is to expose
some weaknesses of the method and the reasons behind. Further, the study will be
4
conducted to find solutions of these problems. This will be accomplished by a
literature study and a subsequent case study.
3. Methodology
The Thesis uses quantitative and qualitative approach and includes statements that
will give the reader an insight in, how the research area was approached, why it was
conducted in this way, how the work progressed, and, finally, the authors own
critical opinions of the study.
The intention is to introduce the reader to how the study was conducted as well as a
give the opportunity to develop a personal perception concerning the
trustworthiness of the study.
4. Outline of the Study
In the second part of this thesis the literature study will be conducted. The study
helps to understand the core concepts and the basic theories of valuation as well as
the basic understanding of stock market and value of a thing. It also contains a brief
introduction of the development of Vietnam stock market and valuation history in
Vietnam. That information is necessary for the discussion to valuation in practice.
The third part of the thesis is the case study of SAM company. In this we try to use
different approach of valuation to find solutions for value of SAM. By
understanding different methods, we can understand difficulties with each valuation
we applied and can work out to find ways to increase the accuracy of valuation.
The final part of the thesis is concerned with recommendations and conclusions of
how the valuation process can be improved and what should be adjusted to increase
the usefulness and accuracy of the valuation process involved in Vietnam stock
market.
5
CHAPTER 1:
LITERATURE REVIEWS: STOCK AND STOCK VALUATION
“Valuation: the determination, through prior analysis, of a price for a
business that might be paid by an investor “ (Hervé, 1993:95)
In this chapter relevant theories connected to our problem discussion will be
discussed.
The chapter begins with definitions and some possible discussions about some
concepts that will be important when the analysis is conducted. Thereafter, basic
theories of models are introduced. This is to give the reader insight how valuation
models work. Lately, history of Vietnam stock market is presented for setting up a
scenario for valuation in early stage.
1.1. STOCK – DEFINITION, TYPES AND FEATURES
Stock, also referred to as a share, is commonly a share of ownership in a joint stock
company (Copeland et al, 2000). The owners and financial backers of a company
may desire additional capital to invest in new projects within the company. If they
were to sell the company it would represent a loss of control over the company. It
may be represented by a certificate and can be common or preferred, voting or non-
voting, redeemable, convertible, etc…
There are kinds of stocks:
1.1.1. Common stock
Common stock, also referred to as common shares, is the most usual and commonly
held form of stock in a corporation (DeAngelo, 1990). The other type of shares that
6
the public can hold in a corporation is known as preferred stock. Common stock that
has been re-purchased by the corporation is known as treasury stock and is available
for a variety of corporate uses.
Common Stockholders are not guaranteed dividends, buy they expect to receive
higher dividends during the company’s prosperous periods. If a company fails or
liquidates, common stockholders are paid, after bondholders and preferred
stockholders.
Common stockholders assume the greater risk, but generally exercise the greater
control and may gain the greater award in the form of dividends and capital
appreciation. The terms common stock and capital stock are often used
interchangeably when the company has no preferred stock.
Holders of common stock have voting powers in the corporation and participate in
the profits of the corporation by way of dividends, but only after preferred
stockholders have been paid their dividends (DeAngelo, 1990).
1.1.2. Preferred stock
Preferred stock is a security that shows ownership in a corporation and gives the
holder a claim, prior to the claim of common stockholders, on earnings and also
generally on assets in the event of liquidation (Copeland et al, 2000). Most preferred
stock pays a fixed dividend that is paid prior to the common stock dividend. This
stock does not usually carry voting rights. Preferred stock has characteristics of both
common stock and debt.
A preferred stock shareholder forfeits his voting rights, but receives dividends
(which are set at a specified rate) before the common stock shareholder. In the event
7
of liquidation, bankruptcy preferred stock shareholders are paid before common
stock shareholders.
It can be considered that a preferred stock is a hybrid between a share and a bond
which, as opposed to ordinary shares, has a fixed yield, providing the issuer
achieves a minimum profit (DeAngelo, 1990). The fixed income stream of preferred
stock makes it similar in many ways to bonds.
1.1.3. Rights
Options granted to shareholders to purchase additional shares directly from the
company concerned. Rights are issued to shareholders in proportion to the securities
they may hold in a company (Fama and French, 1992).
Rights allow existing shareholders of a corporation to subscribe to shares of a new
issue of common stock before that stock is offered to the public on the stock market.
A right usually has a life of 2 to 4 weeks, is transferable, and entitles the holder to
buy the new common stock below the Public Offering Price. Rights are often
granted to protect existing shareholders from the effects of dilution.
1.1.4. Warrants
A warrant gives investors the right, but not the obligation, to buy a share at a certain
price (the exercise price) by a certain date in the future (Fama and French, 1992).
Warrants often accompany a share issue and they can be traded in the stock market
in their own right. The value of warrants is likely to be more volatile than the
underlying shares, and this can be a high-risk area of investment. Because of this it
is a regulatory requirement to sign a warrants risk warning prior to trading.
8
1.2. VALUATION
1.2.1. Valuation
Much of the literature has been written on corporate stock valuation approaches.
Damodaran (2002) provides extensive description of different stock valuation
models. He reviews the four models: Capital Asset Pricing Model (CAPM),
Arbitrage Pricing Model (APM), Multi-Factor Model (MFM), and Regression
Model (RM). It is mentioned that all models have two common assumptions: they
define risk in terms of variance of returns and argue that investment should be
viewed from the standpoint of the marginal investor.
Valuation is the process of "estimating" the value of an asset or liability. The value
is the price of the asset or liability times the quantity held. Valuation puts a value on
a security in relation to other securities. It is used to estimate the value of a piece of
property usually by considering its replacement cost or its actual cash value.
Factored into the estimate is any depreciation or wear and tear.
Valuation is the estimated or determined market value of a stock.
1.2.2. Value
Valuation of firms can be done for many reasons, such as to find a fair price to offer
an acquisition target, appraise an acquisition offer, or to find out the value of
owning a firm. There are several different ways to look at value and, furthermore,
there are several opinions on what creates value in a firm.
Book Value - The book value of a firm is obtained from the balances sheet by
taking the adjusted historical cost of the firm’s assets and subtracting the
liabilities. (Copeland et al, 2000)
9
As an accounting term, book value of a stock is determined from a company's
records, by adding all assets then deducting all debts and other liabilities, plus the
liquidation price of any preferred issues. The sum arrived at is divided by the
number of common shares outstanding and the result is book value per common
share. Book value of the assets of a company or a security may have little
relationship to market value. Book value often differs substantially from market
price. It is also used to determine the ultimate value of securities in liquidation.
Book value is calculated by the following:
Total assets minus (-) intangible assets (goodwill, patents etc) minus (-) any long-
term liabilities EQUALS (=) total net assets. This figure, divided by the number of
shares of preferred and/or common stock , gives the Net Asset Value - or Book
Value - per share of preferred or common stock. Book Value is often used as an
indicator for selecting undervalued stocks.
Market value - This is the price at which the property would change hands between
a willing seller and a willing buyer. (Copeland et al, 2000)
The market value of a security is the amount one would reasonably expect to pay
for it on the open market. The market value of a portfolio is the sum of the market
values of the individual securities comprising the portfolio. In particular, the market
value of a debt instrument is the present value of its future cash flows. The market
value of debt is negative because the cash flows are negative (interest and maturity
payments made by the province to the investor). Market value may be different
from the price a property could actually be sold for at a given time.
Economic value - The economic value is the value of the expected earnings from
using the item discounted at an appropriate discount rate to give the present–day
value. (Copeland, 2000)
10
Economic and intrinsic value is the amount by which the option is in the money or
the amount by which the price of a warrant or call option exceeds the price at which
the warrant or option may be exercised. For a call, this is the current underlying
price minus the exercise price. For a put, this is the exercise price minus the current
underlying price. An out of the money has no intrinsic value. An in the money
option, has some intrinsic value. It can be known as the portion of an options
premium that is attributed to the value that could currently be realized by exercising
and simultaneously closing out the position in the open market.
1.2.3. Price
Price is the amount of money needed to purchase something or the amount of
money, or other goods, that you have to give up to buy a good or service. In
economics and business, the price is the assigned numerical monetary value of a
good, service or asset. The concept of price is central to microeconomics where it is
one of the most important variables in resource allocation theory (also called price
theory). Price is also central to marketing where it is one of the four variables in the
marketing mix that business people use to develop a marketing plan.
The lowest price a security or commodity has reached in a certain period of time
such as a daily low or annual low. This can be expressed daily, weekly, monthly, or
for a 52 week period. The price of a market-based security is stated as a percentage
of face value.
1.2.4. Time value of money
The time value of money or the present discounted value is one of the basic
concepts of finance. Time value of money is the value derived from the use of
money over time as a result of investment and reinvestment (Fama and French,
1992). This term may refer to either present value or future value calculations. The
present value is the value today of an amount that would exist in the future with a
11
stated investment rate called the discount rate. For example, with a 10% annual
discount rate, the present value today of $110 one year from now is $100.
The principle that money received in the present is worth more than the same
amount received in the future. The concept, used as the basis for discounted cash
flow calculations that cash received earlier is worth more than a similar sum
received later, because the sum received earlier can be invested to earn interest in
the intervening period. For the same reasons, cash paid out later is worth less than a
similar sum paid at an earlier date.
1.2.5. Present value
Cash flow
Cash flow is the amount of cash earned after paying all expenses and taxes. Cash
flow is calculated by adding: net after-tax income plus any bookkeeping expenses
that result in items being deducted but not paid out in cash. Such bookkeeping
entries include amounts charged off for depreciation, depletion, amortization, and
charges to reserves. Cash flow is a measure of a company's worth and its ability to
pay dividends on its stock (DeAngelo, 1990).
It is also an analysis over a period of time revealing the availability, or lack, of cash.
More simply put the difference between cash in (income) vs. cash out (expenses).
Since money does not flow in and out at an equal rate, in most businesses, an
analysis of cash flow is important, especially of businesses that are cyclical in
nature, or subject to external forces. The statement of cash flows included in annual
reports analyzes all changes affecting cash in the categories of operations,
investments, and financing.
Cash flow forecast
Cash flow forecast is an estimate of when and how much money will be received
and paid out of a business. It usually records cash flow on a month-by-month basis,
12
for a period of two years. It is an estimate of the timing and amount of a company's
inflows and outflows of money measured over a specific period of time typically
monthly for one to two years then annually for an additional one to three years.
Cash flow per share
Cash flow per share is Earnings after taxes and depreciation, divided by the number
of a firm's shares. Cash flow from operations divided by average common shares
outstanding (DeAngelo, 1990). Cash flow from operations is the income for the
year before extraordinary items plus non-cash expenses (such as asset write-downs).
It shows how much money from operations is available for such things as new
equipment, debt repayment and dividends.
Free cash flow
This shows the cash generation, including the change in working capital and
investments in tangible/intangible assets and shareholdings.
Cash earnings + Change in working capital = Cash flow from operating activities
+ Cash flow from investing activities = Free cash flow
Free cash flow measures a firm's cash flow remaining after all expenditures required
to maintain or expand the business have been paid off for example, interest
payments and investments in "property, plant and equipment" (PP&E).
This is an accounting presentation showing how much of the cash generated by the
business remains after both expenses (including interest) and principal repayment
on financing are paid. A projected cash flow statement indicates whether the
business will have cash to pay its expenses, loans, and make a profit. Cash flows
can be calculated for any given period of time, normally done on a monthly basis.
13
In finance, cash flow refers to the amounts of cash being received and spent by a
business during a defined period of time, usually tied to a specific project. In
accounting, a cash flow projection sets out all the expected payments and receipts in
a given period. Managers use cash-flow projections to arrange for employees and
creditors to be paid at appropriate times
1.3. VALUATION MODELS
When deciding which model to use, the demands of the forecasting situation has to
be matched with the forecasting methods characteristics in the best way. Before
deciding which model to use one should ask the following questions (Copeland et
al, 2000):
What is the purpose of the model – how are the results supposed to be used?
Which variables and connections are in the system for which the forecast is
conducted?
How important is the historical development in order to predict the future
development?
Some of the most important factors to consider in the choice of forecast model are
according to Copeland et al (2000):
The time horizon of the forecast
The pattern of the data
Costs
Detail, the need for accuracy
Level of details
Access to data
User-friendly
14
The selection of appropriate valuation methods has been the subject of extended
debate over the last few years and will probably continue to be for many years to
come.
In almost all cases, a balance sheet will be prepared utilizing a variety of valuation
methods—the selection is normally based on the nature of the item and the
relevance and reliability of the method of accounting for that item. The different
methods give the same value at initial recognition. The most common valuation
models are:
Model group A: group of Net Asset Value: For an asset: the amount of cash, or its
equivalent, paid to acquire the item, commonly adjusted for depreciation or other
allocation. For a liability: the amount of cash, or its equivalent, received when the
obligation was incurred—sometimes adjusted for amortization or other allocations.
Model group B: group of Intrinsic Value: The amount of cash, or its equivalent,
that could be obtained by selling an asset in an orderly liquidation.
Model group C: group of Discounted Cash Flow: For an asset: the present value of
future cash inflows into which an asset is expected to be converted in the due course
of business, less present values of cash outflows necessary to obtain those inflows.
For a liability: the present value of future cash outflows expected to be required to
satisfy the liability in the due course of business (Kaplan & Ruback, 1995).
Model group D: group of Multiple Devices: The amount of cash, or its equivalent,
into which an asset is expected to be converted in the due course of business, less
any direct costs necessary to make that conversion.
15
Rather than force the selection of a single method for all valuations, it is more
important to acknowledge that utilization of different methods will continue in
practice, and the purpose of this thesis is developing recommendations on how to
select the appropriate method. The key issues in determining the appropriate
method are 1. Relevance and 2.Reliability.
Relevance: To be relevant, information about an item must have feedback value
and/or predictive value for users and must be timely. Information is relevant if it has
the capacity to make a difference in the decisions of owners, investors, creditors, or
other interested parties.
Reliability: To be reliable, information about an item must be representation ally
faithful, verifiable, and neutral. Information is reliable if it is sufficiently consistent
in its representation of the underlying resource, obligation, or effect of events; and
sufficiently free of error and bias to be useful to owners, investors, creditors, and
others in making decisions.
If two methods are equally relevant and reliable, then the method with the lowest
cost to the preparer would probably be chosen.
1.3.1. Internal Rate of Return (IRR)
Internal Rate of Return (IRR) is the discount rate at which the present value of the
future cash flows of an investment equals the cost of the investment (Copeland et al,
2000). It is found by a process of trial and error; when the net present values of cash
outflows (the cost of the investment) and cash inflows (returns on the investment)
equal zero, the rate of discount being used is the IRR. IRR indicates the business
return according to alternative return that may be gained on the same investment.
The internal rate of return is the discount rate that will create a zero net present
value. In other words, the discount rate that we should enter in the Net Present
Value (NPV) formula in order to get a result of NPV = 0
16
1.3.2. CAPM
Different from the existing cost of capital models (Arbitrage Pricing Model-APM,
RiskMetrics Model- RM…), CAPM uses variable of market premium and beta to
calculate cost of capital.
The Capital Asset Pricing Model (CAPM) is a model describing the relationship
between expected risk and expected return for financial assets (Ross Stephen,
1977). At its simplest, it takes the form of a linear relationship:
Rj = rf + ßj (Rm – rf)
Rj is the expected return of a security
ßj is the beta of the security
Rm is the expected return of "the market", e.g. the stock market
rf is the return on risk free assets
The rate of return on any asset consists of two components - the pure time value of
money and the risk premium reflecting the sensitivity of the asset to changes in
market returns. The beta value of an asset measures its sensitivity to general market
movements. A model in which the cost of capital for any security or portfolio of
securities equals the risk free rate plus a risk premium that is proportionate to the
amount of systematic risk of the security or portfolio
A model that promotes a basis for pricing risk associated with holding securities. Its
essence is that rates of return are directly related to a single common factor: namely,
the return on the market portfolio adjusted for non-diversifiable risk
17
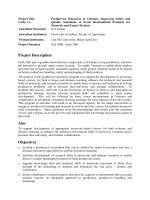
Figure 1.1. Securities Market Line
The Security Market Line (Figure 1.1) describes a relation between the beta and the
asset's expected rate of return.
Assumptions of CAPM (Ross Stephen, 1977).
- All investors have rational expectations.
- There are no arbitrage opportunities.
- Returns are distributed normally.
- Fixed quantity of assets.
- Perfect capital markets.
- Separation of financial and production sectors.
- Thus, production plans are fixed.
- Risk-free rates exist with limitless borrowing capacity and universal access
The capital asset pricing model is by no means a perfect theory. But the spirit of
CAPM is correct. It provides a usable measure of risk that helps investors determine
what return they deserve for putting their money at risk.
18
1.3.3. Book Value (BV)
Book value as generally calculate as a company's common stock equity that appears
on a balance sheet (Copeland et al, 2000). Book value equals to total assets minus
liabilities, preferred stock, and intangible assets such as goodwill.
This is how much the company would have left over in assets if it went out of
business immediately. Since companies are usually expected to grow and generate
more profits in the future, market capitalization is higher than book value for most
companies.
Since book value is a more accurate measure of valuation for companies which
aren't growing quickly, book value is of more interest to value investors than growth
investors (Markowitz and Harry, 1999).
1.3.4. P/E ratio (P/E)
The P/E multiple is one of the most popular multiples. This multiple is calculated
by dividing the price paid for unit to earnings per share generated by the company.
The price used to calculate a P/E ratio is usually the most recent price. The earnings
figure used is the most recently available, but this figure is often a year old and does
not necessarily reflect the current position of the company. Because of that, experts
prefer to choose a trailing P/E, P/E that involves taking earnings from the last four
quarters. It is possible, however, to use the earnings estimate for the next four
quarters. When doing so, the ratio is referred to as a projected P/E, or forward P/E
(French CW, 2003).
It is usually not enough to look at the P/E ratio of one company and determine its
status. Usually, an analyst will look at a company's P/E ratio compared to the
industry the company is in as well as the overall market. Only after a comparison
with the industry, sector, and market can an analyst determine whether a P/E ratio is
19
high or low with the above mentioned distinctions (i.e., undervaluation, over
valuation, fair valuation, etc).
Table 1.1. P/E facts
N/A
A company with no earnings has an undefined P/E ratio.
0-10
Either the stock is undervalued or the company's earnings are thought to be in
decline.
10-17
For many companies a P/E ratio in this range may be considered fair value.
17-25
Either the stock is overvalued or the company's earnings have decreased since
the last earnings figure was published.
25+
A company whose shares have a very high P/E either really does have an
exceptionally rosy future or the stock may be the subject of a speculative
bubble.
(Source: Bloomberg, 2001)
This multiple can be used for IPO valuations, for assessment of the overall
performance of the market, as well as for relative comparison between two firms’
profitability.
1.3.5. Dividend Discount Model (DDM), Discounted Cash Flow (DCF)
Valuation models, where all the future profits of the firm are specified, are called
fundamental valuation models. In different fundamental valuations models, the
common factor is that the value of the stock is determined by the present value of
the future cash flows that the firm’s activities give rise to. These valuation models
are usually divided into two categories, Dividend Discount Models (DDM) and
Discounted Cash Flow models (DCF). The difference is that the first discounts the
dividends that the firm is expected to pay its stockholders, while the second
discounts the free cash flow that the firm’s activities are expected to rise. (Copeland
et al, 2000)
The DCF models calculate the value of a business using its future benefits which
will generate by the owners. Earnings are forecast from a historical performance
base in some number of future years, usually five to ten years and then discounted
20
back to present using a discount factor specifically for that business (Damodaran,
2002).
Damodaran (2002) defines free cash flow (FCF) as a net income after reinvestments
and net debt payments that is a net cash flow available to equity holders. FCF
importance arises from the fact that FCF potentially represents cash flows that
should be paid to investors in terms of dividends. Because net income is often
manipulated by different accounting procedures, Damodaran discusses ways to
adjust operating income, with emphasis given to adjusting for and amortization of
operating leases, managed earnings, and long-term expenses.
Damodaran also cited two approaches to calculate terminal value using in DCF
models: liquidation value and stable growth value. When the liquidation value
approach is used, it is assumed that a company will cease its existence and its assets
will be sold at market prices at a given point of time. Under the stable growth
approach it is assumed that a company will grow forever at a constant rate, and
Gordon’s stock valuation formula is utilized to find a company’s worth.
The mainly problem of using the DCF model has identified two areas that are
important when conducting a valuation, (1) How to limit the subjectivity of the
assumptions and estimations behind the valuation, and, (2) How to make an
accurate forecast of the future sales revenue.
21
Summary of Chapter 1
Based on generalization about concepts of value, price and assessment of stock as
well as the role and significance of stock price assessment for individual
participating in the stock market, this chapter presents basic principles that need to
take into consideration about stock price assessment.
That is the basis of common stock price assessment methods that widely use in the
world presented in the following chapters. These methods also have advantages and
disadvantages and basically originated from enterprise assessment systems that have
specific characteristic of stock. In the next chapter, there will be a briefing about
valuation practice in Vietnam, laws and regulation that closely related to valuation
methods and a study case of SAM stock with different calculation models will be
applied to find out the differences of each.
22
CHAPTER 2:
APPLIED VALUATION METHODS IN EVALUATING
CABLES AND TELECOMMUNICATION MATERIALS
JOINT-STOCK COMPANY (SAM)
2.1. OVERVIEW OF VALUATION METHODS IN VIETNAM
Since 1986, the ―Renovation‖ period has created a momentum for the development
of State-Owned Enterprises (SOES) from district to central level, everywhere and in
every field. In early 1990s, there were more than 12.000 SOEs in operation, among
which many made little profit due to small capital.
In 1990, under the policy for multi-sector economy development of the State and
Party, with the publication of Company Law, joint stock companies were
established, creating the primary securities market in Vietnam for the first time. In
late 1990, there were nearly 300 joint stock companies in operation with a very
small capital and issued mainly internal stocks.
Enterprise Law promulgated in 1999 created a new development opportunity for all
economic sectors. Table 2.1 shows the growth rate of joint stock companies from
2000 – 2004 (before the promulgation of Enterprise Law 2005).
Table 2.1. Number of joint stock companies 2000-2004
Year
2000
2001
2002
2003
2004
Quantity
762
2.312
4.879
9.237
17.850
(Source: Central Institute of Economic Management)
Simultaneously, to achieve a comprehensive renovation and efficiency
improvement of the economy, the State has carried out many rearrangements of