Electrical energy business development strategy of Ho Chi Minh City power corporationin the period of 2011-2015, vision 2025
Bạn đang xem bản rút gọn của tài liệu. Xem và tải ngay bản đầy đủ của tài liệu tại đây (1.16 MB, 75 trang )
GaMBA01.D0109 Group 1
GRIGGS UNIVERSITY
GLOBAL ADVANCED MASTER OF BUISINESS ADMINISTRATION PROGRAM
CAPSTONE PROJECT REPORT
ELECTRICAL ENERGY BUSINESS
DEVELOPMENT STRATEGY OF
HO CHI MINH CITY POWER CORPORATION
IN THE PERIOD OF 2011-2015, VISION 2025
Group No. 1:
Nguyen Anh Vu
Tran Van Toan
Pham Chi Nghia
Dai Nguyen Vinh
Batch: GaMBA01.D0109
Ho Chi Minh 2010
GaMBA01.D0109 Group 1
2/75
TABLE OF CONTENTS
COVER PAGE
LIST OF ABBREVIATIONS 5
LIST OF TABLES 6
LIST OF FIGURES 6
Chapter 0. INTRODUCTION 7
Chapter 1. ARGUMENT BASIC 9
1.1. THE CONCEPT OF STRATEGIC MANAGEMENT 9
1.1.1. Concept of strategy 9
1.1.2. Strategic management 10
1.1.3. Alternative strategies defined 10
1.2. BASIS FOR FORMULATING BUSINESS STRATEGIES FOR FIRM 11
1.2.1. Analyzing the enterprise’s external environment 11
1.2.1.1. General environment 11
1.2.1.2. Industry environment 12
1.2.2. Analyzing the enterprise’s internal environment 15
1.2.2.1. Personnel 15
1.2.2.2. Finance 15
1.2.2.3. Marketing 15
1.2.2.4. Management 16
1.2.2.5. Information system 16
1.3. TOOLS FOR PLANNING AND CHOOSING STRATEGIES 17
1.3.1. Tools for planning strategies 17
1.3.1.1. Internal Factor Evaluation matrix (IFE) 17
1.3.1.2. Boston Consulting Group matrix (BCG) 18
1.3.1.3. External Factor Evaluation matrix (EFE) 19
1.3.1.4. Competitive Profile Matrix (CPM) 20
1.3.1.5. Strengths-Weaknesses-Opportunities-Threats matrix 21
1.3.2. Tools for choosing strategy – QSPM 22
GaMBA01.D0109 Group 1
3/75
Chapter 2. ANALYZING THE RECENT STATUS OF HO CHI MINH CITY
POWER CORPORATION 23
2.1. OVERVIEW OF HO CHI MINH CITY POWER CORPORATION 23
2.1.1. Introduction 23
2.1.2. Summarize the situation and business operation results of Ho Chi Minh Power
Corporation in stage 2005 - 2009 25
2.1.3. Forecast the demand for power in Ho Chi Minh City in 2011-2015 26
2.1.4. Strategic tasks and objectives of 2011-2015, vision 2025. 28
2.1.4.1. Tasks 28
2.1.4.2. Strategic objectives 28
2.2. BUILDING POWER BUSINESS STRATEGY OF HO CHI MINH CITY
POWER CORPORATION IN 2011-2015 29
2.2.1. Analyzing external environment 29
2.2.1.1. General environment 29
2.2.1.2. Industry environment 34
2.2.2. Analyzing the internal environment of Ho Chi Minh City Power Corporation 37
2.2.2.1. Human Resources 37
2.2.2.2. Finance 38
2.2.2.3. Marketing 39
2.2.3. Building and choosing business strategies 48
2.2.3.1. SWOT analysis 48
2.2.3.2. The bussiness strategies formed from SWOT matrix 49
2.2.4. Choosing strategies – QSPM 51
2.2.4.1. QSPM (Quantitative Strategic Planning Matrix) 51
2.2.4.2. Choosing strategies 53
Chapter 3. THE SPECIFIC SOLUTIONS TO IMPLEMENT STRATEGIES
54
3.1. SOLUTIONS TO DEVELOP GRID IN 2011-2015, VISION 2025 54
3.1.1. Objectives and requirements 54
3.1.2. Using technology 55
GaMBA01.D0109 Group 1
4/75
3.1.3. Implementation of the specific content 56
3.1.4. Mobilizing investment capital for renovation and construction of power grid . 57
3.2. SOLUTIONS TO IMPROVE THE QUALITY OF SERVICES 57
3.3. SOLUTIONS OF DESIGN TO IMPROVE POWER CONSUMPTION
MEASUREMENT SYSTEM 59
3.4. SOLUTION OF DEVELOPING POWER BUSINESS SERVICES 59
3.4.1. Services of maintenance and repairing substations belong to customer's asset 59
3.4.2. Services of consultancy for civil electrical design - using of electricity savings,
safety and efficiency 59
3.4.3. Development of electrical mechanics, electrical equipment manufacturing 60
3.5. SOME OPERATION MODEL SHOULD BE CONSIDERED IN THE
FUTURE 60
3.5.1. Privatizing the Corporation 60
3.5.2. Operating in a competitive market 61
Chapter 4. CONCLUSION 64
REFERENCES 65
APPENDIES 66
GaMBA01.D0109 Group 1
5/75
LIST OF ABBREVIATIONS
EVN: Electricity of Vietnam
EVNHCMC: Ho Chi Minh City Power Corporation
EVNSPC: Southern Power Corporation
EVNHANOI: Ha Noi Power Corporation
GDP: Gross domestic product
ODA: Official development assistance
IFE: Internal Factor Evaluation matrix
BCG: Boston Consulting Group matrix
EFE: External Factor Evaluation matrix
CPM: Competitive Profile Matrix
SWOT: strength-weaknesses- opportunities- threats
QSPM: Quantitative Strategic Planning Matrix
AS: Attractiveness Scores
TAS: Total Attractiveness Scores
SAIFI: System Average Interruption Frequency Index
SAIDI: System Average Interruption Duration Index
AMR: Automatic meter reading
AMI: Advanced metering infrastructure
QMS: Queue management system
SCADA: Supervisory Control and Data Acquisition
GIS: Geographic information system
GIS: Gas insulator system
GaMBA01.D0109 Group 1
6/75
LIST OF TABLES
Table 2.1. Some indicators of business results (unit: million USD) 25
Table 2.2. Estimated power demand each year of 2010-2015 27
Table 2.3. Forecast the power demand of HCM City in 2015, 2020 27
Table 2.4. Coefficient of elasticity of power demand in the period of 2009-2020 by
GDP 27
Table 2.5. Competitive Profile Matrix 35
Table 2.6. External Factor Evaluation matrix (EFE) 36
Table 2.7. Power consumption structure throughout the City 41
Table 2. 8. Internal Factor Evaluation matrix (IFE) 47
Table 2.9. Matrix of strength-weaknesses- opportunities- threats 48
Table 2.10. Quantitative Strategic Planning Matrix (QSPM) 51
LIST OF FIGURES
Figure 1.1. Strategic management process 10
Figure 1.2. The Five forces model of Michael E. Porter 13
Figure 2.1. The organization chart of EVNHCMC 24
Figure 2.2. Power loss rate 2000 - 2010 26
Figure 2.3. GDP growth rate 30
Figure 2.4. GDP per capita 32
Figure 2.5. Power supply reliability index 40
Figure 2.6. Point delivery chart 43
Figure 2.7. BCG matrix 46
GaMBA01.D0109 Group 1
7/75
Chapter 0. INTRODUCTION
Overview, the necessary and the significance of subject:
Currently, at the end of 2010, Vietnam in general and Ho Chi Minh City in
particular are in the process of economic development heading for the trend of
global economic integration, in which power is such a vital energy resource to serve
the needs of this development.
Directly under Electricity of Vietnam (EVN), one of the leading economic
corporations in Vietnam, Ho Chi Minh City Power Corporation (EVNHCMC) is
currently operating mainly in the electrical energy business, is in charge of
distribution and energy sales in the city area, is responsible for ensuring adequate
power supply with stable quality for the needs of socio-economic development of
the city. Since its establishment and development, the Corporation has completed
the above tasks.
However, with demand for electricity is increasing as the socio-economic
development of Vietnam together with the need to provide quality service to
customers have become increasingly complete, the Corporation should have
appropriate business strategies to meet those needs. On the other hand, with the
policy of restructuring state enterprises in the direction of equalization and
development of competitive retail electricity market in the future, the corporation
should also have good preparation in the business strategy in response to fulfill
these goals.
Therefore, realizing the necessity and importance of a business strategy to
meet the above requirements, the group has chosen a research topic: "Electrical
energy business development strategy of Ho Chi Minh City Power Corporation in
the period of 2011 - 2015, vision 2025”.
Purpose of research and practical possibility:
The research aims to evaluate the Corporation’s operation in 5 recent years
and identify the current strengths and weaknesses of the Corporation. Since then,
GaMBA01.D0109 Group 1
8/75
the identification of opportunities and challenges analyzed in the coming time for
corporation which enables it to build business strategies accordingly.
This is an opportunity for members of group to have further study on
strategic management, linked to the knowledge learned from the GaMBA program
of Griggs University – the United States to apply to a specific firm.
Members of group are currently working in Ho Chi Minh City Power
Corporation, having advantage conditions to collection necessary data so that we
will surely have a more accurate analysis. The research results will be very close to
the orientation of Corporation. Therefore, the topic is likely to have practical use for
the corporation further.
Research methodology:
Group uses the method: study rationale premise to have base in order to
collect statistical data needed to perform analysis, make remarks or evaluation in
oder to have appropriate solutions from them.
Project outline:
Beside acknowledgement, recommendation and conclusion, the project
contains these following sections:
- Chapter 1: Argument basic, which presents definition of strategic management,
tools for planning strategy will be supplied in the following chapters.
- Chapter 2: The overview of EVNHCMC, related statistic data attached and detail
analysis on the Corporation’s background, EFE, IFE, CPM, BCG, SWOT matrices
analysis, build up business strategies and selection strategies based on QSPM.
- Chapter 3: Strategies for power trade of Ho Chi Minh City Power Corporation in
the period of 2011 – 2015 and vision 2025, based on analysis in Chapter 2 and
recommendations for implementation.
- Chapter 4: Conclusion
GaMBA01.D0109 Group 1
9/75
Chapter 1. ARGUMENT BASIC
1.1. THE CONCEPT OF STRATEGIC MANAGEMENT
1.1.1. Concept of strategy
In 1962, strategy was defined as "determining the objectives and purposes of
the long-term business and the application of a series of actions as well as the
allocation of resources necessary to implement this objective” by Alfred Chandler.
Then, Johnson and Scholes defined the strategy of environmental conditions
to have many changes quickly: "Strategy is the direction and scope of an
organization over the long-term: which achives advantage for organisation through
its configuration of resources within a challenging environment, to meet the needs
of markets and to fulfil stakeholders expectations".
Strategies exist at several levels in any organisation - ranging from the
overall business (or group of businesses) through to individuals working in it.
- Corporate strategy is concerned with the overall purpose and scope of the
business to meet stakeholder expectations. This is a crucial level since it is heavily
influenced by investors in the business and acts to guide strategic decision-making
throughout the business. Corporate strategy is often stated explicitly in a "mission
statement".
- Business unit strategy is concerned more with how a business competes
successfully in a particular market. It concerns strategic decisions about choice of
products, meeting needs of customers, gaining advantage over competitors,
exploiting or creating new opportunities etc.
- Functional strategic is concerned with how each part of the business is
organised to deliver the corporate and business-unit level strategic direction.
Functional strategy therefore focuses on issues of resources, processes, people etc.
Currently, with the trends of globalization, companies are fast diversifying
their activities beyond national borders. Since then, global strategy is the choice to
confront the problems with international business.
GaMBA01.D0109 Group 1
10/75
1.1.2. Strategic management
Strategic management is the process of study and analyze environment
(internal and external) at present and in the future, planning for the organization’s
missions, implementation and controlling the implementation of decisions,
adjusting in oder to achieve these missions at present and in the future with the aim
to boost the enterprise’s trading position. (Prof. Lê Văn Bảy’s slides).
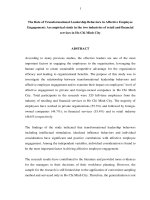
In fact, the process of strategic management includes 3 steps described as the
chart bellow (according to Fred R. David):
Figure 1.1. Strategic management process
1.1.3. Alternative strategies defined
According to Fred R. David (2009): alternative strategies that an enterprise
could pursue can be categorized into 11 actions:
- Forward vertical integration: Gaining ownership or increased control over
distributors or retailers.
- Backward vertical integration: Seeking ownership or increased control of a
firm’s suppliers.
Define
ojective,
mission and
strategy at
present
Redefine
business
missions
Distribute
resources
Measure and
evaluate
results
Conduct internal
control to realize
strengths and
weaknesses
Choose
strategic for
development
Make policy
Setting
long-
term goal
Setting
annual goal
Feedback
Feedback
Strategy Formulation
Strategy Implementation
Strategy Evaluation
Carry out external
control to realize
threats and
opportunities
GaMBA01.D0109 Group 1
11/75
- Horizontal integration: Seeking ownership or increased control over
competitors.
- Market penetration: Seeking increased market share for present products or
services in present markets through greater marketing efforts.
- Market development: Introducing present products or services into new
geographic areas.
- Product development: Seeking increased sales by improving present products or
services or developing new ones.
- Related diversification: Adding new, but related products or services.
- Unrelated diversification: Adding new, unrelated products or services.
- Retrenchment: Regrouping through cost and asset reduction to reverse declining
sales and profit.
- Divestiture: Selling a division or part of an organization.
- Liquidation: Selling all of a company's assets, in parts, for their tangible worth.
1.2. BASIS FOR FORMULATING BUSINESS STRATEGIES FOR FIRM
1.2.1. Analyzing the enterprise’s external environment
External environment is a system of complex factors; there are many
opportunities and risks affecting the operation of the business in various level.
Despite the scale of the huge potential resources, businesses also cannot react with
all of the environmental movements. Therefore, when performing analysis of
external factors, managers wishing to develop a portfolio of opportunities in the
environment can bring benefits to businesses and the risks or threats that enterprises
should take measures to prevent or avoid. External environment includes the
general environment and industry environment.
1.2.1.1. General environment
Economic environment: The environment impacts this nature directly and
more active than some other elements of the general environment. The evolution of
the macroeconomic environment has always contained the opportunities and threats
are different for each enterprise in various sectors, with potential impact to the
GaMBA01.D0109 Group 1
12/75
business strategy. Some basic factors are most interested: the trend gross domestic
product (GDP) and gross national product (GNP), interest rate and interest rate
trends, international balance of payments, inflation, system of taxes and tariffs…
Political and law environment: Include systems of perspectives, and
policies of the Party and State, the current law system. It is also necessary to master
the trend of political diplomacy of the government, the political developments at
home and abroad. These factors affect the formation and development of the
business.
Natural environment: These businesses with long history of operation
recognized the impact of natural circumstances in their business decisions. The
effects of natural includes: geographical location, climate, pollution, lack of energy
and wasteful use of natural resources and increasing demands on resources provided
by nature.
Social and demography environment: Social and demography
environment, including the key factors such as the concept of morality, the notion
of living, customs, concerns and priorities of society, the level of awareness and
general social education assembly. These factors affect the business strategies.
Therefore, enterprises should pay attention to these factors when planning a
business strategy.
Technological environment: The influence of technology creates
opportunities and risks in the process of strategic management for business.
Technological advances may create new markets, the result is to create new
products and making products and services is becoming obsolete. This environment,
strongly influences the production-related areas such as telecommunications,
information technology, information.
1.2.1.2. Industry environment
We apply the five forces model of Michael E. Porter (1985) for
environmental analysis of the business sector (also known as structural analysis of
competition in a sector).
GaMBA01.D0109 Group 1
13/75
Figure 1.2. The Five forces model of Michael E. Porter
(1) Competitors (rivals): Key content to analyze completion is shown in figure 1.4
What rivals want to achieve
What rivals are doing and can do
Future missions
In all administrative
division and multisides.
Current strategies
How the enterprise is
competing?
Recognition
Its influence on the industry.
Potentiality
Strengths and
weaknesses
Figure 1.1. Key content to analyze the rivals [Michael E. Porter (1985)]
Some issue to response about the rival
- Does the rival satisfy with the fact?
- The possibility rivals move and transfer
strategic trend?
- Weaknesses of the rivals?
- What can help rival to retaliate in the
strongest and the most effective way?
GaMBA01.D0109 Group 1
14/75
(2) Customers: Customers decide the existence of the business. The trust of
customers may be the most valuable assets to the business. Gained credibility
because it knows better way to meet the needs and tastes of customers from
competitors. Pressure from customers arising from the following conditions: when
the amount of people buying large proportion of the volume of goods sold by the
seller, when the shift to buy products of others do not cost much, when the buyers
give signal credible threat that will integrate backwards (reverse) with the customers
supplied, if the goods that customers buy the kinds of low level of specialization.
(3) Suppliers: Provider can assert their power by threatening to increase prices or
reduce product quality and service provision. Providers will have the advantage if
they have the following conditions: when only a small number of suppliers selling
to a large number of buyers in an industry, when substitutes are not available, when
goods or service providers which are essential and have a high level of
specialization, when suppliers make the signal credible threat integration is going
forward.
(4) Potential competitors: New competitors can participate in the factors that
reduce their profits by putting into operation new production capacities, with the
desire to gain market share and the necessary resources. Therefore, protecting the
competitive position of enterprises, including the maintenance of legal barriers to
prevent intrusion from outside. The main barrier is the advantage by large-scale
production, diversify products, the demand is greater financial resources, cost of
goods higher conversion, limited ability to penetrate the channel strong
consumption and cost advantages that competitors can not create.
(5) Substitute products: These substitute products to reduce the potential profits of
the sectors by imposing a ceiling price that companies in the industry can offer
within a profitable limit. The most concerning substitute products are: the products
are in the tradition of being possible to compete with the product prices are
competitive, the industry is highly profitable, the alternative product market
GaMBA01.D0109 Group 1
15/75
participants schools will be massively increased competition in the industry and
create a drop prices or improve quality.
1.2.2. Analyzing the enterprise’s internal environment
Analyzing the enterprise’s internal environment as a basis enable businesses
to know it’s strengths and weaknesses compared to competitors, and helps
managers to know the ability to capture a competitive advantage in each period.
Internal factors such as human resource functions, finance, marketing, operations
management and information systems.
1.2.2.1. Personnel
In the business environment are volatile as the current personnel plays a very
important role in the process of implementation strategies, determine the success or
failure of the business operation. If the strategy is properly given, promising, and
feasible but people in the organization is not qualified enough to perform given that
the strategy did not work. The main functions of Human Resources such as
recruitment, training, use, treatment, evaluation, encouragement and fire.
1.2.2.2. Finance
Financial condition is often considered as method to evaluate the competitive
position of the company's best and most attractive conditions for investors. Planning
effective strategies needs to identify the strengths and weaknesses of the business
financially. It is shown through the analysis of some basic financial criteria such as
liquidity, asset structure, capital structure, rate of profit this will make the
company’s development strategies became be more feasible.
1.2.2.3. Marketing
Do marketing research to identify market opportunities, market
segmentation, target market selection and market positioning, and customers
analysis, and factors related to planning a marketing strategy to consumer-oriented
and competitive marketing through its marketing businesses design, implement and
test the product strategy, pricing, distribution network and sales promotion.
GaMBA01.D0109 Group 1
16/75
Well-understand marketing activities, the administrator will specify the
duties of this function, the work required to be done in each period.
1.2.2.4. Management
Administration includes four basic functions such as planning, organizing,
leading and controlling.
- Planning: Includes all administrative activities related to preparing for the
future. Specifically, planning is estimating, setting goals, offering strategies,
developing policies, establishing plans.
- Organization: includes all management activities to create the structure of the
relationship between rights and responsibilities. Specifically, organizational
design, job specialization, job descriptions, detailed work, control expansion,
unified command, coordination arrangements, job design and job analysis.
- Leadership: Includes efforts to orient human activity, namely leadership,
communication, joint working groups, change activities, authorization,
improved work effectively; job satisfaction, organizational change, employees'
mental and management.
- Control: Relates to all management activities to ensure the results match reality,
consistent with the planned results. The principal activities: quality control,
financial control, sales, inventory, expenses, analyze changes, reward and
punishment.
1.2.2.5. Information system
Information links all business functions together and provides the basis for
all management decisions. It is the foundation of all organizations. The information
shows the disadvantages or major competitive advantage. Evaluate the strengths and
weaknesses of information systems within the company are important aspects of the
implementation of the internal control.
Information system is an important strategic resource, monitoring
environment changes, identifying competitive threats, and support for the
implementation, evaluation and control strategies.
GaMBA01.D0109 Group 1
17/75
1.3. TOOLS FOR PLANNING AND CHOOSING STRATEGIES
1.3.1. Tools for planning strategies
Within this project range, derived from the power trading performance in
EVNHCMC, the appropriate tools for planning strategies for the Corporation as
follows:
1.3.1.1. Internal Factor Evaluation matrix (IFE)
Internal Factor Evaluation matrix (IFE) is a tool used to summarize and
evaluate the strengths and weaknesses of the important parts of business functions,
and it also provides the basis for determining and evaluating relationships between
these components.
According to Fred R. David, IFE matrix can be developed in five steps:
- Step 1: List key internal factors as identified in the internal-audit process. Use a
total of from 10 to 20 internal factors, including both strengths and weaknesses.
List strengths first and then weaknesses. Be as specific as possible, using
percentages, ratios and comparative numbers.
- Step 2: Assign a weight that ranges from 0.0 (not important) to 1.0 (all
important) to each factor. The weight assigned to a given factor indicates the
relative importance of the factor to being successful in the firm’s industry.
Regardless of whether a key factor is an internal strength or weakness, factors
considered to have the greatest effect on organizational performance should be
assigned the highest weights. The sum of all weights must equal 1.0.
- Step 3: Assign a 1-to-4 rating to each factor to indicate whether that factor
represents a major weakness (rating = 1), a minor weakness (rating = 2), a
minor strength (rating = 3) or a major strength (rating = 4). Note that strengths
must receive a 3 or 4 rating and weakness must receive a 1 or 2 rating. Ratings
are thus company-based, whereas the weights in step 2 are industry-based.
- Step 4: Multiply each factor’s weight by its rating to determine a weighted score
for each variable.
GaMBA01.D0109 Group 1
18/75
- Step 5: Sum the weighted scores for each variable to determine the total
weighted score for organization.
Regardless of how many factors are included in an IFE matrix, the total
weighted score range from a low of 1.0 to a high of 4.0, with the average score
being 2.5. Total weighted scores well below 2.5 characterize organizations that are
weak internally, whereas scores significantly above 2.5 indicate a strong internal
position. The weights always sum to 1.0.
1.3.1.2. Boston Consulting Group matrix (BCG)
The BCG Matrix was created by the Boston Consulting Group (BCG) and it
became on of the most well-known portfolio management. Companies that are large
enough to be organized into strategic business units face the challenge of allocating
resources among those units. Resources are allocated to business units according to
where they are situated on the grid as follows:
- Cash Cow - a business unit that has a large market share in a mature, slow
growing industry. Cash cows require little investment and generate cash that
can be used to invest in other business units.
- Star - a business unit that has a large market share in a fast growing industry.
Stars may generate cash, but because the market is growing rapidly they require
investment to maintain their lead. If successful, a star will become a cash cow
when its industry matures.
- Question Mark (or Problem Child) - a business unit that has a small market
share in a high growth market. These business units require resources to grow
market share, but whether they will succeed and become stars is unknown.
- Dog - a business unit that has a small market share in a mature industry. A dog
may not require substantial cash, but it ties up capital that could better be
deployed elsewhere. Unless a dog has some other strategic purpose, it should be
liquidated if there is little prospect for it to gain market share.
The BCG matrix provides a framework for allocating resources among
different business units and allows one to compare many business units at a glance.
GaMBA01.D0109 Group 1
19/75
1.3.1.3. External Factor Evaluation matrix (EFE)
External Factor Evaluation matrix (EFE) for a summary and evaluation of
economic, social, culture, demography, geography, political, government, legal,
technology and competition information.
According to Fred R. David, the EFE matrix can be developed in five steps:
- Step 1: List key external factors as identified in the external-audit process.
Include a total of 10 to 20 factors, including both opportunities and threats, that
affect the firm and its industry. List the opportunities first and then the threats.
Be as specific as possible, using percentages, ratios, and comparative numbers
whenever possible.
- Step 2: Assign to each factor a weight that ranges from 0.0 (not important) to
1.0 (very important). The weight indicates the relative importance of that factor
to being successful in the firm’s industry. Opportunities often receive higher
weights than threats, but threats can receive high weights if they are especially
severe or threatening. Appropriate weights can be determined by comparing
successful with unsuccessful competitors or by discussing the factor and
reaching a group consensus. The sum of all weights assigned to the factors must
equal 1.0.
- Step 3: Assign a rating between 1 and 4 to each key external factor to indicate
how effectively the firm’s current strategies respond to the factor, where 4 = the
response is superior, 3 = the response is above average, 2 = the response is
average and 1 = the response is poor. Ratings are based on effectiveness of the
firm’s strategies. Ratings are thus company-based, whereas the weights in Step
2 are industry-based. It is important to note that both threats and opportunities
can receive a 1, 2, 3 or 4.
- Step 4: Multiply each factor’s weight by its rating to determine the weighted
score.
- Step 5: Sum the weighted scores for each variable to determine the total
weighted score for the organization.
GaMBA01.D0109 Group 1
20/75
Regardless of the number of key opportunities and threats included in an
EFE matrix, the highest possible total weighted score for an organization is 4.0 and
the lowest possible total weighted score is 1.0. The average total weighted score is
2.5. A total weighted score of 4 indicates that an organization is responding in an
outstanding way to existing opportunities and threats in its industry. In other words,
the firm’s strategies effectively take advantage of existing opportunities and
minimize the potential adverse effects of external threats. A total score of 1.0
indicates that the firm’s strategies are not capitalizing on opportunities or avoiding
external threats.
1.3.1.4. Competitive Profile Matrix (CPM)
The purpose of building competitive profile matrix (CPM) is to show the
clear picture to the Corporation about its strong points and weak points relative to
its competitors, then to identify competitive advantages of the Corporation and
weaknesses should be overcome. CPM was constructed through five steps:
- Step 1: Preparing a list of the main factors that affect critically to the
competitiveness of corporations in the industry.
- Step 2: Weighting: Weight attribute indicates the relative importance of factor
to being successful in the Corporation’s industry. The weight range from 0.0
means not important and 1.0 means important, sum of all assigned weight to
factors must equal to 1.0.
- Step 3: Rating the critical success factors ranging from 1 to 4 for each factor,
the rating of each factor depends on the ability of the Corporation with the
factors, of which 4 represents superior, 3 represents above average, 2 represents
average, 1 represents poor.
- Step 4: Weighted score: Multiplying the importance of each factor with its
weight to determine the score of each factor.
- Step 5: Total weighted score: Summing all weighted scores to get the total
weighted scores, final value of total weighted score should be between ranges
GaMBA01.D0109 Group 1
21/75
1.0 (low) to 4.0 (high). The average weighted score for CPM matrix is 2.5. Any
company with total weighted score falls below 2.5 will be considered as weak.
Compare the total score the Corporation with that of the weak competitors in
the industry to evaluate the competitive ability of the Corporation. The company
total weighted score higher then 2.5 consider as strong in position. The other
dimension of CPM is the firm with higher total weighted score considered as the
winner among the competitors.
1.3.1.5. Strengths-Weaknesses-Opportunities-Threats matrix
SWOT matrix is an important tool for combination which helps managers
develop four types of the following strategies:
- The strategic strengths - opportunities (SO)
- The strategic weaknesses - opportunities (WO)
- The strategic strengths - threats (ST)
- The strategic weaknesses - threats (WT)
According to Fred R. David, there are eight steps involved in constructing a
SWOT matrix:
- Step 1: List the firm’s key external opportunities.
- Step 2: List the firm’s key external threats.
- Step 3: List the firm’s key internal strengths.
- Step 4: List the firm’s key internal weaknesses.
- Step 5: Match internal strengths with external opportunities, and record the
resultant SO strategies in the appropriate cell.
- Step 6: Match internal weaknesses with external opportunities, and record the
resultant WO strategies.
- Step 7: Match internal strengths with external threats, and record the resultant
ST strategies.
- Step 8: Match internal weaknesses with external threats, and record the resultant
WT strategies.
GaMBA01.D0109 Group 1
22/75
1.3.2. Tools for choosing strategy – QSPM
According to Fred R. David, QSPM (Quantitative Strategic Planning Matrix)
uses input from the IFE matrix, EFE matrix and SWOT matrix. Six steps are needed
to develop a QSPM:
- Step 1: Make a list of the firm’s key external opportunities/threats and internal
strengths/weaknesses in the left column of the QSPM. This information should
be taken directly from the IFE matrix and EFE matrix. A minimum of 10
external key success factors and 10 internal key succes factors should be
included in the QSPM.
- Step 2: Assign weights to each key external and internal factor. These weights
are identical to those in the IFE matrix and the EFE matrix.
- Step 3: Examine the matching matrices and identify alternative strategies that
the organization should consider implementing. Record these strategies in the
top row of the QSPM. Group the strategies into mutually exclusive sets if
possible.
- Step 4: Determine the Attractiveness Scores (AS) defined as numerical values
that indicate the relative attractiveness of each strategy in a given set of
alternatives. Number of attractions are classified from 1 = not attractive, 2 =
somewhat attractive, 3 = quite attractive, and 4 = very attractive. If the critical
success factors had no influence on the choice of strategy; the attractive points
is not marked in this strategic group.
- Step 5: Compute the Total Attractiveness Scores (TAS). Total attraction is the
result of the classification score (Step 2) with some attractions (Step 4) in each
row.
- Step 6: Compute the Sum Total Attractiveness Scores (STAS). That is the sum
total of the attractions in the strategy columns of the QSPM. Considering all the
factors inside and outside can influence the appropriate strategy is to attract
higher score indicates more attractive strategy.
GaMBA01.D0109 Group 1
23/75
Chapter 2. ANALYZING THE RECENT STATUS OF HO
CHI MINH CITY POWER CORPORATION
2.1. OVERVIEW OF HO CHI MINH CITY POWER CORPORATION
2.1.1. Introduction
Ho Chi Minh City Power Corporation is an independent accounting
enterprise, belonging to Electricity of Vietnam (EVN).
- Name initials: EVNHCMC
- Address: #35 Ton Duc Thang Street, Ben Nghe Ward, District 1, Ho Chi
Minh City. Fax: (84.8) 2220.1155 - 2220.1166
- Website:
Ho Chi Minh City Power Corporation, previously known as the Ho Chi Minh
City Power Managing and Delivering Department was established on August 7,
1976 was a unit belonging to Southern Power Company (now the Southern Power
Corporation) – Ministry of Power and Coal, including 7 Offices, 5 Units of power
exploration and 2 Teams with total quantity about 1,000 staffs, following the
regulation of dependent accounting system, activity functions includes managing,
delivering, trading, improving and developing the power grid of Ho Chi Minh City.
On July 08, 1995, Ministry of Energy decided to set up Ho Chi Minh City Power
Company – state-owned enterprise, which belongs to Vietnam Power Corporation
(now Electricity of Vietnam – EVN). On February 05, 2010, Ministry of Industry
and Trade decided to set up Ho Chi Minh City Power Corporation based on Ho Chi
Minh City Power Company, acts following model of parent company-subsidiary as
the regulation of Business Law. Total charter capital of the Corporation is about 114
millions USD, which is holding 100% by Vietnam Electricity.
Main target of HCMC Power Corporation includes trading power; managing
and delivering power by transmission and distribution network in 24 districts of Ho
Chi Minh City; delivering other services such as: investigating, consulting, trading
telecommu-nication facilities … and other required mission of Vietnam Electricity.
GaMBA01.D0109 Group 1
24/75
Permanent Deputy
General Director
President – General Director
Deputy General Director of
Sales
Deputy General Director of
Construction investment
Deputy General Director of
Telecommunication and IT
Controllers
Chief Accountant
SÀI GÒN
PHÚ THỌ
CHỢ LỚN
GIA ĐỊNH
GÒ VẤP
TÂN THUẬN
BÌNH CHÁNH
BÌNH PHÚ
TÂN PHÚ
TÂN BÌNH
HÓC MÔN
THỦ ĐỨC
CẦN GIỜ
THỦ THIÊM
Power
Project
Manage-
ment Board
Building
Project
Manage-
ment Board
Load
Dispatch
Centre
High
Voltage
Power
Network
Company
Electrical
Testing
Company
Telecom-
munica-
tions & IT
Company
Trans-
portation
and
Ware-
house
Company
Power Companies
Project Management
Board
Companies
Adminis-
tration
Dept.
Person-
nel &
Organi-
zation
Dept.
Planning
Dept.
Ac-
counting
and
Finance
Dept.
Sales
Dept.
Engi-
neering
Dept.
Safety &
Labour
Protec-
tion
Dept.
Materials
& Import-
Export
Dept.
Invest-
ment
Manage-
ment
Dept.
Procure-
ment
Dept.
Telecom-
munica-
tions & IT
Dept.
Inspec-
tion
Security
Dept.
Legis-
lation
Dept.
Interna-
tional
Relation
Dept.
Public
Relation
Dept.
CỦ CHI
Figure 2.1. The organization chart of EVNHCMC [Source: EVNHCMC annual report]
GaMBA01.D0109 Group 1
25/75
2.1.2. Summarize the situation and business operation results of Ho Chi
Minh Power Corporation in stage 2005 - 2009
Table 2.1. Some indicators of business results (unit: million USD)
Items
Units
2005
2006
2007
2008
2009
Total assets
million
USD
288.56
298.80
333.08
322.09
330.82
Owner’s
Equity
million
USD
132.44
133.33
136.34
130.04
123.88
Commercial
Electricity
million
kWh
9,850
10,727
11,560
12,365
13,262
Loss rate
%
7.28
7.21
7.07
6.18
6.03
Average
selling price
USD/kWh
0.06
0.06
0.07
0.06
0.06
Customers
Household
1,325,228
1,412,213
1,507,986
1,601,017
1,676,364
Revenue
million
USD
599.51
650.08
787.10
788.27
881.07
Cost (exclude
loan’s interest
cost)
million
USD
585.68
638.29
777.31
778.60
875.88
Profit before
tax
million
USD
13.83
12.11
8.31
5.47
5.18
[Source: EVNHCMC annual report]
Revenue of the Corporation increases by an average 15% per year (in 2009
was 0.88 billion USD). However, costs also increases correspondingly. In
particular, the cost of EVN's electricity sales accounted for approximately 87.5%
electricity turnover. (Appendix of the report on the results of business activities).
With the capacity and installed capacity of electrical current system (Psetup
4,500MW), Ho Chi Minh City Power Corporation completely ensure stable
power supply for the city (Pmax = 2,547MW) and over 30% of the reserved power
supply. Accordingly, the Corporation has basically met the demand for electricity,
contributed to ensuring the growth of the city's annual GDP.
In addition, due to the policy of economic reform, social programs and
activeness of a big city, many export processing zones, industrial parks, residential
zones have developed to raise both quantity and quality of the customers. In 1995,
commercial electricity reached only 2,815 million kWh, end of 2009, it reached