quản trị rủi ro tài chính CH24 more on models and numerical procedures
Bạn đang xem bản rút gọn của tài liệu. Xem và tải ngay bản đầy đủ của tài liệu tại đây (666.26 KB, 37 trang )
More on Models and Numerical
Procedures
Chapter 25
Three Alternatives to Geometric Brownian Motion
Constant elasticity of variance (CEV)
Mixed Jump diffusion
Variance Gamma
CEV Model (page 562 to 563))
When α = 1 the model is Black-Scholes case
When α > 1 volatility rises as stock price rises
When α < 1 volatility falls as stock price rises
European option can be value analytically in terms of the cumulative
non-central chi square distribution
dzSSdtqrdS
α
σ+−= )(
CEV Models Implied Volatilities
σ
imp
K
α < 1
α > 1
Mixed Jump Diffusion Model (page 563 to 564)
Merton produced a pricing formula when the stock price follows a diffusion process overlaid
with random jumps
dp is the random jump
k is the expected size of the jump
λ dt is the probability that a jump occurs in the next interval of length dt
dpdzdtkSdS +σ+λ−µ= )(/
Jumps and the Smile
Jumps have a big effect on the implied volatility of short term options
They have a much smaller effect on the implied volatility of long term
options
The Variance-Gamma Model (page 564 to 566)
g is change over time T in a variable that follows a gamma process. This is a
process where small jumps occur frequently and there are occasional large jumps
Conditional on g, ln S
T
is normal. Its variance proportional to g
There are 3 parameters
v, the variance rate of the gamma process
σ
2
, the average variance rate of ln S per unit time
θ, a parameter defining skewness
Understanding the Variance-Gamma Model
g defines the rate at which information arrives during time T (g is
sometimes referred to as measuring economic time)
If g is large the the change in ln S has a relatively large mean and
variance
If g is small relatively little information arrives and the change in ln S has a
relatively small mean and variance
Time Varying Volatility
Suppose the volatility is σ
1
for the first year and σ
2
for the second and
third
Total accumulated variance at the end of three years is σ
1
2
+ 2σ
2
2
The 3-year average volatility is
2 2
2 2 2
1 2
1 2
2
3 2 ;
3
σ + σ
σ = σ + σ σ =
Stochastic Volatility Models (equations 24.2 and 24.3, page 567)
When V and S are uncorrelated a European option price is the Black-
Scholes price integrated over the distribution of the average variance
VL
S
dzVdtVVadV
dzVdtqr
S
dS
α
ξ+−=
+−=
)(
)(
Stochastic Volatility Models continued
When V and S are negatively correlated we obtain a downward sloping
volatility skew similar to that observed in the market for equities
When V and S are positively correlated the skew is upward sloping
The IVF Model (page 568)
SdztSdttqtrdS
SdzSdtqrdS
),()]()([
by replaced is
)(
model
motion Brownian geomeric usual The prices.
option observed matchesexactly that price
asset for the process a create todesigned
is modelfunction y volatilitimplied The
σ+−=
σ+−=
The Volatility Function (equation 24.4)
The volatility function that leads to the model matching all European option
prices is
)(
)]()([)(
2)],([
222
2
KcK
KctqtrKctqtc
tK
mkt
mktmktmkt
∂∂
∂∂−++∂∂
=σ
Strengths and Weaknesses of the IVF Model
The model matches the probability distribution of stock prices assumed by
the market at each future time
The models does not necessarily get the joint probability distribution of
stock prices at two or more times correct
Numerical Procedures
Topics:
Path dependent options using tree
Barrier options
Options where there are two stochastic variables
American options using Monte Carlo
Path Dependence:
The Traditional View
Backwards induction works well for American options. It cannot be used
for path-dependent options
Monte Carlo simulation works well for path-dependent options; it cannot
be used for American options
Extension of Backwards Induction
Backwards induction can be used for some path-dependent options
We will first illustrate the methodology using lookback options and then show how it
can be used for Asian options
Lookback Example (Page 570)
Consider an American lookback put on a stock where
S = 50, σ = 40%, r = 10%, ∆t = 1 month & the life of the option is 3 months
Payoff is S
max
-S
T
We can value the deal by considering all possible values of the maximum stock price at
each node
(This example is presented to illustrate the methodology. It is not the most efficient way of handling American lookbacks (See
Technical Note 13)
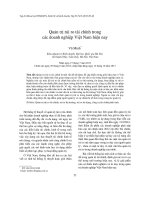
Example: An American Lookback Put Option (Figure 24.2, page 570)
S
0
= 50, σ = 40%, r = 10%, ∆t = 1 month,
56.12
56.12
4.68
44.55
50.00
6.38
62.99
62.99
3.36
50.00
56.12 50.00
6.12 2.66
36.69
50.00
10.31
70.70
70.70
0.00
62.99 56.12
6.87 0.00
56.12
56.12 50.00
11.57 5.45
44.55
35.36
50.00
14.64
50.00
5.47
A
Why the Approach Works
This approach works for lookback options because
The payoff depends on just 1 function of the path followed by the stock price. (We will refer to this as
a “path function”)
The value of the path function at a node can be calculated from the stock price at the node & from
the value of the function at the immediately preceding node
The number of different values of the path function at a node does not grow too fast as we increase
the number of time steps on the tree
Extensions of the Approach
The approach can be extended so that there are no limits on the number of
alternative values of the path function at a node
The basic idea is that it is not necessary to consider every possible value of the
path function
It is sufficient to consider a relatively small number of representative values of
the function at each node
Working Forward
First work forward through the tree calculating the max and min
values of the “path function” at each node
Next choose representative values of the path function that span the
range between the min and the max
Simplest approach: choose the min, the max, and N equally spaced values
between the min and max
Backwards Induction
We work backwards through the tree in the usual way carrying out calculations for
each of the alternative values of the path function that are considered at a node
When we require the value of the derivative at a node for a value of the path
function that is not explicitly considered at that node, we use linear or quadratic
interpolation
Part of Tree to Calculate Value of an Option on the
Arithmetic Average
(Figure 24.3, page 572)
S = 50.00
Average S
46.65
49.04
51.44
53.83
Option Price
5.642
5.923
6.206
6.492
S = 45.72
Average S
43.88
46.75
49.61
52.48
Option Price
3.430
3.750
4.079
4.416
S = 54.68
Average S
47.99
51.12
54.26
57.39
Option Price
7.575
8.101
8.635
9.178
X
Y
Z
0.5056
0.4944
S=50, X=50, σ=40%, r=10%, T=1yr, ∆t=0.05yr. We are at time
4∆t
Part of Tree to Calculate Value of an Option on the Arithmetic
Average (continued)
Consider Node X when the average of 5 observations is 51.44
Node Y: If this is reached, the average becomes 51.98. The option price is interpolated as
8.247
Node Z: If this is reached, the average becomes 50.49. The option price is interpolated as
4.182
Node X: value is
(0.5056×8.247 + 0.4944×4.182)e
–0.1×0.05
= 6.206