TÀI LIỆU Chapter 2. Analysis of Archimedean Spiral Antenna
Bạn đang xem bản rút gọn của tài liệu. Xem và tải ngay bản đầy đủ của tài liệu tại đây (716.16 KB, 51 trang )
8
Chapter 2. Analysis of Archimedean Spiral Antenna
The Archimedean spiral antenna is a popular of frequency independent antenna.
Previous wideband array designs with variable element sizes (WAVES) have used the
Archimedean spiral antenna as the radiating element. The Archimedean spiral is
typically backed by a lossy cavity to achieve frequency bandwidths of 9:1 or greater. In
this chapter the Numerical Electromagnetics Code (NEC) was used to simulate the
Archimedean spiral. Also, several Archimedean spirals were built and tested to validate
the results of the NEC simulations. Since the behavior of an Archimedean spiral antenna
is well known, the simulation and measurement results presented in this chapter serve to
validate the results found for the star spiral in Chapter 4 and the array simulations in
Chapters 5 and 6.
2.1 Theory
A self-complementary Archimedean spiral antenna is shown in Fig. 2.1. A spiral
antenna is self-complementary if the metal and air regions of the antenna are equal. The
input impedance of a self-complementary antenna can be found using Babinet’s principle,
giving
4
2
η
=
airmetal
ZZ (2.1)
where
η
is the characteristic impedance of the medium surrounding the antenna. For a
self-complementary Archimedean spiral antenna in free space the input impedance
should be
Ω== 5.188
2
o
in
Z
η
(2.2)
Each arm of an Archimedean spiral is linearly proportional to the angle,
φ
, and is
described by the following relationships
1
rrr
o
+=
φ
and
()
1
rrr
o
+−=
πφ
(2.3)
9
where
1
r is the inner radius of the spiral. The proportionality constant is determined from
the width of each arm, w, and the spacing between each turn,
s
, which for a self-
complementary spiral is given by
ππ
wws
r
o
2
=
+
=
(2.4)
r2
r1
s
w
Figure 2.1 Geometry of Archimedean spiral antenna.
The strip width of each arm can be found from the following equation
ww
N
rr
s =−
−
=
2
12
(2.5)
assuming a self-complementary structure. Thus the spacing or width may be written as
N
rr
ws
4
12
−
==
(2.6)
where
2
r is the outer radius of the spiral and N is the number of turns. The above
equations apply to a two-arm Archimedean spiral, but in some cases four-arm spirals may
be desired. In this case the arm width becomes
N
rr
w
arm
8
12
4
−
=
−
(2.7)
and the proportionality constant is
10
π
w
r
armo
4
4,
=
−
(2.8)
The Archimedean spiral antenna radiates from a region where the circumference
of the spiral equals one wavelength. This is called the active region of the spiral. Each
arm of the spiral is fed °180 out of phase, so when the circumference of the spiral is one
wavelength the currents at complementary or opposite points on each arm of the spiral
add in phase in the far field. The low frequency operating point of the spiral is
determined theoretically by the outer radius and is given by
2
2 r
c
f
low
π
= (2.9)
where
c is the speed of light. Similarly the high frequency operating point is based on
the inner radius giving
1
2 r
c
f
high
π
= (2.10)
In practice the low frequency point will be greater than predicted by (2.9) due to
reflections from the end of the spiral. The reflections can be minimized by using resistive
loading at the end of each arm or by adding conductivity loss to some part of the outer
turn of each arm. Also, the high frequency limit may be less than found from (2.10) due
to feed region effects.
2.2 Simulation
The Numerical Electromagnetics Code 4 (NEC4) was used as the primary
simulation tool in this dissertation (Burke, 1992). IE3D and measurements were used in
some cases to validate the results found with NEC4. However, due to problem size and
computer run-time constraints, NEC4 is a more practical code for this application. There
are two main areas of concern with modeling an Archimedean spiral in NEC4. The first
concern is the appropriate model for the feed region and the second is the relationship
between wire diameter and strip width to be used in the model. Another potential
problem area is modeling a lossy cavity. This can be done by using a lossy ground plane
in NEC4, but most simulations will be done in free space to avoid this problem since it is
not significant to the work presented in this dissertation.
11
For the Archimedean spiral in free space a single feed wire connects each arm to a
single voltage source at the center of the feed wire. Typically a wire radius of one quarter
the desired strip width is used in simulations as an appropriate transformation from strip
width to wire diameter. That is
4
w
a =
(2.11)
where a is the wire radius and w is the width of each spiral arm. So, a single feed wire
and the relationship of (2.11) will be used as starting points in the simulations. Another
important parameter in setting up the NEC4 simulation is the value of the inner radius,
1
r .
Through trial and error it was found that frequency independent behavior was achieved
only when the inner radius was equal to the strip width or spacing between turns,
swr ==
1
. Solving (2.6) for the inner radius equal to the width gives
14
2
1
+
=
N
r
r
(2.12)
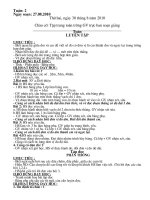
To demonstrate the effect of the inner radius on the problem, consider an
Archimedean spiral antenna with an outer radius of mr 1.0
2
= and 8 turns. The inner
radius will be varied from half the radius found using (2.12) to three times the radius
found using (2.12). The spiral is positioned in free space and a single feed wire and
source are used as previously described. The spiral parameters are summarized in Table
2.1, and Fig. 2.1 shows a picture of the corresponding spirals with different inner radii.
The effect of changing the inner radius is to increase or decrease the size of the hole in
the center of the spiral and the size of the feed wire. Fig 2.3 shows the input impedance
of the spirals as the inner radius is varied. When the inner radius is less than the arm
width the real part of the input impedance is less than the desired 188 ohms, and when the
inner radius is greater than the arm width the real part of the input impedance is greater
than expected. Also, when the inner radius is not equal to the arm width, both the real
and imaginary parts of the input impedance vary greatly with frequency. For a
frequency-independent, self-complementary spiral the input impedance should be 188
ohms and flat over a wide frequency range. This behavior is best achieved in NEC4
when the inner radius is equal to the arm width,
wr =
1
.
12
-0.1 -0.05 0 0.05 0.1
-0.08
-0.06
-0.04
-0.02
0
0.02
0.04
0.06
0.08
-0.1 -0.05 0 0.05 0.1
-0.08
-0.06
-0.04
-0.02
0
0.02
0.04
0.06
0.08
wr =
1
wr 5.0
1
=
-0.1 -0.05 0 0.05 0.1
-0.08
-0.06
-0.04
-0.02
0
0.02
0.04
0.06
0.08
-0.1 -0.05 0 0.05 0.1
-0.08
-0.06
-0.04
-0.02
0
0.02
0.04
0.06
0.08
wr 75.0
1
= wr 5.1
1
=
-0.1 -0.05 0 0.05 0.1
-0.08
-0.06
-0.04
-0.02
0
0.02
0.04
0.06
0.08
-0.1 -0.05 0 0.05 0.1
-0.08
-0.06
-0.04
-0.02
0
0.02
0.04
0.06
0.08
wr 2
1
= wr 3
1
=
Figure 2.2
Geometry of Archimedean spirals with various values of the inner radius.
13
Table 2.1 Parameters for Archimedean spiral with various inner radii. For all cases
there are 16 segments per turn and 5 segments on the feed wire.
Parameter
wr =
1
wr 5.0
1
= wr 75.0
1
= wr 5.1
1
= wr 2
1
= wr 3
1
=
2
r , [cm]
10 10 10 10 10 10
N 8 8 8 8 8 8
1
r , [cm]
0.3 0.15 0.23 0.45 0.61 0.91
w, [cm]
0.3 0.31 0.31 0.3 0.29 0.28
a , [cm]
0.0757 0.0769 0.0763 0.0746 0.0734 0.071
0 500 1000 1500 2000 2500 3000 3500 4000
-200
-100
0
100
200
300
400
500
Input Impedance vs. Frequency
Frequency, MHz
Impedance, ohms
r
1
=w
r
1
=0.5w
r
1
=0.75w
r
1
=1.5w
r
1
=2w
r
1
=3w
Figure 2.3 Simulated input impedance versus frequency for various values of the inner
radius. The solid lines represent the real part of the input impedance and the
dashed lines represent the imaginary part of the input impedance.
It is also necessary to validate the relationship between wire radius and wire width
given in (2.11). Consider the same spiral from the example above:
cmr 3.0
1
= ,
cmr 10
2
= , 8 turns, and the radius found using (2.11) is cma
o
0757.0= . The effect of
varying the wire radius is shown in Fig. 2.4. When the radius is smaller than
o
a the real
14
part of the input impedance is significantly higher than expected but the imaginary part of
the input impedance is improved. For a larger radius, the real part of the input impedance
is smaller than 188 ohms and less flat with frequency. The imaginary part of the input
impedance is also worse. Fig 2.4 shows that the typical relationship between wire radius
and wire width,
4/wa = , is a good approximation for simulating a spiral antenna in
NEC4.
0 500 1000 1500 2000 2500 3000 3500 4000
-200
-100
0
100
200
300
400
500
600
Input Impedance vs. Frequency
Frequency, MHz
Impedance, ohms
a=a
0
a=0.1a
0
a=0.5a
0
a=2a
0
a=3a
0
Figure 2.4 Simulated input impedance versus frequency for various values of wire
radius. The solid lines represent the real part of the input impedance and
the dashed lines represent the imaginary part of the input impedance.
Now that the appropriate NEC model for the Archimedean spiral has been
determined, the antenna performance can be evaluated. The voltage standing wave ratio
(VSWR) is typically used to measure antenna bandwidth. The VSWR for the spiral
modeled above,
cmr 3.0
1
= , cmr 10
2
= , 8 turns, cma 0757.0= , 16 segments per turn,
and 5 segments on the feed wire, is shown in Fig. 2.5. The VSWR referenced to 188Ω is
less than 2:1 for frequencies greater than 530 MHz. The input impedance and VSWR
are more sensitive to the small changes in geometry discussed above compared to the
radiation patterns and axial ratio. However, the radiation patterns and axial ratio must
15
also be verified in NEC4 since they will be important later in the array analysis. Fig. 2.6
shows the total far-field patterns for the same spiral modeled above:
cmr 3.0
1
= ,
cmr 10
2
= , 8 turns, cma 0757.0= , 16 segments per turn, and 5 segments on the feed
wire. The maximum gain at each frequency point, assuming no impedance mismatch, is
plotted in Fig. 2.7. The general trend is for the gain to increase with frequency as
expected.
0 500 1000 1500 2000 2500 3000 3500 4000
1
1.5
2
2.5
3
3.5
4
VSWR vs. Frequency
Frequency, [MHz]
VSWR
Figure 2.5 Simulated VSWR versus frequency.
16
10 0 -10 -20 -30 -40 -30 -20 -10 0 10
30
210
60
240
90 270
120
300
150
330
180
0
500 MHz
1000 MHz
2000 MHz
4000 MHz
Figure 2.6 Simulated radiation pattern plots versus theta for °= 0
φ
.
0 500 1000 1500 2000 2500 3000 3500 4000
4
4.5
5
5.5
6
6.5
Maximum Total Gain vs. Frequency
Frequency, MHz
Total Gain, dB
Figure 2.7 Simulated maximum gain versus frequency for °= 0
φ
.
17
The axial ratio is also a very important parameter for spiral antennas. It is desired
that the Archimedean spiral have circular polarization broadside to the antenna. The
simulated boresight (
°= 0
θ
) axial ratio versus frequency is shown in Fig. 2.8. Perfect
circular polarization is equal to an axial ratio of 0 dB, but an axial ratio less than 3 dB is
often considered acceptable. The axial ratio is less than 3 dB for frequencies of
approximately 700 MHz and higher compared to a VSWR less than 2:1 for frequencies of
about 530 MHz and greater. The difference in these two performance criteria can be
attributed to reflections from the end of each arm. The reflected wave has opposite sense
polarization compared to the outward traveling wave and has significant impact on the
axial ratio at the lower frequencies. Both the low frequency axial ratio and VSWR can be
improved by resistive loading at the end of each arm of the spiral. The axial ratio versus
theta is also of interest. Fig. 2.9 shows the axial ratio of the example spiral versus theta
for various frequencies. It is desirable for the axial ratio to be less than 3dB over the
broadest range of theta angles possible. The spiral has a 3dB or less axial ratio for
°<<°− 6060
θ
and frequencies above 1000 MHz. Also, as seen in Fig. 2.8, the spiral
has very poor axial ratio performance at 500 MHz.
0 500 1000 1500 2000 2500 3000 3500 4000
0
0.5
1
1.5
2
2.5
3
3.5
4
4.5
5
Boresight Axial Ratio vs. Frequency
Frequency, MHz
Axial Ratio, dB
Figure 2.8 Simulated boresight axial ratio versus frequency for °= 0
φ
.
18
-80 -60 -40 -20 0 20 40 60 80
0
2
4
6
8
10
12
14
16
18
20
Axial Ratio vs. Theta for Phi = 0
Theta, deg
Axial Ratio, dB
500 MHz
1000 MHz
2000 MHz
4000 MHz
Figure 2.9 Simulated axial ratio versus theta for various frequencies, °= 0
φ
.
The convergence criteria and limitations of NEC4 must also be investigated. In
the previous examples 16 segments per turn and 5 segments on the feed wire were used.
Fig. 2.10 shows the VSWR of the example spiral used above for different combinations
of number of segments per turn and segments on the feed wire. The VSWR is referenced
to 188 ohms. Fig. 2.10 is not intended to demonstrate a rigorous convergence test. As in
the earlier study of inner radius dimension and the strip width to wire diameter ratio, the
objective here is to find the combination of segments per turn and feed segments that
yield the best results compared to the 188Ω input impedance predicted by theory. The
figure clearly shows that both the number of segments per turn and the number of
segments on the feed wire affect the results. The best results are found with 10 segments
per turn and 3 segments on the feed wire and the second best convergence is found with
16 segments per turn and 5 segments on the feed wire. As frequency is increased there is
a general trend for the cases with more segments to degrade faster. This is probably due
to the breakdown in the thin wire approximation used by NEC4. For most cases in this
dissertation 16 segments per turn and 5 segments on the feed wire will be used for
19
consistency since simulations of the star spiral require 16 segments per turn to generate
the correct geometry. From Fig 2.10 it can be seen that for 16 segments per turn and 5
segments on the feed the VSWR is less than 2:1 for frequencies less than about 11 GHz,
which is much higher than necessary for the array simulations found in later chapters of
this thesis.
0 2000 4000 6000 8000 10000 12000 14000 16000
1
1.5
2
2.5
3
3.5
4
VSWR vs. Frequency
Frequency, [MHz]
VSWR
10 seg/turn & 3 on feed
10 seg/turn & 5 on feed
10 seg/turn & 7 on feed
10 seg/turn & 9 on feed
16 seg/turn & 3 on feed
16 seg/turn & 5 on feed
16 seg/turn & 7 on feed
16 seg/turn & 9 on feed
Figure 2.10 Performance test for Archimedean spiral with various numbers of
segments per turn and segments on the feed wire.
The performance test presented in Fig. 2.10 shows that satisfactory results are
found using 16 segments per turn, but a more rigorous convergence test is needed to
validate the results. A standard convergence test is shown in Fig. 2.11. The figure shows
the real part of the input impedance of the spiral versus number of segments per turn for a
few different frequencies. Five segments are used on the feed wire for all cases. Fig.
2.11 shows that 16 segments per turn is adequate for numerical convergence since the
input resistance is fairly flat above 16 segments per turn. The breakdown of the thin wire
approximation used in NEC4 is also clearly shown in Fig. 2.10. For frequencies above
8000 MHz the input impedance begins to deviate from the expected value of 188Ω as the
20
segment length becomes too large compared to the wavelength. For example, for 16
segments per turn, the longest segment is approximately 1.5 times the wavelength at
12000 MHz. At 16000 MHz the theoretical high frequency cutoff for the spiral is just
exceeded which further explains poor results.
10 15 20 25 30 35 40 45 50 55 60
50
100
150
200
250
Convergence Test: Input Resistance vs. Segments per Turn
Segments/turn
Input Resistance, [ohms]
500 MHz
1000 MHz
2000 MHz
4000 MHz
8000 MHz
12000 MHz
16000 MHz
Figure 2.11 Convergence plot of input resistance versus number of segments per turn.
2.3 Addition of Loss and Resistive Loading
The addition of conductivity loss or resistive loading to the end of each spiral arm
can be used to reduce reflections from the end of each arm. The question is how much
loss or resistance should be added and what best represents a practical antenna. In NEC4,
a resistive load can be added to any segment or conductivity can be assigned to any
segment. Both techniques reduce reflections from the end of the arm and improve the
low frequency VSWR and axial ratio.
Consider the example Archimedean spiral simulated in the previous section:
cmr 3.0
1
= , cmr 10
2
= , 8 turns, cma 0757.0= , 16 segments per turn, and 5 segments on
the feed wire. A resistive load of 188 ohms has been added to the last segment, last 2
segments, and last 3 segments of each arm. The 188 ohms was chosen to match the
desired input impedance of a self-complementary Archimedean spiral. A comparison of
21
the VSWR for the spiral with and without resistive loading is shown in Fig. 2.12. The
theoretical low frequency cutoff with this spiral is 477 MHz, which corresponds to the
red curve with 2 loads per arm. It is not practical to add excessive loss so that the
antenna operates below its theoretical limit. The addition of resistive loss improves the
impedance bandwidth of the spiral at the expense of the antenna gain. Fig. 2.13 shows a
plot of the maximum gain versus frequency for a number of load cases. At 500 MHz
there is about a 2 dB loss in gain when 2 loads per arm are used. Another important
parameter affected by the addition of loss is the axial ratio plotted in Fig. 2.14. This plot
shows a continuous improvement in the low frequency axial ratio as the number of loads
is increased. The plots show that the addition of loss to the end of each arm only effects
the low frequency performance of the antenna, but the amount of loss must be determined
by the tradeoffs between improved VSWR, axial ratio, and reduced gain.
0 500 1000 1500 2000 2500 3000 3500 4000
1
1.5
2
2.5
3
3.5
4
VSWR vs. Frequency
Frequency, [MHz]
VSWR
No loads
1 Load/arm
2 Loads/arm
3 Loads/arm
Figure 2.12 VSWR versus frequency for different number of loads. The loads are
added to the outer segments of each arm of the spiral. Each load is 188 ohms.
22
0 500 1000 1500 2000 2500 3000 3500 4000
-10
-8
-6
-4
-2
0
2
4
6
8
Maximum Total Gain vs. Frequency
Frequency, MHz
Total Gain, dB
No loads
1 Load/arm
2 Loads/arm
3 Loads/arm
Figure 2.13 Maximum gain versus frequency for different number of loads. The loads
are added to the outer segments of each arm of the spiral. Each load is
188 ohms.
0 500 1000 1500 2000 2500 3000 3500 4000
0
1
2
3
4
5
6
7
8
9
10
Boresight Axial Ratio vs. Frequency
Frequency, MHz
Axial Ratio, dB
No loads
1 Load/arm
2 Loads/arm
3 Loads/arm
Figure 2.14 Axial ratio versus frequency for different number of loads. The loads are
added to the outer segments of each arm of the spiral. Each load is 188
ohms.
23
Loss may also be added by introducing a finite conductivity to a segment.
Figures 2.15, 2.16, and 2.17 show the VSWR, maximum gain, and axial ratio for the
example spiral when finite conductivity is used. The conductivity is added to the last half
turn of each arm of the spiral. The results for using resistive loads versus finite
conductivity are very similar, but the conductivity method allows for slightly better
control. Since both methods correspond to practical techniques for adding loss to a
spiral, the best method may depend on the particular application.
0 500 1000 1500 2000 2500 3000 3500 4000
1
1.5
2
2.5
3
3.5
4
VSWR vs. Frequency
Frequency, [MHz]
VSWR
No loss
σ
= 20000
σ
= 10000
σ
= 5000
σ
= 2000
σ
= 1000
Figure 2.15 VSWR versus frequency for different conductivities. The conductivity is
added to the last half turn of each arm of the spiral.
24
0 500 1000 1500 2000 2500 3000 3500 4000
-10
-8
-6
-4
-2
0
2
4
6
8
Maximum Total Gain vs. Frequency
Frequency, MHz
Total Gain, dB
No loss
σ
= 20000
σ
= 10000
σ
= 5000
σ
= 2000
σ
= 1000
Figure 2.16 Maximum gain versus frequency for different conductivities. The
conductivity is added to the last half turn of each arm of the spiral.
0 500 1000 1500 2000 2500 3000 3500 4000
0
1
2
3
4
5
6
7
8
9
10
Boresight Axial Ratio vs. Frequency
Frequency, MHz
Axial Ratio, dB
No loss
σ
= 20000
σ
= 10000
σ
= 5000
σ
= 2000
σ
= 1000
Figure 2.17 Axial ratio versus frequency for different conductivities. The conductivity
is added to the last half turn of each arm of the spiral.
25
2.4 Ground Plane Effects
Spiral antennas are typically backed by a lossy cavity, which restricts the
radiation to one hemisphere and improves impedance bandwidth at the expense of a 2-3
dB gain reduction due to the decrease in antenna efficiency. Recently the use of spiral
antennas with conducting ground planes has become more popular. These types of
spirals have more gain but the axial ratio and pattern bandwidths are drastically reduced
compared to spirals backed by lossy cavities. Most of the spiral element and array
simulations in this thesis will be simulated in free space, but for some cases it may be
desirable to use a ground plane.
There are two approaches that can be used to add a ground plane and still obtain
three or more octaves of bandwidth. The first is to use a lossy ground plane. This option
allows the specification of a relative permitivity and conductivity of the ground plane to
be used in a reflection coefficient approximation or a Sommerfeld/Norton approximation
to the ground plane. The other possibility is to construct a conical shaped ground plane
that maintains quarter wavelength spacing between the spiral and the ground plane in the
vicinity of the active region of the spiral (Drewniak, et al., 1986).
The spiral that has been used throughout this chapter has
cmr 3.0
1
= , cmr 10
2
= ,
8 turns,
cma 0757.0= , 16 segments per turn, and 5 segments on the feed wire. For this
spiral, Fig. 2.18 shows the effect on the VSWR of a ground plane using the reflection
coefficient approximation with various levels of loss. The spiral is spaced a quarter
wavelength,
md 0375.0= , above the ground plane for a center frequency of 2000 MHz.
The VSWR is greatly affected by the ground plane below 2000 MHz. However, even for
the perfect electric conductor (pec) ground case, the VSWR is essentially unaffected
above 2000 MHz. A lossy ground plane with a relative permeability of 1=
r
µ
and a
conductivity of
005.0=
σ
yields results equivalent to those found in free space. The
axial ratio shows very similar trends to the VSWR as seen in Fig. 2.19. The radiation
pattern bandwidth is also very important. For a pec ground, a null is expected at 4000
MHz for the spacing,
md 0375.0= , used in this example, which corresponds to 2/
λ
spacing above g round. The radiation patterns versus theta plots are shown in Fig. 2.20 at
26
a frequency of 4000 MHz. Once again the results show that values of 13=
r
µ
and
7=
r
µ
give satisfactory results, but a 1=
r
µ
agrees best with the free space results.
0 500 1000 1500 2000 2500 3000 3500 4000
1
1.5
2
2.5
3
3.5
4
VSWR vs. Frequency
Frequency, [MHz]
VSWR
Perfect Ground
µ
r
=13,
σ
=0.005
µ
r
=7,
σ
=0.005
µ
r
=1,
σ
=0.005
Free Space
Figure 2.18 VSWR versus frequency for different levels of ground plane loss.
0 500 1000 1500 2000 2500 3000 3500 4000
0
2
4
6
8
10
12
14
16
18
20
Boresight Axial Ratio vs. Frequency
Frequency, MHz
Axial Ratio, dB
Perfect Ground
µ
r
=13,
σ
=0.005
µ
r
=7,
σ
=0.005
µ
r
=1,
σ
=0.005
Free Space
Figure 2.19 Axial Ratio versus frequency for different levels of ground plane loss.
27
10 0 -10 -20 -30 -40 -30 -20 -10 0 10
30
210
60
240
90 270
120
300
150
330
180
0
Perfect Ground
µ
r
=13,
σ
=0.005
µ
r
=7,
σ
=0.005
µ
r
=1,
σ
=0.005
Free Space
Figure 2.20 Radiation pattern plots versus theta for different levels of ground plane
loss.
°= 0
φ
, 4000=f MHz.
The use of a conical ground plane is a technique for achieving wideband behavior
without adding loss (Drewniak, et al., 1986). For instance, the example spiral has a outer
radius of
cmr 10
2
= corresponding to an approximate low frequency cutoff of 500 MHz
and the inner radius of
cmr 3.0
1
= corresponds to an approximate high frequency cutoff
of 15 GHz. These two frequencies along with the outer radius of the spiral are used to
determine the dimensions of the conical ground plane, as shown in Fig. 2.21. The conical
ground plane was simulated using a wire grid model with 13 radials and 11 rings, placed
on a planar, perfectly pec ground plane. The spiral is placed at a height of
md 095.0=
above the ground plane, which corresponds to quarter wavelength spacing at a frequency
of 789 MHz. The tip of the conical ground plane is 0.005m below the center of the
spiral, which corresponds to quarter wavelength spacing at a frequency of 15 GHz.
28
Figure 2.21 Geometry of spiral antenna with conical ground plane.
A comparison of the performance of the conical ground plane versus other types
of ground planes is shown in the Figs. 2.22-2.26. Fig. 2.22 shows the VSWR for the
various types of ground simulations and for free space. For a 2:1 VSWR, the conical
ground performs equally as well as free space or the lossy ground and out performs the
perfect ground by about 1000 MHz at the low frequency. The broadside gain of the
spiral antenna using different types of ground planes is presented in Fig. 2.23. The gain
of the spiral using a perfect ground plane shows the formation of a null around 4000 MHz
as expected from the pattern plots of Fig. 2.20. The gain using a conical ground
fluctuates from 2.5 dB to 12 dB, but the points of low gain do not indicate null formation.
Figure 2.24 shows the patterns for a frequency range covering three octaves. The
patterns are all well formed with a small amount of ripple seen at certain frequencies.
Patterns for the points of minimum gain are shown in Fig. 2.25. Once again the patterns
show some ripple and they are not as uniform as in free space but they do not have nulls.
The final parameter of interest is axial ratio, shown in Fig. 2.26. The conical ground
plane slightly out performs the perfect ground plane in terms of maximum axial ratio in
the frequency band of interest, but for an axial ratio less than 3 dB they perform about the
same.
29
0 500 1000 1500 2000 2500 3000 3500 4000
1
1.5
2
2.5
3
3.5
4
VSWR vs. Frequency
Frequency, [MHz]
VSWR
Free Space
Perfect Ground
µ
r
=13,
σ
=0.005
Conical Ground
Figure 2.22 Comparison of VSWR versus frequency for different types of ground
planes.
0 500 1000 1500 2000 2500 3000 3500 4000
2
4
6
8
10
12
14
Maximum Total Gain vs. Frequency
Frequency, MHz
Total Gain, dB
Free Space
Perfect Ground
µ
r
=13,
σ
=0.005
Conical Ground
Figure 2.23 Comparison of gain versus frequency for different types of ground
planes.
30
15 5 -5 -15 -25 -35 -35 -25 -15 -5 5 15
30
210
60
240
90
270
120
300
150
330
180
0
500 MHz
1000 MHz
2000 MHz
3000 MHz
4000 MHz
Figure 2.24 Radiation pattern plots versus theta for various frequencies covering three
octaves of frequency bandwidth.
°= 0
φ
10 0 -10 -20 -30 -40 -30 -20 -10 0 10
30
210
60
240
90 270
120
300
150
330
180
0
1350 MHz
2250 MHz
3700 MHz
Figure 2.25 Radiation pattern plots versus theta for frequencies at the minimum gain
points.
°= 0
φ
31
0 500 1000 1500 2000 2500 3000 3500 4000
0
2
4
6
8
10
12
14
16
18
20
Boresight Axial Ratio vs. Frequency
Frequency, MHz
Axial Ratio, dB
Free Space
Perfect Ground
µ
r
=1,
σ
=0.005
Conical Ground
Figure 2.26 Comparison of axial ratio versus frequency for different types of ground
planes.
The results for the conical ground plane presented above could be extended,
however, some general trends have been observed. First, placing the spiral closer (than
used in this example) to a perfect electrically conducting ground beneath the conical
structure can reduce the ripple observed in the radiation patterns at the expense of a
greater VSWR at the low end of the frequency range. An optimum spacing should exist
to maximum the both parameters. Secondly, the points of minimum gain seen in Fig.
2.20 vary as the structure of the conical ground plane is changed. It may be possible to
shift the minimum gain points out of the frequency bands of interest by appropriately
picking the number of radials and rings used to model the conical ground plane. Also,
the use of a solid conical ground plane may eliminate this problem entirely.
2.5 Measurements
A number of circular spirals were built and measured to validate the theoretical
and simulated results. The spirals were printed on Rogers RT/duroid 5880, which has a
dielectric constant of 2.2. The pattern measurements were performed in the Virginia
Tech anechoic chamber using a near-field scanner, and a HP 8753 vector network
32
analyzer was used to measure input impedance. The input impedance of the spirals was
measured using a 2-port measurement technique developed by Davis (1995). The input
impedance is found from the 2-port s-parameters using the following equation
1211
1211
1
1
2
ss
ss
ZZ
oin
+−
−+
= (2.13)
where Ω= 50
o
Z .
For ease of comparison to the star spiral in Chapter 4, each circular spiral that was
built and tested had an outer radius of mr 0507.0
2
= and 16=N turns. Fig. 2.27 shows
the measured input impedance for three circular spirals with different strip widths
compared to a simulated spiral. The simulated result and spiral #1 have the standard
width of
o
waw == 4 , which gives the best results for a complementary spiral as detailed
in Section 2.2. Spiral #2 has a strip width based on the average of the free space and
dielectric relative permittivities,
(
)
oo
www 81.02.21/2 =+= . Lastly, spiral #3 has a
strip width based on an earlier attempt to match the simulated results to the measured
results. The resulting strip width is
oo
www 59.02.215.1/ == . The three spirals are
shown in Fig. 2.28. The strip width increases from left to right.
The curves of Fig. 2.27 show the same trends as seen in Fig. 2.4, where the effect
of different wire radii was investigated. Spiral #2,
o
ww 81.0= , is closest to a
complementary spiral and compares best to the simulated spiral, particularly at lower
frequencies. Spiral #1,
o
ww = , has a strip width greater than that of a complementary
spiral due to the effect of the dielectric, and as expected from Fig. 2.4 the input resistance
is less than 188 ohms. Spiral #3 has a strip width thinner than that of a complementary
spiral which results in an input resistance greater than 188 ohms. All of the measured
results show a fair amount of noise and the input resistance tends towards 100 ohms with
increasing frequency. The noise can be reduced by performing the measurements in an
anechoic chamber, as was done here, but not completely eliminated.