food neophobia among the finns and related responses to familiar and unfamiliar foods
Bạn đang xem bản rút gọn của tài liệu. Xem và tải ngay bản đầy đủ của tài liệu tại đây (243.19 KB, 9 trang )
Food neophobia among the Finns and related responses to familiar
and unfamiliar foods
Hely Tuorila
a,
*, Liisa La
È
hteenma
È
ki
a,1
, Leena Pohjalainen
b
, Leila Lotti
b
a
Department of Food Technology, PO Box 27, FIN-00014 University of Helsinki, Finland
b
MDC Food and Farm Facts, PO Box 505, FIN-02101 Espoo, Finland
Received 31 March 2000; received in revised form 6 July 2000; accepted 10 July 2000
Abstract
A representative sample of the Finns (n=1083) rated the familiarity of 20 foods designated to be ``familiar'' or ``unfamiliar'' and
willingness to try them. Subjects also ®lled in a 10-item questionnaire measuring their individual food neophobia. Food neophobia
scores decreased with increasing education and with the degree of urbanization. Men were more neophobic than women, and the
elderly (66±80 years) were more neophobic than the other age groups. Subjects with high food neophobia were less likely to have
tasted or eaten the rated foods than were those with low food neophobia. Food neophobia signi®cantly predicted the willingness to
try ``unfamiliar'', and also some ``familiar'' foods. In factor analysis, the items of the food neophobia scale loaded on two factors
but the variance was mainly explained by the ®rst factor related to the interest in new foods. The second factor may re¯ect a general
concern about trying unknown foods. Overall, the translated food neophobia scale appeared to be a valid instrument for the
characterization of consumer responses to unfamiliar foods. # 2001 Elsevier Science Ltd. All rights reserved.
Keywords: Food neophobia; Familiarity; Willingness to try foods
1. Introduction
Food neophobia, the tendency to avoid new foods,
has been regarded as a biologically meaningful
mechanism that protects individuals from consuming
potentially toxic foods (see Rozin & Vollmecke, 1986).
Pliner and Hobden (1992) developed and validated a 10-
item verbal instrument food neophobia scale (FNS) to
quantify this individual trait. The items are statements
rated by each individual on a 7-point scale from ``dis-
agree'' to ``agree''. Canadian subjects, mainly students,
served as the study population during the development
and validation. The FNS has been applied in several
North American and other studies related to consumer
responses to unfamiliar foods in its original English
form (e.g. Frank & Hursti, 1999; Frank, Reilley,
Schroth, Werk & Wehner, 1997; Meiselman, Mas-
troianni, Buller & Edwards, 1999; Raudenbush &
Frank, 1999; Raudenbush, Schroth, Reilley & Frank,
1998; Tuorila, Meiselman, Bell, Cardello & Johnson,
1994; Tuorila, Meiselman, Cardello & Lesher, 1998); or
translated in Swedish (Hursti & Sjo
È
den, 1997; Koivisto
& Sjo
È
den, 1996) or in Finnish (Arvola, La
È
hteenma
È
ki &
Tuorila, 1999; Pliner, La
È
hteenma
È
ki & Tuorila, 1998;
Tuorila, Andersson, Martikainen & Salovaara, 1998).
There has been informal concern about the meaning
and interpretation of individual FNS statements in dif-
ferent populations and cultures (e.g. Koivisto & Sjo
È
den,
1996), but the structure of the scale has not been criti-
cally examined in these studies.
Several studies reporting FNS values have involved
actual evaluation or tasting of unfamiliar foods (e.g.,
Arvola et al., 1999; Tuorila et al., 1994; Tuorila,
Andersson et al., 1998; Tuorila, Meiselman et al., 1998).
In those studies, we have been unable to locate subjects
representing the extreme end of the FNS, i.e., the most
neophobic subjects. Likewise, large Swedish surveys
(Koivisto & Sjo
È
den, 1996; Hursti & Sjo
È
den, 1997) suggest
relatively low FNS values among adult Swedes compared
to values presented by Pliner and Hobden (1992).
The ®rst aim of the present study was to describe the
Finnish population in terms of food neophobia, by pay-
ing attention to responses from dierent demographic
subgroups based on gender, age, education and living
0950-3293/01/$ - see front matter # 2001 Elsevier Science Ltd. All rights reserved.
PII: S0950-3293(00)00025-2
Food Quality and Preference 12 (2001) 29±37
www.elsevier.com/locate/foodqual
* Corresponding author. Tel.: +358-9-191-58216; fax: +358-9-
191-58212.
E-mail address: hely.tuorila@helsinki.® (H. Tuorila).
1
Current address: VTT Biotechnology, PO Box 1500, FIN-02044
VTT, Finland.
area. Second, to provide evidence on the factor struc-
ture of the scale, responses to items were examined
using factor analysis. Third, further evidence on the
validity of the scale was provided by having subjects
rate their willingness to try unfamiliar and familiar
foods. Since the food stimuli that were rated for willingness
to try were names of real foods, the eects of food neo-
phobia were analyzed based on whether the subjects had
tasted or eaten a product before (thus, the product
should be familiar to a person) or not (in this case, the
product should be genuinely unfamiliar to a person).
2. Materials and methods
2.1. Data collection
The data were collected by a nationwide marketing
research agency (MDC Food & Farm Facts) from
respondents who regularly participate in surveys in their
homes by submitting their data using a PC and a
modem provided by the agency. The respondents are
representative of the Finnish population. The survey
was conducted during two consecutive weekends in the
spring of 1996. During the ®rst weekend, subjects
responded to questions on food stimuli, and during the
second they ®lled in the food neophobia scale. In addi-
tion to information collected for the present study, sub-
jects answered other questions on their shopping and
consumption habits and food attitudes (approx. 300
questions during the two weekends). Approximately
1250 respondents participated in each of the two runs of
data collection, but only 1083 completed both parts.
The data from these subjects were used in the analyses.
A total of 20 foods were chosen to represent familiar
and unfamiliar foods of both plant and animal origin
(see Table 3 for food names). Along with familiar and
unfamiliar ethnic foods, other types of unfamiliar foods
were included: Benecol
R
margarine that had recently
been launched in Finland as a cholesterol lowering
``functional'' food; Lo
R
reduced calorie chocolate bar
(also manufactured in Finland); and FlavSav
R
tomato
which was claimed to be genetically modi®ed. These
three foods were included to examine how speci®cally
the food neophobia scale re¯ects consumer responses to
ethnic vs. other types of unfamiliar foods. The English
translations of the food names, given in Table 3, corre-
spond to the original Finnish expressions as closely as
possible.
The respondents rated the food stimuli on two 5-point
scales. The familiarity scale consisted of ®ve categories
labeled ``I do not recognize the product''=1; ``I recog-
nize the product, but I have not tasted it''=2; ``I have
tasted''=3; ``I occasionally eat the product''=4; and ``I
regularly eat the product''=5. The willingness to try or
use each product was rated on a 5-point scale with only
the ends verbally anchored, 1=``not at all'' and
5=``extremely''.
Ten statements belonging to the food neophobia scale
(Pliner & Hobden, 1992, see Table 1) were rated on a 7-
point scale from ``strongly disagree'' to ``strongly agree''
(all categories verbally anchored). The gender, year of
birth, education (1=lowest level/minimal, 2=middle
level, 3=high school completed), and living area
(grouped as 1=city or large town, 2=countryside town,
3=countryside) of the respondents had been recorded
in an earlier survey.
2.2. Data analyses
The individual FNS values were computed as the sum
of ratings given to ten statements, after the ®ve negative
items had been reversed; the FNS scores thus ranged from
10 to 70. The items were factor analyzed (maximum like-
lihood method, varimax rotation). Four-way analysis of
variance was used to determine the main eects of gender,
age, education, living area, and their two-way interactions
on FNS value. Based on their year of birth, the respon-
dents were divided into six age groups: 16±25; 26±35;
36±45; 46±55; 56±65 and 66±80 years.
Based on FNS scores, subjects were divided into sub-
groups representing low (10±22.4), medium (22.5±45.3),
and high (45.4±70) food neophobia (food neophobia
grouping, FNG). The cut points were at one standard
deviation (11.4) from the mean 33.9, and the respective
number of subjects in each subgroup was 188 (17.4%),
740 (68.3%), and 155 (14.3%).
The familiarity of food stimuli at dierent levels of
food neophobia was preliminarily analyzed by dichot-
omizing the familiarity ratings into categories ``not
recognized/tasted'' (ratings 1 and 2) vs. ``has tried/used
the product'' (ratings 3±5). Subsequently, X
2
analysis
(2Â3) was used to compare familiarity (tasted vs. not
tasted) in the three FNG groups.
Pearson's correlation coecients were computed for
an overall view of the relationships between FNS and
willingness to try or eat food stimuli. Two-way analysis
of variance was used to determine the main eects of
familiarity (the dichotomized form, see above) and
FNG, and their interaction, on the rated willingness to
try food stimuli. The ANOVA, rather than correlation
or regression approach, was used in the analyses
because (1) we were especially interested in the will-
ingness to try/eat among subjects in each extreme ends
of the FNS scale behavior, and (2) the verbally
anchored familiarity scale did not ful®ll the criteria of a
continuous scale, but on the other hand, provided a
clear cut-o point (at tasted vs. not tasted) that in ear-
lier studies has proven to be important for the percep-
tion of unfamiliar foods (Arvola et al., 1999).
Furthermore, analyses of covariance were conducted, in
which the demographic variables were added into the
30 H. Tuorila et al. / Food Quality and Preference 12 (2001) 29±37
ANOVA model as covariates, one at a time, to examine
whether the demographics contributed to the will-
ingness ratings to the extent that they could make the
food neophobia scores redundant.
3. Results
3.1. Food neophobia scale
The scale items loaded mainly on two factors (Table
1). The ®rst is related to the interest (or disinterest) in
trying new and ethnic foods. The second appears to
relate to a general concern vs. carelessness with respect to
trying unknown foods. However, most of the variance
was explained by the ®rst factor, and Cronbach's alpha
of the scale was 0.847. A subsequent analysis showed
that the omission of the items 3, 8 and 9, which pri-
marily loaded on the second factor, would have resulted
in alpha 0.853, and this derived 7-item scale would have
correlated with the original 10-item scale 0.942 (Pear-
son's r). Thus, no essential improvement would have
been obtained by the omission of individual items loading
on the second factor.
The mean FNS score of the entire group of respondents
was 33.9 (S.D.=11.4) (Table 2). Women were less neo-
phobic than men (main eect of gender, F [1, 1024]=
9.9, P=0.002). The higher the education of a subject,
the less neophobic s/he was (main eect of education, F
[2,1024]=8.7, P<0.001). The food neophobia increased
with age, particularly with the highest age group (main
eect of age group, F [5, 1024]=3.8, P=0.002). The
food neophobia decreased with the increasing degree of
urbanization (main eect of living area, F [2,1024]=7.0,
P=0.001). No signi®cant interactions among these factors
were observed.
3.2. Familiarity of food stimuli
Most subjects had tried or eaten most foods desig-
nated to be familiar, and most subjects had not tried nor
did not recognize foods that were designated to be
unfamiliar (Table 3). However, pasha, turkey and meat
balls appeared to be intermediate in terms of familiarity,
as roughly two-thirds of the subjects recognized and had
at least tried them, while one-third had not. Pasha is a
high-fat, high-sugar dairy product of eastern Finnish
origin and is an essential part of the Greek Catholic
Easter celebration. Turkey meat has been available in
Finland mainly during the past decade. Meat balls are
very familiar to the Finns, and the unexpectedly low
recognition rate derives from our description that referred
to a special type of meat balls.
A clear relationship was observed between FNG and
the percentage of subjects who had tasted the food sti-
muli (Table 3). Seven foods in the group of familiar
foods and six foods in the group of unfamiliar foods
had been tried signi®cantly more often by those with
low food neophobia than by those high in food neo-
phobia.
Table 1
Food neophobia scale, mean values of items and varimax rotated factor matrix. Items negative to food neophobia, marked with R, were recoded
prior to analyses. Loadings that are higher on either factor have been marked bold
Item Mean SD Factor 1 Factor 2
1R I am constantly sampling new and dierent foods. 4.0 1.7 0.532 0.080
2 I don't trust new foods. 2.8 1.5 0.550 0.384
3 If I don't know what is in a food, I won't try it. 3.9 1.9 0.203 0.571
4R I like foods from dierent countries. 3.0 1.7 0.755 0.201
5 Ethnic foods look too weird to eat. 3.1 1.7 0.621 0.426
6R At dinner parties I will try a new food. 2.9 1.6 0.575 0.145
7 I am afraid to eat things I have never had before. 3.1 1.7 0.545 0.548
8 I am very particular about the foods I will eat. 3.9 1.8 0.024 0.695
9R I will eat almost anything. 3.7 1.9 0.250 0.495
10R I like to try new ethnic restaurants. 3.4 1.9 0.734 0.190
% Variance explained 38.4 7.7
Table 2
Food neophobia scores by gender, age, education, and living area
Variable Categories Mean SD Range N
Gender Men 35.4 11.9 10±70 507
Women 32.5 10.7 10-67 576
Age (years) 16±25 32.3 10.5 11±64 141
26±35 32.3 11.1 10±67 256
36±45 33.5 11.4 10±70 251
46±55 34.2 11.7 10±68 214
56±65 34.9 11.2 15±69 137
66±80 40.2 10.6 18±70 84
Education
a
Low 38.4 10.8 14±70 305
Medium 33.6 11.3 11±70 429
High 30.4 10.5 10±67 344
Living area
b
City or large town 32.9 11.3 10±70 707
Countryside town 34.7 11.0 10±68 256
Countryside 37.9 11.9 11±70 110
a
Missing cases, n=5.
b
Missing cases, n=10.
H. Tuorila et al. / Food Quality and Preference 12 (2001) 29±37 31
3.3. Willingness to try food stimuli
The correlations between FNS and willingness to try
or eat a food ranged from 0 to À0.35 (Table 3). They
were highly signi®cant for all ``unfamiliar'' foods and
lower, yet in most cases signi®cant, for the ``familiar''
foods.
An earlier contact with a food (had tasted a food vs.
not) had a signi®cant main eect on the willingness to
try all twenty foods (Figs. 1 and 2, Table 4). This held
true regardless of the ``general'', cultural perception of
the familiarity, thus subjects maintained their reluctance
to taste if they had not done it earlier, even when a food
was culturally very familiar.
Food neophobia group (FNG) had a signi®cant main
eect on the willingness to try nine foods: pineapple,
strawberry yogurt, bread cheese, beef tomato, pasha,
turkey, snails, falafel balls, and genetically modi®ed
tomato (Figs. 1e,g,h,i and 2a,b,f,i,j). The ®rst four are
foods that originally had been categorized as familiar,
and the latter ®ve had been categorized as unfamiliar.
For four foods Ð pineapple, strawberry yogurt, beef
tomato, and snails Ð the eect was further quali®ed by
interaction between familiarity and FNG. For Lo
R
chocolate bar and for tofu, the familiarity by FNG
interaction was the only signi®cant eect. The trends
shown in Figs. 1 and 2 suggest that an earlier experience
of pineapple, strawberry yogurt, beef tomato, Lo
R
cho-
colate bar and tofu increased the willingness to try
among the most neophobic subjects, compared to those
neophobics who had not tried these foods. A dierent
interaction was observed in the case of snails, where the
food neophobia status was a stronger predictor of
unwillingness to try among those who had earlier experi-
ence of snails, compared to those who had not tried snails.
Thus, highly neophobic subjects were encouraged to try
most foods based on their earlier experience, but in the
case of snails, they were discouraged by their experience.
Only eleven respondents reported that they had tasted
the genetically modi®ed FlavSav
R
tomato and among
these, none was in the highest FNG group. Therefore,
only one-way analysis was conducted, resulting in a
highly signi®cant negative relationship between the
willingness to try and the increasing FNG (Fig. 2j).
Table 3
Food stimuli in the order of familiarity and characterized by origin. For each food neophobia group, the percentage of those who have tried a food
is given. Correlations between FNS and willingness to try are also reported.
Food name
a
N (tasted) Origin % Subjects who have tried by food neophobia group FNS Â willingness
Low Medium High P
b
r
Familiar foods
Smoked ham 1048 Animal 97 97 96 n.s.
g
À0.07*
Tuna ®sh 1037 Animal 99 97 88 *** À0.19***
Tupla chocolate bar 1022 Plant 96 95 92 n.s. À0.08**
Ma
È
mmi
c
1020 Plant 93 95 94 n.s. À0.03 n.s.
Pineapple fruit 1015 Plant 97 94 89 ** À0.21***
Flora margarine 990 Plant 94 92 88 * À0.01 n.s.
Strawberry yogurt 984 Animal 97 91 85 *** À0.07*
Bread cheese
d
958 Animal 93 90 76 *** À0.19***
Beef tomato 955 Plant 97 88 77 *** À0.23***
Meat balls (``eines'') 780 Animal 77 73 64 * 0.00 n.s.
Unfamiliar foods
Pasha
e
764 Animal 82 73 45 *** À0.29***
Turkey cut 669 Animal 74 62 45 *** À0.25***
Lo chocolate bar
f
457 Plant 51 43 30 ** À0.11***
Tofu (soy protein product) 157 Plant 27 13 5 *** À0.26***
Benecol margarine
f
155 Plant 12 16 11 n.s. À0.10***
Snails 147 Animal 31 12 2 *** À0.35***
Yosa (oat bran product) 56 Plant 6 5 3 n.s. À0.20***
Longan fruit 31 Plant 4 3 3 n.s. À0.29***
Falafel balls 30 Plant 7 2 1 *** À0.26***
FlavSav tomato (genetically modi®ed) 11 Plant 1 1 0 n.s. À0.20***
a
Food names are translated so as to correspond to the original Finnish expression in the questionnaire as closely as possible (familiarity cate-
gories and footnote explanations were not available to subjects).
b
P values refer to the X
2
(df=2) tests in which the earlier tasting vs. not tasting were compared in the three FNG groups.
c
Finnish Easter pudding.
d
Finnish specialty cheese.
e
Eastern Finnish Easter pudding.
f
Nutritionally modifed brand product.
g
n.s.=Not signi®cant, *P<0.05, **P<0.01, ***P<0.001.
32 H. Tuorila et al. / Food Quality and Preference 12 (2001) 29±37
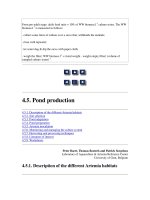
Fig. 1. Mean ratings of willingness to try foods originally categorized as familiar, in three groups of food neophobia (1=low, 2=medium, 3=high)
by groups of subjects who had tried or eaten a product before vs. those who did not recognize or had not tried the product The values given in
parentheses are the numbers of subjects in two subgroups.
H. Tuorila et al. / Food Quality and Preference 12 (2001) 29±37 33