Consumer acceptance of cheese,influence of different testing conditions
Bạn đang xem bản rút gọn của tài liệu. Xem và tải ngay bản đầy đủ của tài liệu tại đây (311.42 KB, 8 trang )
Consumer acceptance of cheese, influence of different
testing conditions
Margrethe Hersleth
a,b,
*
, Øydis Ueland
a
,H
el
ene Allain
a
, Tormod Næs
a,c
a
Matforsk, Norwegian Food Research Institute, Osloveien 1, N-1430
As, Norway
b
Agricultural University of Norway, Department of Chemistry, Biotechnology and Food Science, Box 5003, N-1432
As, Norway
c
University of Oslo, Box 1072, Blindern, No-0316 Oslo, Norway
Received 29 September 2003; received in revised form 24 February 2004
Available online 8 April 2004
Abstract
The main objective of this study was to evaluate the effect of various test situations on hedonic responses to food. The experimental
sample set consisted of six different cheeses selected on the basis of a sensory descriptive test of a total of 15 cheeses performed by a
trained panel. A panel of 87 consumers evaluated the cheese samples for overall liking in three different testing conditions, at a
laboratory, at a central location and at home. The consumer panel was divided into three groups, each with different order of the
testing conditions. The main results showed that changing the environments and the degree of social interaction in the consumer tests
had no significant effect on hedonic ratings for the products. Lack of a natural meal context during testing, similar expectations in the
three testing situations and high familiarity of the product category may explain the high degree of consistency in hedonic ratings.
Ó 2004 Elsevier Ltd. All rights reserved.
Keywords: Context; Liking; Consumer; Cheese; Familiarity; Expectation
1. Introduction
There is an increasing demand for new products and
line extensions in the food market. Hedonic scales and
preference tests are common instruments used when
decisions on market introductions are made. The prac-
tical benefits of such tests are, however, strongly
dependent on the validity of the test, as well as the
sensitivity and the reliability (K
€
oster, Couronne, L
eon,
L
evy, & Marcelino, 2002; Lawless & Heymann, 1999;
Meiselman, 1993). According to Schutz (1999) internal
validity of a test means that the data collected apply to
the people, products and situations in that particular
test. External validity, on the other hand, means that the
data can be used to make more general conclusions
about other people, products and situations. The
validity of hedonic tests is therefore closely associated
with the uniformity and the consistency of the consumer
sample (K
€
oster, 2003; K
€
oster et al., 2002), but is also
closely connected to the area of context research (Bell &
Meiselman, 1995; Meiselman, 1996; Rozin & Tuorila,
1993). In the present paper we will focus on a particular
aspect of validity of hedonic ratings; namely how con-
sistent consumers are when rating food products on a
hedonic scale in different testing conditions.
Most hedonic food testing is conducted in laborato-
ries, at central locations or at home. A laboratory rep-
resents the most controlled environment for testing. In
the testing area, one can usually control most environ-
mental variables, stimulus variables and to a certain
degree social interaction. The arguments in favour of
using a laboratory test are to allow for focusing on the
sensory characteristics of the products without being
influenced by external variables related to the eating
environment or social settings. However, a sensory
testing booth is very different from a real eating envi-
ronment and the realism of the test can be questioned.
Simple laboratory food preference measures have in
some projects shown to be poor predictors of con-
sumption (Cardello, Schutz, Snow, & Lesher, 2000;
Kozlowska et al., 2003). Meiselman (1992) has pointed
out these aspects in his call for ‘‘real foods to be tested
by real people in a real dining situation’’.
*
Corresponding author. Address: Matforsk, Norwegian Food
Research Institute, Osloveien 1, N-1430
As, Norway. Tel.: +47-6497-
0100; fax: +47-6497-0333.
E-mail address: (M. Hersleth).
0950-3293/$ - see front matter Ó 2004 Elsevier Ltd. All rights reserved.
doi:10.1016/j.foodqual.2004.02.009
Food Quality and Preference 16 (2005) 103–110
www.elsevier.com/locate/foodqual
An alternative to a laboratory test is a central loca-
tion test (Lawless & Heymann, 1999) organised in a
mall, at a school, in a canteen or as in this project at a
club house belonging to a soccer team (see description of
the facilities in Section 2.4). In a central location area
one can partly control environmental variables, stimulus
variables and the degree of social interaction. It is pos-
sible to increase the realism of the test by making the test
area more natural and home-like. The effect of social
interaction, physical environment and freedom with re-
spect to food choice was studied by King, Weber,
Meiselman, and Lv (in press). They found that intro-
duction of context effects in a central location test can
improve the ability to predict actual liking scores in a
real life environment.
Food testing by consumers in their home is consid-
ered to be more optimal compared to laboratory testing
and central location testing with regard to realism dur-
ing tasting and eating a product sample. In such tests the
products can be tested under its normal conditions of
use (Meilgaard, Civille, & Carr, 1991). However, a home
test does introduce many practical challenges. The po-
tential for product misuse is very high (Stone & Sidel,
1992). Other challenges are variability in preparation,
variability from the time of use and variability from
other foods or products used with the test product
(Meilgaard et al., 1991). Home tests are time consuming
to organise and it can be difficult to assess the testing
procedure and the validity of the resulting data.
The main objective of the present study was to
compare and evaluate the effects of various commonly
used test situations on hedonic responses to a particular
food. The same set of products was presented to a group
of consumers in three different locations; in a labora-
tory, at a central location and at home. A selection of
semi-hard and hard cheeses from the Norwegian market
was chosen as products. The cheeses are well-known
varieties in the market and typically used for breakfast,
lunch and supper.
2. Materials and methods
The study consisted of two parts, a conventional
sensory profiling of fifteen cheese samples and a con-
sumer test with six cheese samples served in three ses-
sions.
2.1. Products
This study was a part of a larger preference mapping
project on hard and semi-hard Norwegian cheeses. For
sensory profiling 15 different cheeses commercially
available at the Norwegian market were selected. The
consumer test was performed on six of the cheeses se-
lected from the total number as described below. All the
presented cheese samples in the descriptive test and in
the consumer test came from the same batches. The
samples were therefore treated as homogeneous in the
statistical analysis.
2.2. Descriptive sensory analysis
All cheeses were evaluated by a panel using descrip-
tive sensory profiling as described in ISO 6564:1985. The
sensory panel consisted of 11 panellists selected and
trained according to guidelines in ISO 8586-1:1993 and
the laboratory was designed according to guidelines in
ISO 8589:1988. The surface area of the cheese samples
was removed and 50 g was served to each panellist. The
serving temperature of the cheese samples was 13 °C.
The panellists developed a test vocabulary describing
differences between samples and they agreed upon a
consensus list of 22 attributes for profiling. A continu-
ous, non-structured scale was used for evaluation. The
left side of the scale corresponded to the lowest intensity
of each attribute (value 1.0) and the right side corres-
ponded to the highest intensity (value 9.0). In a pre-test
session, the panellists were trained in the use of the scale
by testing samples that were considered as extreme on
selected attributes typical for the product. Each panellist
did a monadic evaluation of the samples at individual
speed on a computerised system for direct recording of
data (CSA Compusense, version 5.24, Canada). Two
replicates were performed for each cheese variety. All
samples and replicates were served in a randomised
order. The average response over replicates and asses-
sors for each significant attribute were used in the
multivariate analyses.
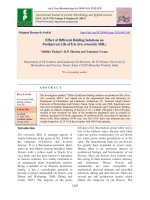
Based on the results from Principal Component
Analysis (PCA), six of the cheese samples (marked in
Fig. 1) were selected and used for consumer testing. The
selection of samples had to meet the following two cri-
teria. (1) For the purpose of the preference mapping
project some important market strategic elements had to
be met. (2) For the purpose of the present paper the six
cheese samples should be sufficiently different to create
differences in hedonic liking. The marked samples in
Fig. 1 represent a compromise between these two crite-
ria.
2.3. Experimental design for consumer study
The experimental design for the consumer study is
shown in Table 1. A panel consisting of 87 consumers
evaluated six cheeses in three different testing condi-
tions: In individual sensory booths at a laboratory, at a
club house belonging to a soccer team and at home. The
quoted number of consumers participated in all three
sessions. The consumer panel was divided into three
groups (A–C), each with a different order of tasting
conditions (shown in Table 1).
104 M. Hersleth et al. / Food Quality and Preference 16 (2005) 103–110
2.4. Consumer testing
The consumers were recruited from a local soccer
club and were selected according to the following cri-
teria: Likers of hard/semi-hard cheese, 30–50 years old,
not employee at Matforsk (Norwegian Food Research
Institute) or the nearby Food Science Department at the
Agricultural University of Norway. The consumers were
given the following information about the test during
recruiting: ‘‘We seek participants for a consumer test of
hard/semi-hard cheese. The test implies evaluation of 18
cheese samples and the test is therefore composed of
three sessions. Due to practical circumstances and
capacity we will arrange the test at three different loca-
tions’’.
The three sessions were carried out within eight days
(Monday, Thursday and the following Monday). The
consumers arrived at the laboratory and at the central
location between 6–8 p.m. The test was a blind test i.e.
the detailed identity (brand) of the products was un-
known to the participants. However, the Norwegian
market for cheeses is still dominated by one large cheese
producer (Tine BA). Thus, when eating cheeses, most
Norwegians associate this product category with the
‘‘Tine’’ brand. The consumers were presented with six
coded samples of 200 g semi-hard or hard cheese in each
session. The cheeses were evaluated for overall liking on
a nine-point hedonic scale anchored with ‘‘Like Ex-
tremely’’ and ‘‘Dislike Extremely’’ and with a neutral
centre point of ‘‘Neither Like nor Dislike’’ (Peryam &
Pilgrim, 1957). The consumers could choose between the
use of a cheese slicer or a knife and they were requested
to remove the surface area of the sample before tasting.
No more information concerning the products or the
experiment was given. Serving order in the laboratory
session and in the central location session was varied
according to a cyclic design balanced for order and
carry-over effects (MacFie, Bratchell, Greenhoff, &
Vallis, 1989). Water was served as the beverage in the
laboratory and at the central location test.
The similarities and differences between the experi-
mental conditions are shown in Table 2. Laboratory
evaluations took place in individual booths and social
interaction was discouraged. The serving temperature of
the cheese samples was 12–14 °C. The central loca-
tion test took place at a club house belonging to the
local soccer club from which the consumers were re-
cruited. This environment may therefore have given the
-1.0
-0.5
0
0.5
1.0
-0.5 0 0.5 1.0
1
2
3
4
5
6
7
8
9
10
11
12
13
14
15
Whiteness
Colorhue
Saturation
Porosity
Brightness
Elasticity
Int.odour
Acid odour
F.acid odour
Int.flavour
Salty flavour
Bitter flavour
F.acid flavour
Acid flavour
Nutty flavour
Sharp flavour
Hardness
Solubility
Fattyness
Juiciness
Stickiness
Graininess
PC1
PC2
Fig. 1. PCA bi-plot of significant sensory attributes (p < 0:05) and sensory data for the 15 cheese samples. PC1 account for 55% and PC2 for 26%.
Cheese chosen for consumer study are marked.
Table 1
Experimental design for consumer study
Group Number of consumers Session (Monday week 1) Session (Thursday week 1) Session (Monday week 2)
A 30 Laboratory Home Central location
B 27 Home Central Location Laboratory
C 30 Central location Laboratory Home
M. Hersleth et al. / Food Quality and Preference 16 (2005) 103–110 105
consumers a more familiar sensation than the laboratory
did. The club house is normally used for various social
arrangements in the soccer club such as meetings, serv-
ing food, celebrations etc. The testing took place in a
meeting room furnished with dining tables with chairs
and sofas with armchairs. A kitchen is connected to the
meeting room with a service hatch. The consumers ar-
rived between 6 and 8 p.m. and were seated around the
same dining table, up to a maximum of eight persons at
the same time. They were allowed to talk with each
other, but not to discuss the samples. The home test was
arranged as a one time trial, i.e. the consumers did not
use the product over a period of time. At home the
consumers were allowed to taste the cheeses together
with family and/or friends, but they were instructed to
report their personal liking only. The consumers were
allowed to taste the cheese sample with bread, crisp-
bread or biscuits and self-elected beverages.
In addition to a standard score sheet used in all three
sessions the consumers were asked to provide the fol-
lowing information from the home test: (1) Were you
alone or together with family/friends when you tasted
the cheese? (2) Did you consume bread, crisp-bread or
biscuits with the cheese? (3) Did you consume water or
other beverages with the cheese? If the consumers had
any cheese left after tasting they were requested not to
consume the left over until the last tasting session was
finished.
2.5. Statistical analysis
2.5.1. Analysis of sensory data
Analyses of Variance (ANOVA, two-way model with
interactions and with assessor effects and interactions
considered random) was performed on the descriptive
sensory analysis data in order to identify the sensory
attributes that differentiated between samples.
To study the main sources of variation between the
average sensory descriptive data, a PCA of the panel
averages (significant attributes, p < 0:05) was performed
(mean centred data, no standardisation) (Mardia, Kent,
& Bibby, 1980). A PCA of the consumer scores of the
cheese samples in each contextual situation was also
performed in order to study the main tendencies in
variation between products and situations. Full cross-
validation (Martens & Næs, 1989) was used for valida-
tion of the components.
2.5.2. Analysis of consumer data
The statistical analysis of the consumer data was
performed using Minitab version 13.3. We used the
ANOVA model with main effects for consumer, product
and context plus all the two-factor interactions. The
main effects of the consumers and their interactions with
other effects are considered random, the remaining ef-
fects are fixed.
A separate ANOVA was conducted for the first ses-
sion only for each of the three groups (without any
possible bias from previous sessions), group A in labo-
ratory, group B in home and group C in central loca-
tion. The model used was one with main effects for
consumer and product (interaction was confounded
with error). This model was also used to determine
significantly different samples with respect to hedonic
liking in each of the three testing situations. Three sep-
arate ANOVA analyses were performed, one data set
(87 consumers) for each of the testing locations. Tukey’s
method for pairwise comparisons was used.
3. Results
A PCA-plot (bi-plot) obtained from the significant
sensory attributes for the 15 cheese samples is presented
in Fig. 1. Principal component 1 (PC1) and principal
component 2 (PC2) respectively accounted for 55% and
26% of the total variance. The cross-validation (results
not shown) confirmed that interpretation of the first two
components is valid. On the basis of the results from the
descriptive test and the two mentioned criteria (Section
2.2) we selected the following cheeses for the consumer
tests: 1, 4, 8, 9, 11, 14. We considered the chosen cheese
samples to be sufficiently different in consistency and
flavour attributes to be perceived as different by the
consumers.
The results from the ANOVA with all the three
testing situations and all consumers included are shown
in Table 3. As can be seen, there is a significant main
effect for consumers (p ¼ 0:01) and a significant inter-
action effect between consumer and product (p ¼ 0:01).
Table 2
Similarities and differences among the three experimental conditions in the consumer study
Laboratory Central location Home
Controlled serving order
a
Yes Yes No
Instructions about cutting Yes Yes Yes
Temperature of cheese samples 12–14 °C? ?
Social interaction No Yes (limited) Yes
Bread, crisp bread, biscuits Nothing Nothing Freedom of choice
Beverages Water Water Freedom of choice
a
Balanced for order and carry-over effects.
106 M. Hersleth et al. / Food Quality and Preference 16 (2005) 103–110
The effect of product is also significant (p ¼ 0:01), which
means that type of cheese significantly influenced the
rating of liking. Neither the effect of context nor its
interaction with consumer are significant at the 5% level.
The interaction between product and context is signifi-
cant (p ¼ 0:01). The interaction plot is given in Fig. 2.
As can be seen, the interaction effect is mainly due to
cheese number 4 and cheese number 9. Both samples
show a larger variation in average rating between test
situations than the other samples. For cheese number 4,
the laboratory environment gave the highest rating and
for cheese number 9, the in-home situation gave the
highest rating.
The same type of ANOVA was also run for each of
the three consumer groups (group A, B and C, results
not shown) separately. Likewise, three separate ANO-
VAs were run for each of the first testing situations. The
results gave the same overall conclusion as for the full
analysis, indicating no effect of the order of the testing
situation.
Table 4 shows data from the in-home testing. The
majority of the consumers (80%) tasted the cheese
samples without any kind of bread, while 20% had
bread, crisp bread or biscuits together with the cheese.
More than half of the consumers were drinking water
while testing the cheese samples and 16% used other
beverages. About 50% of the consumers did the testing
alone.
Fig. 3 shows the average scores and the ranking of the
cheese samples. Samples which are not significantly
different at 5% level (Tukey’s method) are marked with
lines. As can be seen, the ranking of the cheese samples
was similar in the three testing situations. Samples 11
and 8 were the most preferred samples in all three sit-
uations and sample 9 the least preferred. However, the
clustering of samples in the three situations is different.
For the central location test the overlap is the strongest,
while for the in-home test the overlap is the weakest. For
the laboratory testing, the mid group overlaps with both
the high and low groups of samples.
Detailed information about average ratings of cheese
samples and the standard deviations together with the
total averages of the standard deviation per cheese
sample and per testing situation are shown in Table 5.
The table shows fairly equal average standard deviations
in liking for the three testing situations and more vari-
ation in average standard deviations for cheese samples.
Samples 1 and 11 have the smallest standard deviations
while sample 9 has the largest.
Table 3
Results from ANOVA of the experimental design shown in Table 1
Variable Degrees of
freedom
F -value P-value
a
Consumer 86 1.88 0.01
Product 5 8.93 0.01
Context 2 0.40 0.67
Consumer · Product 430 3.98 0.01
Consumer · Context 10 0.92 0.52
Product · Context 172 1.47 0.01
a
P-value of 0.01 means equal to or less than 0.01.
Fig. 2. Illustration of interaction effects between product and testing
location. Average rating for each product in each testing location.
H ¼ in home testing, CL ¼ central location, L ¼ laboratory.
Table 4
Reported testing conditions from in-home testing
Bread, crisp-bread or biscuits N ¼ 80 Without 80%
With 20%
Beverages N ¼ 79 Without 28%
Water 56%
Other 16%
Social interaction N ¼ 74 Alone 49%
Social
group
51%
Reported percent is calculated as a percent of N ¼ consumers who
answered this particular question.
Fig. 3. Average hedonic ratings and ranking of the cheese samples in
the three testing situations. Different letters means different ratings at
the 5% level of significance, calculated on the three different data sets
separately.
M. Hersleth et al. / Food Quality and Preference 16 (2005) 103–110 107