Sensory characterization of dry-cured ham using free-choice profiling
Bạn đang xem bản rút gọn của tài liệu. Xem và tải ngay bản đầy đủ của tài liệu tại đây (504.22 KB, 8 trang )
Sensory characterization of dry-cured ham using free-choice profiling
M. Dolors Guàrdia, Ana P.S. Aguiar, Anna Claret, Jacint Arnau, Luis Guerrero
*
IRTA-Centro de Tecnologia de los Alimentos, Finca Camps i Armet, E-17121 Monells, Spain
article info
Article history:
Received 19 February 2009
Received in revised form 19 August 2009
Accepted 19 August 2009
Available online 23 August 2009
Keywords:
Free-choice profiling
Consumer perception
Dry-cured ham
Sensory properties
abstract
In this study, free-choice profiling was carried out to study how consumers perceived and described the
sensory properties of dry-cured ham. One hundred and nine consumers from three different Spanish
regions evaluated the sensory characteristics of four different commercial dry-cured hams aged with age-
ing times of 6, 9, 12 and 16 months. Data were analysed by means of Generalized Procrustes Analysis. In
order to understand the sensory consumers’ vocabulary better a Quantitative Descriptive Analysis with
seven trained assessors was also performed. In general, results showed that consumers used simple terms
to describe the sensory characteristics of the samples, paying special attention to the appearance, espe-
cially, the colour and fat content of the dry-curedham. There was some disagreement in the case of salty
taste and texture descriptors, but, apart from that a consensus in the use of sensory attributes was
observed. Data from trained assessors proved to be a useful method for understanding and validating
consumers’ vocabulary.
Ó 2009 Elsevier Ltd. All rights reserved.
1. Introduction
The sensory quality of dry-cured ham results from the interac-
tions between the characteristics of the fresh matter and the bio-
chemical changes occurring during the processing (Arnau,
Guerrero, & Sárraga, 1998; Buscailhon, Gandermer, & Monin,
1994; Parolari, Virgili, & Schivazappa, 1994; Vestegaard, Schivaz-
appa, & Virgili, 2000). The extent of these changes depends on
the initial composition of the raw material and the technological
process (Buscailhon, Berdagué, & Monin, 1993) and the ageing
duration (Guàrdia, Guerrero, Gou, Monfort, & Arnau, 1999). In
addition to these factors affecting sensory properties, there are fur-
ther aspects such as habits of consumption (Mili, Mahlau, & Furi-
tsch, 1996) and socio-cultural characteristics related to the
geographical region (Cilla et al., 2006) that also affect consumers’
quality perception of dry-cured ham.
Sensory descriptive tests are among the most sophisticated
tools used by sensory scientists (Lawless & Heymann, 1998) and
involve the discrimination and description of both the qualitative
and quantitative sensory components (Meilgaard, Civille, & Carr,
1991). Several different methods exist within descriptive analysis
that reflect different sensory approaches (Lawless & Heymann,
1998). Quantitative Descriptive Analysis (QDA) is a technique fre-
quently used in sensory characterization of food. In this respect,
several authors (Cilla, Martínez, Beltrán, & Roncalés, 2006;
García-González et al., 2006; Guerrero, Gou, Alonso, & Arnau,
1996; Rousset & Martin, 2001) have used trained panels to
describe the sensory properties of different types of dry-cured
ham. However, QDA is very time-consuming due to the extensive
training that assessors must undergo. Furthermore, Piggott, Sheen,
and Apostolidou (1990) pointed out that trained and experienced
assessors normally tend to generate complex and scientifically ori-
ented terms in sensory research which may be difficult for non-
specialized people to understand.
Free-choice profiling (FCP) is a sensory methodology that differs
from other descriptive methods because it is not necessary to use a
common vocabulary of attributes to describe the samples, nor are
the panellists expected to agree on their interpretation of the terms
used. By means of FCP, each participant produces their own
descriptive profiles of the products, without having to explain
the exact meaning (Williams & Langron, 1984). This is based on
the assumption that panellists do not differ in their perceptions,
but merely in the way in which they describe them. FCP is similar
to traditional profiling in that assessors must be able to detect dif-
ferences between the samples, verbally describe the perceived
attributes and quantify them (Oreskovich, Klein, & Sutherland,
1991). The FCP strategy can yield important insights into consumer
differentiation of products and establish relationships between
consumer preferences and sensory characteristics (Jack & Piggott,
1992). The analysis of the data collected from FCP is normally car-
ried out by means of Generalized Procrustes Analysis (Gower,
1975; Langrom, 1983). This statistical technique allows for the
rationalization of the spatial configurations derived from individ-
ual profiles. The result is a consensus configuration revealing the
interrelationships between the samples for the panel as a whole
(Williams & Langron, 1984). Regarding the number of attributes
generated, this is limited only by the perceptual and descriptive
0950-3293/$ - see front matter Ó 2009 Elsevier Ltd. All rights reserved.
doi:10.1016/j.foodqual.2009.08.014
* Corresponding author. Tel.: +34 972 630052; fax: +34 972 630373.
E-mail address: (L. Guerrero).
Food Quality and Preference 21 (2010) 148–155
Contents lists available at ScienceDirect
Food Quality and Preference
journal homepage: www.elsevier.com/locate/foodqual
skills of the consumer (Oreskovich et al., 1991) and, according to
Deliza, MacFie, and Hedderley (2005), terms used by untrained
assessors may vary, based on their individual experience and
familiarity with the product. To summarize, FCP offers the possibil-
ity of assisting the demands of marketing and product develop-
ment teams who require information on target consumer’s
perception of products, rather than the more technical descriptions
of the products typically provided by trained sensory panels
(Elmore & Heymann, 1999; Murray, Delahunty, & Baxter, 2001).
The aim of this study was to evaluate how consumers repre-
senting three different Spanish regions perceive and describe sen-
sory characteristics of four different types of commercial dry-cured
ham using FCP. Furthermore and, in order to surmount the incon-
venience related to the interpretation of the consumers’ vocabu-
lary, a QDA with trained assessors was used to facilitate
comprehension of the terms generated by consumers.
2. Materials and methods
2.1. Dry-cured ham sample preparation
Four types of commercial Spanish dry-cured ham from white
pig breeds with aging times 6, 9, 12 and 16 months (samples A,
B, C and D, respectively) were selected to provide a wide range of
sensory variability and to stimulate the generation of attributes
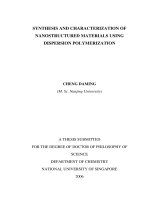
by consumers. Three dry-cured hams of each type were boned,
cut at the head of the femur level and then sliced (1.5 ± 0.2 mm-
thick) perpendicularly to the femur axis in the distal part direction
(Fig. 1) with a vertical slicer Kolossal 350 BVK (Marconi, Italy). So
that the panellists were not distracted by testing cuts from differ-
ent areas of the dry-cured ham (Guerrero, Guàrdia, & Arnau, 2004,
2005), the slices evaluated by each consumer were from the same
anatomical position for each one of the four dry-cured hams
assessed.
Slices were placed inside polypropylene trays, packed in bags
(50
l
m polyamide/100
l
m polyethylene multilayer; oxygen per-
meability: 7 cm
3
/m
2
/24 h at 4 °C and 80% RH; CO
2
permeability:
1150 cm
3
/m
2
/24 h at 23% and 75% RH; water-vapour permeability:
1.5 g/m
2
/24 h; SACOLIVA
Ò
, S.L., Castellar del Vallès, Spain) under
modified atmosphere (99.8 ± 0.1% N
2
and 0.1 ± 0.1% O
2
) with an
oxygen scavenger (Tyvek LH3000, ATCO) and then stored at
2 °C±2°C for a maximum period of 7 days.
2.2. Physicochemical description of samples
Moisture and fat content of six slices per ham were analysed by
near infrared transmittance (NIT) spectroscopy with an INFRATEC
TM
1265 Meat Analyzer (Tecator AB, Sweden). NaCl content was deter-
mined by the Charpentier–Volhard method (ISO, 1970). Physico-
chemical composition of dry-cured hams used in the study is
shown in Table 1.
2.3. Descriptive sensory analysis
2.3.1. Free-choice profiling (FCP)
A group of 109 consumers aged between 21 and 68, recruited in
the Centre (Madrid) (n = 34), South (Sevilla) (n = 37) and North
(Girona) (n = 38) of Spain, participated in the study. The recruit-
ment was randomly made by phone, using a filter questionnaire
specifically elaborated for this study, including demographic and
socio-economic information (gender, age, education level, and
working situation) and frequency of consumption of different food
products including dry-cured ham. Only consumers who declared
eating ham at least once every two weeks, and with no previous
experience in sensory analysis, were selected.
To avoid the effect of storage time on the sensory properties of
dry-cured ham, sensory evaluation of the samples was carried out
in all three cities in the same week. Two FCP sessions with 15–20
consumers each were carried out per city. Participants were re-
ceived in a conference room and placed at individual tables under
white lighting (700 lx ± 150 lx). First of all, consumers were briefed
on the concept of the methodology and the procedure. The aim of
this was to allow for development of the vocabulary to describe the
four types of dry-cured ham. Each consumer was given one slice of
each of the four dry-cured hams. They were instructed to include
only objective attributes and not to use hedonic terms. During this
task, the consumers were first asked to describe the appearance
and the odour of the samples. After, they were requested to taste
the sample and to describe the flavour and texture characteristics
writing their personal perception in their own words. Then, each
consumer once again received one slice of each type and scored
the four types of dry-cured ham using his/her own previously gen-
erated descriptors. In this case, the same hams were presented but
with different codes and in a different order. All samples were as-
sessed in the same tasting session balancing the first-order and
carry-over effects (Macfie, Bratchell, Greenhoff, & Vallis, 1989).
Sensory attributes were evaluated using an unstructured 100 mm
line scale anchored with the words ‘‘absence” and ‘‘intense” at each
end.
In all sessions, slices of dry-cured ham were evaluated at room
temperature (20 °C) and presented on white plastic plates covered
with a food grade PVC film (oxygen permeability; 20,000 cm
3
/m
2
/
b
a
20 mm
25 mm
c
b
a
20 mm
25 mm
c
Fig. 1. Schematic view of the dry-cured ham sampling: (a) sample for physico-
chemical analysis; (b) sample for sensory analysis (QDA) and (c) sample for
consumer study.
Table 1
Least square means and RMSE for moisture, fat content and NaCl and each type of
dry-cured ham (n = 3).
p Samples
*
RMSE
ABCD
Moisture (%) <0.0001 51.34
a
48.17
a
50.71
a
40.65
b
3.035
Fat content (%) 0.0002 6.83
b
12.36
b
7.13
b
19.68
a
4.001
NaCl (%) <0.0001 6.05
a
5.10
b
5.63
a
4.79
b
0.231
a,b
Within a row, least square means with different superscripts differs significantly
(p < 0.05).
RMSE: root mean standard error.
*
A = 6, B = 9, C = 12 and D = 18 months of ageing time, respectively.
M.D. Guàrdia et al. / Food Quality and Preference 21 (2010) 148–155
149
24 h; water-vapour transmission rate 2000 g/m
2
/24 h; Macopal,
S.L., Lliçà de Vall, Spain) to prevent drying. Samples were coded
with three-random numbers and, for each consumer, all the sam-
ple slices came from the same anatomical position. Mineral water
and unsalted crisp-bread were provided to rinse consumers’
mouths between samples.
2.3.2. Quantitative Descriptive Analysis (QDA)
Seven selected and trained assessors (ASTM, 1981; ISO 8586-1,
1993; ISO 8586-2, 1994) undertook the sensory analysis on 1.5 mm
slices from the same dry-cured hams (n = 12, three dry-cured hams
and four ageing times) previously evaluated by the consumers. The
generation of the descriptors had been carried out in open discus-
sion in two previous sessions. The descriptors retained were:
sweetness (basic taste sensation elicited by sugar), saltiness (basic
taste sensation elicited by NaCl), bitterness (basic taste sensation
elicited by caffeine and
L
-tryptophan), metallic (flavour similar to
a solution of FeSO
4
Á7H
2
O), piquantness (stinging sensation in the
mouth and throat), matured flavour (set of complex nuances char-
acteristic of dry-cured meat products, not described by other fla-
vour attributes), aged (flavour related to aged fat which is
characteristic of long aged Spanish dry-cured ham partially
skinned according to the typical V shape; Gou, Arnau, & Guàrdia,
2000), adhesiveness (textural property rated by the degree to
which the surface of the ham slice adheres to the palate when com-
pressed with the tongue), hardness (amount of pressure required
to completely compress the sample), crumbliness (textural prop-
erty characterized by ease with which a sample can be separated
into smaller particles during chewing), pastiness (feeling of paste
detected in hams with a high proteolytic index), fibrousness (tex-
tural property characterized by the perception of the amount of
muscle fibres detected during chewing). The references used to
illustrate the maximum intensity of hardness, crumbliness and
pastiness were those described by Guerrero, Gou, and Arnau
(1999). A non-structured scoring scale (Amerine, Pangborn, &
Roessler, 1965) was used, where 0 meant absence of the descriptor
and 10 meant high intensity of the descriptor. Sensory evaluation
was undertaken in three sessions and a complete block design
was used (Steel & Torrie, 1960–1983), where each taster assessed
the four different types of dry-cured ham in each session. Samples
were coded with three-random numbers and were presented to
the assessors balancing the first-order and the carry-over effects
as much as possible according to Macfie et al. (1989). All hams
were evaluated in slices from the same anatomical area.
2.4. Data analysis
2.4.1. Free-choice profiling data analysis
Data from the FCP was submitted to Generalized Procrustes
Analysis, and a consensus matrix was obtained by using mathe-
matical data operations according to Arnold and Williams (1986).
The average of all transformed configurations that shows the min-
imum overall deviation was obtained as a consensus space. It sum-
marizes the information on the samples and replaces the panel
mean (Langrom, Williams, & Collins, 1984). Similar terms were
grouped together in order to simplify the map obtained. Only
agreed descriptors with correlation coefficients higher than 0.6 in
at least one of the first two dimensions and mentioned by more
than eight consumers were used to visualize the relationships be-
tween samples and attributes.
The frequency of descriptors used by consumers in each city
was analysed using Simple Correspondence Analysis (Greenacre
& Belsius, 1994), including gender, age, education level, working
situation and consumption frequency of each consumer as supple-
mentary variables.
Statistical analyses were carried out using XLSTAT software
(Addinsoft, France).
2.4.2. Quantitative descriptive data analysis
Data from the Quantitative Descriptive Analysis was analysed
by means of the ANOVA test using the GLM procedure of SAS
(2001). The ANOVA test was performed over the mean score (seven
assessors) for each dry-cured ham because each dry-cured ham is
the experimental unit (when performing sensory analysis all the
assessors evaluate the same ham). The model included the type
of dry-cured ham (ageing time) and the taste session as fixed ef-
fects. The interaction assessor  type of dry-cured ham was tested
and dropped from the model since it was not significant (p > 0.05).
Differences between treatments were tested by the Tukey test. Fur-
thermore, a Principal Component Analysis was carried out on the
mean score for each dry-cured ham.
2.4.3. Physicochemical data analysis
Data from physicochemical analysis were submitted to one-
way ANOVA (SAS, 2001) including the type of dry-cured ham (age-
ing time) as a fixed effect. Mean comparisons were carried out
using the Tukey test.
3. Results and discussion
Demographic, socio-economic characteristics and frequency of
dry-cured ham consumption of the consumers involved in the
present study are shown in Table 2. About 44.0% of the consumers
were men and 56.0% women and most of them were aged between
20 and 50 (80.7%). The final age distribution of the consumers who
participated in the present study showed a bias when compared
with the Spanish population (33.41% of which are older than 50;
INE, 2007). This bias may be explained by the additional selection
criteria used of consumption frequency – eat ham at least once
every
two
weeks.
Normally,
people aged over 50–55 tend to reduce
salt and fat consumption in order to prevent cardiovascular risk
factors (Black, 2000) and both are present in dry-cured ham. A
large percentage of consumers had a medium education level
(45.9%) similar to the Spanish average (48.03%, INE, 2001) and,
67.9% of them were employees. In this case, the official data (INE,
2001) in Spain shows that employees represented 55.58% of the
Table 2
Demographic, socio-economic characteristics and frequency of dry-cured ham
consumption of the participants (% of respondents, n = 109).
Socio-demographic characteristic % of respondents
Gender
Male 44.0
Female 56.0
Age
20–35 years 39.4
36–50 years 41.3
>50 years 20.2
Education level
Primary school 20.2
Secondary school 45.9
University 33.9
Working situation
Employed 67.9
Unemployed or retired 28.4
Student 3.7
Consumption frequency
>3 times a week 22.9
2 or 3 times a week 47.7
Once a week 18.3
<Once a week 11.0
150 M.D. Guàrdia et al. / Food Quality and Preference 21 (2010) 148–155
population aged over 16 and in this sense our sample was also
slightly biased.
Almost half of the respondents (47.7%) stated that they con-
sumed dry-cured ham two or three times a week, 22.9% more than
three times a week, 18.3% once a week and 11.0% less than once a
week. These results may be explained by the high Spanish con-
sumption per capita (4.6 kg per year, MAPA, 2005) and also be-
cause the consumption of dry-cured ham (higher than once every
two weeks) was one of the criteria of recruitment. These results are
in agreement with those obtained by Cilla et al. (2006), Resano,
Sanjuán, and Albisu (2007) and Morales, Guerrero, Claret, Guàrdia,
and Gou (2008).
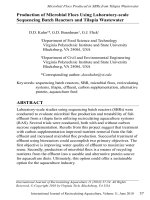
The results obtained that each consumer in FCP used 10 attri-
butes, on average, to describe differences between samples. The
number of attributes ranged from 4 to 20 (Fig. 2). Most of the terms
used by consumers (39.7%) referred to appearance, 26.5% to fla-
vour, 17.9% to texture and 15.9% to odour. The high number of con-
sumers’ words dealing with appearance (n = 431) agrees with
Guerrero, Aguiar, Guàrdia, Claret, and Arnau (2007) which stated
that this is the most important factor for Spanish consumers in
dry-cured ham purchase decisions. Furthermore, Köster (2003)
pointed out that visual attributes are easier to describe than the
oronasal senses, because vision and hearing are an inborn mecha-
nism, whereas the other senses rely largely on learning.
Table 3 shows the frequency of occurrence for the most fre-
quent attributes mentioned by consumers. Colour, intensity of
dry-cured ham odour, saltiness, intensity of dry-cured ham flavour
and fat content were mentioned by more than 59% of the respon-
dents. On taking into account the consumer response, it can be sta-
ted that the aforementioned descriptors probably represent the
most important sensory attributes in dry-cured ham or, according
to Köster (2003), the easiest to elicit. In a similar way, Resano et al.
(2007) observed that 90% of consumers from the central Spanish
region considered colour, fat and salty taste as very or quite impor-
tant in dry-cured ham selection. Also, Morales et al. (2008) found
that more than 70% of consumers from Catalonia (Northeast part
of Spain) pointed out that colour, salty taste, aged flavour and tex-
ture were the most important parameters affecting the purchase of
dry-cured ham.
Fig. 3 shows the graphic results of GPA over the consumer sen-
sory profiles. The variance accounting for the first two components
was 83.7%. Similar descriptors used by different assessors and lo-
cated in the same area in the first two dimensions have been
grouped. In these cases the size of the descriptor is proportional
to the number of consumers who agree on their use (Issanchou,
Schlich, & Lesschaeve, 1992). The results obtained revealed that
sample D (with the highest ageing time) located in the negative
area of the first dimension was mainly defined by colour, dry-cured
ham odour and flavour and fat content and, to a lesser degree (the
smaller letter size) by marbling, saltiness, texture, matured flavour,
juiciness and appearance. Conversely, sample A (with the least age-
ing time) located in the positive direction of the first axis was char-
acterized by hardness, dryness, saltiness and atypical flavour/
odour attributes. Ageing is referred to as one of the main factors
responsible for developing sensory characteristics of dry-cured
ham due to biochemical reactions that occur throughout this pro-
cess (Flores, Ingram, Bett, Toldrá, & Spanier, 1997). In this study,
another consideration to explain the differences observed between
samples A and D is their different physicochemical composition,
particularly in fat and moisture content (Table 1). Dry-cured hams
B and C show intermediate characteristics within this first dimen-
sion of the consensus space. However, the second dimension con-
Table 3
Frequency of occurrence for the most frequently elicited descriptors.
Attribute Original words (in
Spanish)
Frequency
a
(%)
Colour (dark, red) Color, color oscuro, rojo 87.2
Odour intensity (dry-cured ham
odour)
Olor, olor a jamón 75.2
Saltiness, amount of salt Salado, cantidad de sal 72.5
Flavour intensity (dry-cured ham
flavour)
Sabor, intensidad, a
jamón
66.1
Fat content Grasa, tocino 59.6
Matured Curado, curación 34.9
Marbling Veteado, vetas 31.2
Texture Textura 22.0
Dry Seco, sequedad 20.2
Hard (tough) Duro, dureza 20.2
White spots Pintas blancas, puntos
blancos
19.3
Tender Tierno, blando 19.3
Juiciness Jugoso, jugosidad 15.6
Brightness Brillo, brillante 13.8
Appearance Aspecto, presencia 13.8
Rancid Rancio 11.9
Soft Suave 11.0
Fat colour Color de la grasa 11.0
Uniform Uniformidad,
homogeneidad
9.2
Sinews Nervios 9.2
Slice size Tamaño de la loncha 9.2
Slice shape Forma de la loncha 8.3
Thickness Grosor, espesor 8.3
a
Percentage of respondents (n = 109).
0
5
10
15
20
4567891011121314
1
51617181920
number of atributes
number of consumers
undefined appearance odour taste texture
Fig. 2. Frequency of attributes used by consumers to describe dry-cured ham samples.
M.D. Guàrdia et al. / Food Quality and Preference 21 (2010) 148–155
151
trasts sample B in the positive direction, with sample C in the neg-
ative. Sample C is described as having white spots, matured, salti-
ness and tenderness attributes.
Some discrepancies were observed among consumers regarding
perception of saltiness in this study. Conversely, Parolari (1994)
did not observe these differences in a similar investigation per-
formed on Italian Parma hams. Saltiness was located in the four
areas defined by the first two dimensions, which means that they
were not used in the same way by the participants. Saltiness is a
basic taste and a well-known sensory attribute, so agreement
among consumers would be expected. This apparent contradiction
detected in saltiness can be explained by the fact that salt content
(NaCl) in Spanish dry-cured ham is very heterogeneous, particu-
larly when there are important differences in moisture content be-
tween muscles (Arnau, Guerrero, Casademont, & Gou, 1995). Since
several consumers only tasted a portion of the slices provided, this
could have contributed to the discrepancies in saltiness perception
among them. Another possible explanation for this contradictory
result is that dry-cured ham is a product with high salt content
that could lead to an adaptation in consumer perception. O’Mah-
ony (1986) explains that when a stimulus is experienced (i.e., a
product is tasted), some residue remains in the mouth. The taste
system adapts to such residual stimuli rendering it less sensitive
to such stimuli, and when tasted subsequently the high salt con-
tent will taste less intense. In order to reduce any desensitization
due to adaptation, unsalted crisp-bread and mineral water were
provided to rinse the mouth at the beginning of the session and be-
tween samples. However, it is probable that all the consumers did
not follow these recommendations fully. Conversely, the trained
assessors always tasted the central part of each slice containing a
portion of semimembranosus and biceps femoris muscles in order
to block differences in salt content between them. Furthermore,
trained panellists are aware of the fact that the taste system adapts
to residual stimuli when dry-cured ham is tasted and they follow
the abovementioned instructions. In our opinion these are the
main reasons for explaining why the problems observed in the
consumer study were not observed in the QDA study.
Hardness, fibrousness and tenderness attributes also showed a
slight disagreement (Fig. 3). Some consumers described sample A
as hard in the positive direction of the first dimension. However,
fibrousness, hardness and tenderness descriptors were also placed
in the negative area of this first dimension, close to sample D. Fur-
thermore, tenderness was also explained by the second dimension
and related with sample C in the negative direction of this axis.
Again, this discrepancy could be due to the slice portion tasted
by each consumer, since external muscles (semimembranosus) are
usually much harder than internal ones (biceps femoris)(Ruiz-
Ramírez, Arnau, Serra, & Gou, 2006). The meaning of the term tex-
ture (located in the negative area of the first dimension) is not eas-
ily interpreted, as it is of a multidimensional concept and therefore
a number of confusing attributes come together. In this sense, Szc-
zesniak (2002) stated that consumers have difficulty in describing
texture due to its complex nature, since there are no single and
specific receptors for it, in contrast to other sensory attributes,
such as colour and taste. Therefore, the apparent discrepancy ob-
served in our results could be due to the fact that consumers have
different ways of describing their perceptions, depending on indi-
vidual experiences, preferences and familiarity with the product
(Deliza et al., 2005). In addition, they may also differ considerably
in their ability to express themselves (Lachnit, Busch-Stockfisch,
Kunert, & Krahl, 2003).
Dry-cured ham samples were also sensory evaluated by a
trained panel to clarify and understand the consumer vocabulary
better. Least square means corresponding to the sensory descrip-
tors are shown in Table 4 (in this table, n = 3 means that three
dry-cured hams of each ageing time were sensory evaluated).
The total number of different descriptors generated by the trained
panel was slightly higher than those from the consumers. Con-
versely, Moskowitz (1983) stated that trained panellists use fewer
descriptors than those untrained, because it seems that the effort
expended in accurate description replaces the effort used to cap-
ture all attributes. Ten of the selected descriptors by the expert pa-
nel were discriminant (p
< 0.05) between dry-cured hams. Samples
A
and
D
were
different in eight of the twelve descriptors used,
however, B and C only differed in five of them (Table 4). Fig. 4
shows the graphic results of PCA over the sensory descriptors from
the trained panel and dry-cured ham samples.
The results obtained with GPA (Fig. 3) and PCA (Fig. 4) are com-
plementary to each other and sample location was similar among
consumers and trained assessors. Guerrero, Gou, and Arnau
(1997) also obtained similar results when they compared sensory
profiles from expert and semi-trained assessors. In this study, sam-
ples A and D were differentiated by the first dimension, whereas B
and C were separated by the second dimension. The comparison
D
B
C
A
colour
fat
odour
flavour
saltiness
marbling
odour
flavour
texture
hard
cured
white spots
atypical
flavour/odour
juiceness
saltiness
tender
cured
tender
appearance
saltiness
saltiness
dry
soft
brightness
fibrous/hard
shape
rancid
-1
-0.5
0
0.5
1
-1 -0.8 -0.6 -0.4 -0.2 0 0.2 0.4 0.6 0.8 1
Dimension 2 (26.5%)
Dimension 1 (57.2%)
Fig. 3. Consensus space obtained using Generalised Procrustes Analysis over the
sensory consumer profile of dry-cured ham (the letters represent the dry-cured ham
samples). The size of each descriptor is proportional to the number of assessors who
agree on their use. Only those descriptors having a correlation coefficient higher or
equal 0.06 with one of the two first dimensions of the consensus space are shown.
Table 4
Least square means and RMSE for each sensory descriptor and for each type of dry-
cured ham obtained from the sensory analysis (n = 3).
Attributes Samples
*
RMSE
ABCD
Flavour
Sweetness 0.3
c
0.8
bc
1.1
ab
1.9
a
0.665
Saltiness 4.9
a
3.0
b
4.2
a
2.4
b
1.168
Bitterness 1.3 1.0 1.2 0.9 0.848
Metallic 3.1
a
2.2
ab
2.0
bc
1.0
c
0.975
Piquantness 2.1
a
1.4
ab
1.7
ab
0.9
b
1.242
Matured flavour 2.4
b
3.0
b
4.7
a
5.6
a
1.168
Aged flavour 0.3
c
0.7
c
2.3
b
4.2
a
1.110
Texture
Adhesiveness 1.1
b
1.8
a
1.0
ab
1.6
ab
0.999
Hardness 4.0
a
3.0
b
4.0
a
3.2
b
0.615
Crumbliness 4.2
b
4.7
ab
5.1
a
5.3
a
0.855
Pastiness 1.2
ab
1.8
a
0.5
c
1.1
bc
0.879
Fibrousness 3.4 2.9 3.4 2.8 0.854
a,b,c
Within a row, least square means with different superscripts differs signifi-
cantly (p < 0.05).
RMSE: root mean standard error.
*
A = 6, B = 9, C = 12 and D = 18 months of ageing time, respectively.
152 M.D. Guàrdia et al. / Food Quality and Preference 21 (2010) 148–155