- Trang chủ >>
- Đại cương >>
- Kinh tế lượng
Tra bảng dubin watson
Bạn đang xem bản rút gọn của tài liệu. Xem và tải ngay bản đầy đủ của tài liệu tại đây (55.4 KB, 4 trang )
Durbin-Watson Critical Values - 95%
(
d
)
Pa
g
e 1 of 4
SPS Home
>
Stats Tables
>
Durbin Watson 0.05 Table
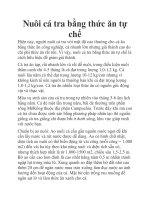
Critical Values for the Durbin-Watson Statistic (d)
Level of Significance
α
= .05
n
k
= l
k
= 2
k
= 3
k
= 4
k
= 5
d
L
d
U
d
L
d
U
d
L
d
U
d
L
d
U
d
L
d
U
6
0.61 1.40
1.90
2.29
2.13 0.30 2.59
7
0.70 1.36 0.47
8
0.76 1.33 0.56 1.78 0.37
9
0.82 1.32 0.63 1.70 0.46
10
0.88 1.32 0.70 1.64 0.53 2.02 0.38 2.41 0.24 2.82
11
0.93 1.32 0.66 1.60 0.60 1.93 0.44 2.28 0.32 2.65
12
0.97 1.33 0.81 1.58 0.66 1.86 0.51 2.18 0.38 2.51
13
1.01 1.34 0.86 1.56 0.72 1.82 0.57 2.09 0.45 2.39
14
1.05 1.35 0.91 1.55 0.77 1.78 0.63 2.03 0.51 2.30
15
1.08 1.36 0.95 1.54 0.82 1.75 0.69 1.97 0.56 2.21
16
1.10 1.37 0.98 1.54 0.86 1.73 0.74 1.93 0.62 2.15
17
1.13 1.38 1.02 1.54 0.90 1.71 0.78 1.90 0.67 2.10
18
1.16 1.39 1.05 1.53 0.93 1.69 0.92 1.87 0.71 2.06
19
1.18 1.4 1.08 1.53 0.97 1.68 0.86 1.85 0.75 2.02
20
1.20 1.41 1.10 1.54 1.00 1.68 0.90 1.83 0.79 1.99
21
1.22 1.42 1.13 1.54 1.03 1.67 0.93 1.81 0.83 1.96
22
1.24 1.43 1.15 1.54 1.05 1.66 0.96 1.80 0.96 1.94
23
1.26 1.44 1.17 1.54 1.08 1.66 0.99 1.79 0.90 1.92
24
1.27 1.45 1.19 1.55 1.10 1.66 1.01 1.78 0.93 1.90
25
1.29 1.45 1.21 1.55 1.12 1.66 1.04 1.77 0.95 1.89
26
1.30 1.46 1.22 1.55 1.14 1.65 1.06 1.76 0.98 1.88
27
1.32 1.47 1.24 1.56 1.16 1.65 1.08 1.76 1.01 1.86
28
1.33 1.48 1.26 1.56 1.18 1.65 1.10 1.75 1.03 1.85
29
1.34 1.48 1.27 1.56 1.20 1.65 1.12 1.74 1.05 1.84
30
htt
p
://www.ekonomi
j
a.c
g
.
y
u/dokumenta/ekonometri
j
a/Durbin-Watson%20statistika.htm
1.35 1.49 1.28 1.57 1.21 1.65 1.14 1.74 1.07 1.83
2006-04-27
Where
n
= number of observations and
k
= number of independent variables
31
1.36 1.50 1.30 1.57 1.23 1.65 1.16 1.74 1.09 1.83
32
1.37 1.50 1.31 1.57 1.24 1.65 1.18 1.73 1.11 1.82
33
1.38 1.51 1.32 1.58 1.26 1.65 1.19 1.73 1.13 1.81
34
1.39 1.51 1.33 1.58 1.27 1.65 1.21 1.73 1.15 1.81
35
1.40 1.52 1.34 1.58 1.28 1.65 1.22 1.73 1.16 1.80
36
1.41 1.52 1.35 1.59 1.29 1.65 1.24 1.73 1.18 1.80
37
1.42 1.53 1.36 1.59 1.31 1.66 1.25 1.72 1.19 1.80
38
1.43 1.54 1.37 1.59 1.32 1.66 1.26 1.72 1.21 1.79
39
1.43 1.54 1.38 1.60 1.33 1.66 1.27 1.72 1.22 1.79
40
1.44 1.54 1.39 1.60 1.34 1.66 1.29 1.72 1.23 1.79
45
1.48 1.57 1,43 1.62 1.38 1.67 1.34 1.72 1.29 1.78
50
1.50 1.59 1.46 1.63 1.42 1.67 1.38 1.72 1.34 1.77
55
1.53 1.60 1.49 1.64 1.45 1.68 1.41 1.72 1.38 1.77
60
1.55 1.62 1.51 1.65 1.48 1.69 1.44 1.73 1.41 1.77
65
1.57 1.63 1.54 1.66 1.50 1.70 1.47 1.73 1.44 1.77
70
1.58 1.64 1.55 1.67 1.52 1.70 1.49 1.74 1.46 1.77
75
1.60 1.65 1.57 1.68 1.54 1.71 1.51 1.74 1.49 1.77
80
1.61 1.66 1.59 1.69 1.56 1.72 1.53 1.74 1.51 1.77
85
1.62 1.67 1.60 1.70 1.57 1.72 1.55 1.75 1.52 1.77
90
1.63 1.68 1.61 1.70 1.59 1.73 1.57 1.75 1.54 1.78
95
1.64 1.69 1.62 1.71 1.60 1.73 1.58 1.75 1.56 1.78
100
1.65 1.69 1.63 1.72 1.61 1.74 1.59 1.76 1.57 1.78
150
1.72 1.75 1.71 1.76 1.69 1.77 1.68 1.79 1.66 1.80
200
1.76 1.78 1.75 1.79 1.74 1.80 1.73 1.81 1.72 1.82
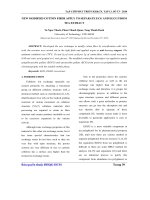
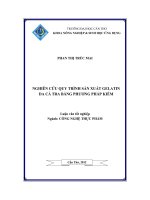
Critical Values for the Durbin-Watson Statistic (d)
Level of Significance
α
= .05
n
k
= 6
k
= 7
k
= 8
k
= 9
k
= 10
d
L
d
U
d
L
d
U
d
L
d
U
d
L
d
U
d
L
d
U
Pa
g
e 2 of 4Durbin-Watson Critical Values - 95%
(
d
)
2006-04-27htt
p
://www.ekonomi
j
a.c
g
.
y
u/dokumenta/ekonometri
j
a/Durbin-Watson%20statistika.htm
11
0.20 3.01
12
0.27 2.83 0.17 3.15
13
0.33 2.70 0.23 2.99 0.15 3.27
14
0.39 2.57 0.29 2.85 0.20 3.11 0.13 3.36
15
0.45 2.47 0.34 2.73 0.25 2.98 0.18 3.22 0.11 3.44
16
0.50 2.39 0.40 2.62 0.30 2.86 0.22 3.09 0.16 3.30
17
0.55 2.32 0.45 2.54 0.36 2.76 0.27 2.98 0.20 3.18
18
0.60 2.26 0.50 2.47 0.41 2.67 0.32 2.87 0.24 3.07
19
0.65 2.21 0.55 2.40 0.46 2.59 0.37 2.78 0.29 2.97
20
0.69 2.16 0.60 2.34 0.50 2.52 0.42 2.70 0.34 2.89
21
0.73 2.12 0.64 2.30 0.55 2.46 0.46 2.63 0.38 2.81
22
0.77 2.09 0.68 2.25 0.59 2.41 0.51 2.57 0.42 2.73
23
0.80 2.06 0.72 2.21 0.63 2.36 0.55 2.51 0.47 2.67
24
0.84 2.04 0.75 2.17 0.67 2.32 0.58 2.46 0.51 2.61
25
0.87 2.01 0.78 2.14 0.70 2.28 0.62 2.42 0.54 2.56
26
0.90 1.99 0.82 2.12 0.74 2.24 0.66 2.38 0.58 2.51
27
0.93 1.97 0.85 2.09 0.77 2.22 0.69 2.34 0.62 2.47
28
0.95 1.96 0.87 2.07 0.80 2.19 0.72 2.31 0.65 2.43
29
0.98 1.94 0.90 2.05 0.83 2.16 0.75 2.28 0.68 2.40
30
1.00 1.93 0.93 2.03 0.85 2.14 0.78 2.25 0.71 2.36
31
1.02 1.92 0.95 2.02 0.88 2.12 0.81 2.23 074 2.33
32
1.04 1.91 0.97 2.00 0.90 2.10 0.84 2.20 0.77 2.31
33
1.06 1.90 0.99 1.99 0.93 2.09 0.86 2.18 0.80 2.28
34
1.08 1.89 1.02 1.98 0.95 2.07 0.89 2.16 0.82 2.26
35
1.10 1.88 1.03 1.97 0.97 2.05 0.91 2.14 0.85 2.24
36
1.11 1.88 1.05 1.96 0.99 2.04 0.93 2.13 0.87 2.22
37
1.13 1.87 1.07 1.95 1.01 2.03 0.95 2.11 0.89 2.20
38
1.50 1.86 1.09 1.94 1.03 2.02 0.97 2.10 0.91 2.18
39
1.16 1.86 1.10 1.93 1.05 2.01 0.99 2.09 0.93 2.16
40
1.18 1.85 1.12 1.92 1.06 2.00 1.01 2.07 0.95 2.15
Pa
g
e 3 of 4Durbin-Watson Critical Values - 95%
(
d
)
2006-04-27htt
p
://www.ekonomi
j
a.c
g
.
y
u/dokumenta/ekonometri
j
a/Durbin-Watson%20statistika.htm
Where
n
= number of observations and
k
= number of independent variables
45
1.24 1.84 1.19 1.90 1.14 1.96 1.09 2.02 1.04 2.09
50
1.29 1.82 1.25 1.88 1.20 1.93 1.16 1.99 1.11 2.04
55
1.33 1.81 1.29 1.86 1.25 1.91 1.21 1.96 1.17 2.01
60
1.37 1.81 1.34 1.85 1.30 1.89 1.26 1.94 1.22 1.98
65
1.40 1.81 1.37 1.84 1.34 1.88 1.30 1.92 1.27 1.96
70
1.43 1.80 1.40 1.84 1.37 1.87 1.34 1.91 1.31 1.95
75
1.46 1.80 1.43 1.83 1.40 1.87 1.37 1.90 1.34 1.94
80
1.48 1.80 1.45 1.83 1.43 1.86 1.40 1.89 1.37 1.93
85
1.50 1.80 1.47 1.83 1.49 1.86 1.42 1.89 1.40 1.92
90
1.52 1.80 1.49 1.83 1.47 1.85 1.45 1.88 1.42 1.91
95
1.54 1.80 1.51 1.83 1.49 1.85 1.46 1.88 1.44 1.90
100
1.55 1.80 1.53 1.83 1.50 1.85 1.48 1.87 1.46 1.90
150
1.65 1.82 1.64 1.83 1.62 1.85 1.60 1.86 1.59 1.88
200
1.71 1.83 1.70 1.84 1.69 1.85 1.68 1.86 1.67 1.87
Pa
g
e 4 of 4Durbin-Watson Critical Values - 95%
(
d
)
2006-04-27htt
p
://www.ekonomi
j
a.c
g
.
y
u/dokumenta/ekonometri
j
a/Durbin-Watson%20statistika.htm