LIMITATIONS AND DIRECTION FOR FURTHER RESEARCH
Bạn đang xem bản rút gọn của tài liệu. Xem và tải ngay bản đầy đủ của tài liệu tại đây (743.48 KB, 159 trang )
Table of Content
1. EXECUTIVE SUMMARY 4
2. BACKGROUND, OBJECTIVES AND SCOPE 7
2.1 Background 7
2.2 Objectives 7
2.3 Information needs 7
2.4 Scope 8
3. METHODOLOGY 8
3.1 The study approach 8
3.2 Methodology in focus 9
4. LITERATURE REVIEW 16
4.1 The possibilities of the market study 16
4.2 Organization of the market study 16
4.3 Elements of the market study 17
4.4 The qualitative -- quantitative dichotomy 20
4.5 Product positioning and perceptual mapping 20
4.6 Product diffusion process 23
4.7 Pricing survey techniques 26
5. QUALITATIVE PILOT FINDINGS 30
5.1 Coffee using and buying habits 30
5.2 Instant coffee mix usage, relative advantages and disadvantages 30
5.3 Brand awareness and attitudes toward brand choice 31
5.4 Preference on the product features 31
1
5.5 Product packages 31
5.6 Advertising awareness 31
5.7 Taste test 32
6. DATA ANALYSIS: CONSUMER SURVEY 36
6.1 Brand Awareness 36
6.2 Popularity 37
6.3 Estimated Market Potential 39
6.4 Where would the product sales volume come from? 41
6.5 Product positioning 44
6.6 Pricing points 51
6.7 Consumer using and buying habits 56
7. DATA ANALYSIS: TRADE SURVEY 60
7.1 Brand Awareness 60
7.2 Popularity 63
7.3 Profile of channel members 64
8. CONCLUSIONS AND RECOMMENDATIONS 70
8.1 Cannibalizing effect 70
8.2 Product positioning 71
8.3 Promotion mix issues 71
8.4 Placing issues 75
8.5 Pricing issues 75
8.6 Overall conclusion 75
9. LIMITATION AND DIRECTION FOR FURTHER 76
10. TABULATIONS: CONSUMER SURVEY 78
2
11. TABULATIONS: TRADE SURVEY 121
12. APPENDIXES 139
12.1 MODERATOR GUIDELINE 139
12.2 CONSUMER QUESTIONNAIRE 146
12.3 TRADE QUESTIONNAIRE 151
12.4 TRADE SURVEY: SAMPLE ELEMENTS 153
3
1. Executive summary
This report was written after a market study on the instant coffee mix market niche was
carried out in Ho Chi Minh City, Viet Nam by the end of February 1997. The overall
objective of this market study was to evaluate the market potential and to determine
success factors for our new product, a Nescafe 3 in 1 coffee mix in the niche. Our
research efforts were therefore be organized to achieve the following sub-objectives: To
get a feedback on the product perception; To get a feedback on the awareness and
popularity; To estimate the market consumption volume; To find out where the product
sales volume would come from: cannibalizing the firm’s existing products/brands; the
competing products; or growing the market; To determine how to best position the
product to enhance trial purchase; To determine what the price points and the acceptable
price range are to gain maximum sales volume.
We employed a phase approach to manage this study project. The first phase enabled us
to obtain certain qualitative findings about the market through moderating a couple of
focus groups. In the second phase, we obtained quantitative findings through carrying
out two surveys with the consumers of the product field and the distribution channel
members. Sample elements were chosen by a systematic approach for wholesalers,
retailers and households in Ho Chi Minh City. Blind study is a key principle for this market
research where people were not aware that we were conducting research on Nescafe 3
in 1 coffee mix. Besides, all relevant secondary information have continuously been
gathered to build up background understanding of the market, especially in the first
phase of the project, and to frame the whole picture of the market.
With an estimated market consumption volume of 280,000 48-sachet bags per month,
instant coffee mix is still a new product concept in the consumers’ perception. There are
currently 8 brands on the market, of which Vinacafe, Mac Coffee, Indocafe and Super
Coffee are in the four top popular brands. Nescafe Deluxe, Parrigold, Goldroast and OWL
gain a very modest level of awareness in the mind of the consumers and they are
obviously not popular at all.
To launch a Nescafe instant mix brand, one of the first things the company must do in
this introduction phase of the product life cycle is to build up the product and brand
awareness. Strong awareness of the brand is really an important lever to boost up trial
purchase, especially to compete against the leading brand Vinacafe.
At the present time, cannibalizing is not a crucial problem for launching Nescafe 3 in 1.
The consumer usage patterns prove that they drink instant coffee mixes in addition to the
regular coffee they drink, so they drink more. Thus, the estimated sales volume would
likely come from growing the market rather than from cannibalizing the company’s
existing instant coffee products.
In the eyes of the consumers, the 4 most important features of an instant coffee mix are
aroma, taste, natural coffee essence and convenience (quick and easy to prepare).
These features are the key dimensions which marketers must consider in defining their
product positioning strategy. The company’s brand has relative advantage as it might
appeal the consumers that “it is a natural taste”.
4
On the side of promotion, we think that a pull strategy is probably more appropriate than
a push strategy in the current market situation. The company’s marketing activities
should be concentrated in consumer promotion rather than in trade promotion. This
suggestion is based on the research results for the channel member attitudes toward
brand carry and the consumer attitudes toward brand choice. The trade survey shows
that nearly 60% of the channel members are likely to carry brands if they have
demonstrated demand. Most of them seem to be promotion insensitive, too. The survey
data prove that customers are the most important source of knowledge to the channel
members. In addition, clerks or salespersons could well influence the consumers’
decision at stores.
About good promotion tools, we find it that the sales promotion tools which rely on price
reduction basis are not very effective. Looking at the consumers’ sources of knowledge,
we would see that advertising is likely the most effective way to communicate.
Consumers also tend to learn about brands through clerk/salesperson and talking with
friends. Thus, to maximize the effectiveness of communications, the company may spend
much of its efforts in enhancing the positive role of demonstrators and using point-of-
purchase displays. Sponsorship activities and word-of-mouth management are
substantially needed, too.
We suggest that the nature of the promotion should be a product campaign rather than a
brand campaign. A product advertising campaign will be sufficient because people tend
to know about the brand Nescafe (Classic) well. A point that should be made clear is the
difference between instant coffee and instant coffee mix. Awareness of Nescafe Deluxe
would come along with the product concept itself.
The message of the advertising campaign should serve to tell consumers about the
product’s aroma, its natural taste and its convenience in use such as time saving, quick
and easy to prepare. Our target audiences are the coffee drinkers who drink coffee at
home.
In order to support for the pull strategy in communication and promotion, the distribution
system must be organized well to be ready in providing goods when the consumers
come to demand. It should be noted that most common places to buy coffee products are
provision shops and outlets in markets. The key role of these salesmen is to come to
appeal the retailers to carry the company’s own brand rather than just come to deliver
goods.
How to set prices depends on the company pricing objectives. We find out with interest
that the consumers would likely accept a relatively wide range of price points. This would
allow the company easily adopt price levels to best fit with various pricing objectives.
If the company decides to launch its Nescafe Deluxe into this market niche, it would be
able to gain some advantages of a market nicher. Firstly, the company has required skills
and strong resources to serve the niche in a superior fashion. Secondly, the company
can defend itself against the major attacking competitor (Vinacafe) by the customer
goodwill it has built up. Furthermore, Nestle has been a very famous name in Vietnam for
many years. Thirdly, the niche has growth potential.
5
Launching decision is still depended on two major considerations. The first issue is
whether the company product well satisfy the consumer taste. The second issue is
whether the financial analysis come to prove that the product sales volume may gain
sound profitability.
6
2. Background, objectives and Scope
2.1 Background
For about 2-3 years, instant coffee mixes consisting of instant coffee, non-dairy creamer
and sugar have been present in the Vietnamese market. As this seems to be a potential
segment in the instant coffee complete mixes, we need to carry out a market study on the
instant coffee mixes niche. Our major consideration is wether the company should, or
should not, launch a new product into this market niche.
The company’s product is Nescafe 3 in 1 coffee mix which has been successfully
launched in some other Asian countries. This brand has also been introduced on trial
sales in HCMC market for a few months without much marketing support. However, the
product concept seems not to be appreciated much by Vietnamese consumers,
especially the elder generations. The company’s target consumers will, therefore, be the
new generation of people whose lifestyle are changing in a more concisely-oriented
direction toward the product’s global concepts.
2.2 Objectives
The overall objective of this market study was to evaluate the market potential and to
determine success factors for our new product, a Nescafe 3 in 1 coffee mix in the niche.
Our research efforts were therefore be organized to achieve the following sub-objectives:
• To get a feedback on the product perception;
• To get a feedback on the awareness and popularity;
• To estimate the market consumption volume;
• Certain efforts would be spent to find out where the product sales volume would
come from: cannibalizing the firm’s existing products/brands; the competing
products; or growing the market;
• To determine how to best position the product to enhance trial purchase;
• To determine what the optimal price point, indifferent price point and the
acceptable price range are to gain maximum sales volume.
2.3 Information needs
In order to reach at these objectives, the market study must have to gather all the
information needs described below:
• Estimation of the market potential
• percentage of population who use coffee
• percentage of population who use instant coffee mix
• time of consumption (on daily/weekly basis)
• volume of consumption per time
• What is the price point to gain maximum sales volume?
• optimal price point
7
• indifferent price point
• acceptable price range
• Where do the estimated sales volume come from?
• cannibalizing the company’s existing products
• competitors products
• growing the market
• Awareness and popularity, unaided and aided asking for
• have heard of
• have ever used
• use most often
• The product diffusion
• What do consumers perceive really relative advantages of the product?
• What do consumers consider difficulties and/or dissatisfaction about using the
product?
• How do consumers know about the results of the other people’s use of the
product
• Consumer attitude and behavior
• How do consumers rate specific attributes of the product?
• Brand choice -- brand loyalty, brand switching
• Brand satisfaction -- which brands do consumers think they would buy next?
Which others might they buy? Which brands would they not consider buying
and why?
• How would they learn about new brands and come to try the new brands or
even other brands not their own?
• Purchasing pattern -- How often do people buy? How much do they buy at a
time? What are on their inventories? Where do they buy?
• People involving the product purchase and use -- Is the user the same person
as the purchaser? If not, who does the purchase? Who decide on brand
choice? (users or purchaser)
• Which consumers would likely buy the product?
• By demographics -- Sex, age, occupation, income (personal and family),
geographical residence
2.4 Scope
The scope of the study was in Ho Chi Minh City where is actually a greatest center of
socio-economic development in the country. The changing lifestyle of people in the city
likely promises a potential for the product field. Achieving its objectives, the study would
assist the company marketing managers in pursuing their own strategies by making them
better-informed about the critical issues which play the role of a survival guide to a new
product development. In launching new products, if thing can go wrong, it will go. We also
hope that the research result would help mangers make less-risky decisions.
3. Methodology
3.1 The study approach
8
We planned to employ a phase approach to manage this study project. The first phase
enabled us to obtain certain qualitative findings about the market through moderating a
couple of focus groups. In the second phase, we obtained quantitative findings through
carrying out two surveys with the consumers of the product field and the distribution
channel members. Sample elements were chosen by a systematic approach for
wholesalers, retailers and households in Ho Chi Minh City. Blind study is a key principle
for this market study where people were not aware that we were conducting research on
Nescafe 3 in 1 coffee mix. Besides, all relevant secondary information have continuously
been gathered to build up background understanding of the market, especially in the first
phase of the project, and to frame the whole picture of the market.
3.2 Methodology in focus
3.2.1 Conduction of focus groups
Qualitative measurement was mainly employed in this market study to compensate for its
limitations on quantitative side, especially in deriving out key attributes for the product
positioning.
We moderated two focus groups whose attendants were carefully selected among the
current users of the product field. Attendant choice criteria for the two groups were
defined as follows:
Group 1. Current female users (7 persons)
• Coffee drinkers
• Age range: 18 to 30
• Upper and middle income classes
• Occasionally and/or trial used instant coffee mixes
Group 2. Current male users (6 persons)
• Coffee drinkers
• Age range: 18 to 30
• Upper and middle income classes
• Occasionally and/or trial used instant coffee mixes
The group discussions were conducted in a professional room with one-way mirror and
audio-video recording systems which enabled high level of accuracy in group analysis. All
transcripts were done in Vietnamese to minimize the language errors. At the end of the
process, the qualitative report was written in English.
3.2.2 Configuration of the perceptual maps
Much of our research efforts were organized to produce as much realistic perceptual
maps as possible. This would serve to obtain a picture of competitive products and help
build a good positioning strategy.
Within the focus groups operation, certain key attributes of the product would be derived
by using Preference method, one of the non-attribute base methods. Attendants were
asked to find out the similarities of all brands which they have experienced and/or were
shown at site by the moderator. In the quantitative phase, respondents were asked to
9
rate on a set of attributes which were already defined through qualitative phase. The
perceptual maps are presented in multiple attribute maps.
The rating scores on different attributes for the competent brands were analyzed by
Correspondence Analysis technique. Firstly, raw data
1
were reduced by Factor Analysis
technique to determine which were key attributes and which were supplementary ones.
In figuring the perceptual maps, the key attributes play the role of active attributes which
contribute to the shape of the map. The supplementary attributes play the role of passive
attribute which feature on the map but not contribute to its shape.
3.2.3 Determination of pricing points
We aimed to determine the optimal, indifferent price points and an acceptable price range
by which the company may obtain maximum sales quantity.
Respondents were asked the four following questions
2
:
• At what price point of this scale do you begin to consider “expensive” about
the product?
• At what price point do you begin to consider “too expensive” so that you will
never buy the product?
• At what price point do you begin to consider “cheap” about the product?
• At what price point do you begin to consider “too cheap” so that you can doubt
the product’s quality and therefore will not buy it?
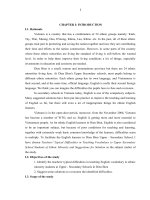
Then, price points and an acceptable price range are defined as follows:
Acceptable range: the range of price is from the point of marginal cheapness to
marginal expensiveness where consumers are least antagonistic. People would feel the
price is neither too expensive nor too cheap. The acceptable range provides an adjacent
to the indifferent point.
3
Indifferent price point: where the two distribution curves “expensive” and “cheap” cross
each other. At which an equal number of people experience the product as cheap or as
expensive. It is a less stringent measure than optimal price point and generally
represents the median price actually paid by consumers of the product.
4
Optimal price point: where the two distribution curves “too expensive” and “too cheap”
cross each other. At which resistance against the price of the particular product is lowest
and would alienate the least number of consumers.
5
Another question “At what price point do you consider about right?” was also employed to
check the accuracy of the model.
Price points for the individual brands were gathered from those who have used the
brands. Particularly, Nescafe Deluxe’s price levels were asked to all the peolple. Number
of responses to Question 15 are listed below:
1
See Question 14, Consumer Questionnaire
2
See Question 15, Consumer Questionnaire
3
See Chart i enclosed
4
See Chart i enclosed
5
See Chart ii enclosed
10
Nescafe Deluxe Vinacafe Super Coffee Indocafe
Number of
cases 102 32 12 10
11
Percentage of responses
(%)
100
Cheap
Expensive
50
Acceptable range
Not
expensive
Not cheap
Prices
Indifferent point
(not cheap = 100 - cheap; not expensive = 100 - expensive)
Chart i. Acceptable range and indifferent point
Percentage of responses
(%)
100
Too cheap
Too
expensive
50
Optimal
point
Prices
Chart ii. Optimal price point
12
3.2.4 Estimation of the market potential
Market potential was measured by market consumption volume. We planned to employ
the Chain Ratio method to estimate the potential market consumption volume, which was
derived the volume consumed by end users.
Market
consumption
volume
=
total
population
in the city
x
Percentage
of coffee
drinkers
x
percentage
who drink
instant coffee mixes
x
number of cups
(per day or
per week)
x
number of weeks
for the
estimating period
3.2.5 Sampling Plans
For the consumer survey: As to the nature of the research problems, we need to get a
sample that obtains highest representative for the population in the city. We therefore
employed a stratified sampling procedure. Age category (from 18 to 30 and from 30 to
60) was defined as the stratum for dividing sub-samples. Total sample size was divided
into sub-zones, in the four typical districts, in consistent with the district’s population
density. The sampling procedure must have to ensure the probability in selecting
respondents to measure the percentage of coffee drinkers. In the same time, it is very
essential to get information from the current users of the product field. In order to meet
both of the requirements, interviewers were instructed to list all adults in the household
on a grid list (with a table of random numbers) and note down who are coffee drinkers
and who are not. Then, a respondent was choose randomly among the coffee drinkers in
the household.
6
Sample members in each sub-zones would be pre-selected by
systematic procedure through which the households without coffee drinkers would be
skipped as non-coffee-drinker households.
For the trade survey: Convenience sampling were employed to get about 67 outlets.
Wholesalers and retailers were systematically selected at several central location
markets in the city as below:
Wholesaler Retailer Total sample of
the trade survey
24 43 67
Note: A list of sample elements is enclosed in the Appendix section of this report.
3.2.6 Characteristics of the sample and how well it works
Since the company’s target consumers seem to be the new generation of people whose
lifestyle are changing in a more concisely-oriented direction toward the product’s global
concepts and coffee is considered the product for adults by a majority, the target
population of the consumer survey is all adults in the city who aged from 18 to 60 years
old. Age category was therefore used as an important stratum of the stratified sampling
6
See Question 2, Consumer Questionnaire
13
procedure applied in the survey. As the total sample size was relatively small, the
stratum of sample was divided by disproportionate method to ensure each of the sub-
sample is large enough for statistical analysis. Field work was controlled to obtain a
sample with two age category as below
7
:
Sub-Sample With Stratum By Age Range
From 18 to 30 From 30 to 60 Total Sample Size
58 47 105
The second important feature of the sample was that it should ensure to get information
from current users of the product field. For this purpose, the sample elements were
actually selected among the coffee drinkers in the households. In our survey, a coffee
drinker is defined as the one who drinks at least one cup of coffee a day, or at least 6
cups a week.
This way of selecting respondents (as described in Sampling Plans above) could enable
us get enough instant mix drinkers into the sample. However, we had no choice to ignore
a factor that women are likely to drink instant mix even though they are not coffee
drinkers as particularly defined for this survey. As a result, women just randomly take
more than 11% of the sample in compared to nearly 90% for men.
8
Through some
qualitative observations, we found it that occasional drinkers are likely to drink instant
coffee mixes. This point reflects an impediment in the sampling procedure, too.
The third important feature of the sample was in the concentration of middle and upper
income people since the price of most instant mix products is likely suitable to these
people. This requirement was met by choosing the four typical districts whose residences
are relatively rich in the city
9
. Sub-zones in each districts were also selected in the same
manner. Besides, the sample elements were relative equally distributed among some
representative occupation categories: students, small shop owners, blue collars, white
collars, free-jobs, housewives, officials and retired or unemployed people.
10
Those people
are working in the State-owned and the private sectors
11
. We failed to get into our sample
the people who work in the foreign sector. These people seem to earn high income and
to be very busy so they are more likely to drink instant coffee mixes. But, they are too
busy to have chances to talk with our interviewers (They were not approached by our
interviewers).
Last but not least, it is necessary to define who are instant mix users. In this survey, non-
instant-mix users are those who drink instant mix less than 5% out of the total coffee they
drink. The other people who drink instant mix more than 5% out of the total coffee they
drink are defined as instant mix users, eventhough they just drank some instant mix
brands for a few times.
12
With such a determination, our sample has nearly a half of non-
instant-mix users and more than a half of instant-mix users:
7
See Tables 17b and 17c
8
See Table 17a
9
See Table 18.1 and 18.2
10
See Table 17d
11
See Table 17e
12
See Table 8.3
14
Percent of instant mix Non-user User Total Sample
Less than 5% 48 48
More than 5% 57 57
Total 48 57 105
15
4. Literature Review
4.1 The possibilities of the market study
The possibilities for what we can cover in a market study are diverse, and the real issue
is usually not what to include, but what to leave out. We must determine what is relevant
now and potentially useful up ahead, rather than ask about everything that everybody
may have a passing interest in at this time. Similarly, the real technical concern is usually
not what statistical techniques to use to analyze the data, but what not to use. We must
apply those techniques that will enlighten and not merely bedazzle. Nothing should ever
be reduced to mere formula, even in a market tracking study where we may have asked
the question many times before.
13
4.2 Organization of the market study
The organization of the questionnaire for the market study is quite free, but often the
sections appear in an order we call “ABC”:
A is for Awareness, followed by Attitude. What do people know (cognition) or think
they know (image), to form perception. What are their opinions about key things
(importance of various elements to choice, ratings and ranking of brands,
satisfactions and dissatisfactions, etc.)
B is for Behavior (purchasing, usage, etc.)
C is for Characteristics (demographic and psychographics)
The order is, of course, suggestive rather than definitive, but the flow is logical: What is
the horizon of consciousness (awareness)? What do respondents think about it all
(attitude)? How do they act in the world (behavior)? And what are they (characteristics)?
In the best market studies, these and other elements will interweave, threads from one
logically derive from somewhere and lead somewhere else. They will interlock, so that
they hold together in a cohesive way. They will synergize, so that they whole is a
powerful instrument, drawing on the parts and, in the end, being more that just a simple
addition of numerous questions.
Finally, the study should deal with every part of the company’s planning process. At least
it should examine every part before we finalize the study, to see what needs to be
researched out in the market. Do we need to study the company’s image, perhaps, in
addition to the image of its brands. We must decide if we need to research scenarios,
(management’s alternative visions for the future); or corporate strategies: or tactics. Of
course, most marketing studies also cover aspects of the four P’s (product, price, place,
promotion). Other parts of the “micromarketing” mix, controllable things, are also
researched -- like other P’s: positioning, packaging, personality, premise, promise,
13
Neil Bruce Holbert and Mark W. Speece, Practical Marketing Research -- An Integrated
Global Perspective, 1st Edition, Prentice Hall’s Simon & Schuster (Asia) Pte. Ltd., 1993 (p. 244 )
16
proposition, change, culture, etc. So are the M’s, executional elements like media,
money, message, and all the rest.
14
4.3 Elements of the market study
4.3.1 Awareness
Measuring awareness can involve asking respondents a whole host of things. Many of
the questions simply seek to find out if people have heard of the products. We ask which
brands they can name unaided. We are often particularly interested in “top-of-mind”
awareness, the brand named first, which is usually (but not necessarily) their own brand.
We ask which other brands they can recall aided. We want to know what new products
they remember seeing.
We are also interested in whether people are getting information about brands from
advertising. We ask which brands they have seen advertising for. We want to know
where and when they saw it. We are usually especially interested in seeing how much
attention people pay to advertising for new products. For all advertising, we also want to
know how much information people get from it. We ask about what they advertising said
and showed.
Similarly, we often want to know about promotions. What brands do people remember
promotions for? Do they recall promotions for new products? And, of course, for brand,
advertising, and promotions, we always should find out what people think of them. High
awareness is no good if everyone know about the product, but they all think it is terrible;
or everyone saw the advertising but it turned them all against buying the brand.
4.3.2 Attitude
Measuring attitudes in market studies is no different from measuring them in other
studies. We need to know what the most important product attributes are for
respondents. We want to know what their “ideal” brand would look like. Key criteria and
ideal brands can change as lifestyles and values change.
We ask about how each brand rates on key attributes. These should include physical
attributes such as taste, aroma, or packaging as well as image items like perception of
users, suitability “for me”, etc. The list should be derived from previous work, both
qualitative and quantitative. It should include a wide variety of items that have been
shown to impact on choice. Such a list can be a centerpiece of a factor analysis to
uncover which of them go together to form a single construct.
We would need to know whether respondents believe that there are real differences
among brands. Also, whether they believe that there could be real differences among
brands. If there are or could be differences, on which attributes? We sometimes need to
learn what people think are the specific similarities and differences among brands. We
could have them sort cards containing brands names into piles of the brands that are
“like each other”, and tell why they are alike.
14
Neil Holbert and Mark Speece, opcit, (p. 246-247)
17
We would ask about what people like and dislike in general about brands in the product
category and about specific key brands. That is, we want to know brand satisfactions,
and, even more important, their dissatisfactions. What would they like to see in the
market that is not there now? Which brand do they think they would buy next? Why?
Which others might they buy? Which brands would they not consider buying and why?
4.3.3 Behavior
We may never know everything about “why”, even after extensive analysis of material
such as just suggested. But it is vital to know all the “what’s”. We may choose to go with
the flow or we may decide that the time is right to buck a trend, but, whatever we decide,
we must know what is actually going on!
Typical things we might cover in the study include finding out about brand usage. We can
ask about the respondent’s current brand, and how long it has been used. This is
psychologically what people think of as their favorite brand. Actual practice may (or may
not always) be the same, so we have to check sometimes.
We can also learn something about the depth of brand loyalty by finding out what
respondents would do if their own brand was not available where they usually buy it.
Would they wait until it was in stock again? Would they go to another store to look for it?
Would they buy another type or size of the same brands? If they do these things, they are
pretty loyal. Would they buy a different brand entirely? This would indicate that the brand
“loyalty” is really just habit.
We may need to get an idea about brand switching. We might ask questions about the
previous brands they used. We would want to know how long they used that brand. We
would certainly need to find out why they switched from the previous brand to the current
one. We must get information on both that they like more about the current brand; and
what they did not like as much about the previous brand.
How did they learn about the new brand or come to try the new brand or even other
brands not their own? Was their own brand out-of-stock? Did they respond to some
special offer or promotion and decided they liked the new one better? Did they get a free
sample? Maybe friends or relatives had the brand and they tried it while with them.
Purchase patterns are important. We may need to know how often people buy the
product, as well as how much of it they buy at a time. Where do they buy it? Who
actually buys it and who made the decision on which brand? We would want to know
about the likelihood that respondents would buy at a special price. This might also be
related to how often, how much, and where they buy.
We want to know about people involved in product purchase and usage. Is the user the
same person as the purchaser? If not, who does the purchase? Who decides on what
brand, the user or the purchaser? It does not help much to advertise to husbands if the
wife makes all the decisions about what car to buy.
18
4.3.4 Demographics
Demographics should be asked for selectively, based on what we have learned from
preliminary work. Some demographics are relevant, some are not. There are endless
demographics, but about the only time we might need lots of demographics is in
segmentation studies, not usually in market studies. Demographics can be looked at one
at a time, and also in meaningful combinations, such as age within sex by education.
Typical items that may be relevant for specific studies include standards on individuals
and/or families such as:
• Age
• Sex
• Education
• Occupation
• Income (personal)
• Income (family)
• Marital status
• Number in the family
• Dwelling unit
• Geographical location (city, suburb, rural, etc.)
Typically, we may want to know about other things, such as life-cycle stage. But some of
the more complex concepts we attach to people can often more easily be estimated by
putting together basic demographic information.
15
15
Neil Holbert and Mark Speece, opcit, (p. 247-250)
19
4.4 The qualitative -- quantitative dichotomy
Once the research issues are settled, the researcher must move on to figuring out how to
get the information. This research design, the “how to get” part of the project, can be
boardly divided into qualitative and quantitative methods of getting data and information.
Qualitative and quantitative research are mutually exclusive and complementary at the
same time. They are mutually exclusive because they cannot be done at the same time,
and they are not interchangeable. But they are also complementary in that they are for
accomplishing different kinds of tasks. In many research projects, they have an order --
qualitative comes first and then quantitative. Quantitative research is made substantially
easier and more rational by having previously done the qualitative part.
Qualitative research involves discussing topics, about which we may not yet know very
much, in great detail with a few people (representative respondents from our target
population). We cannot even call these topics “questions” yet, but later we can, if we
wish, turn these discussions into questions to ask people. Such research includes
defining what we do understand well, and groping toward understanding what we do not
yet understand but need to know. Then we must organize this information and lack of
information into some clearer insight into the topic.
Quantitative research cannot proceed before we have this understanding. The term
“quantitative” itself suggests that we already understand the concepts, now we just need
to put numbers to them. Quantitative research, then, involves numbers, formulas,
computers, print-outs, and number-based decisions. This means structured ways of
asking questions so that the answers can be coded easily into numbers. It means more
respondents. The important decisions left before proceeding with this research are
mainly “how many and who”, i.e., sample size, target population, and sampling
methodology.
16
4.5 Product positioning and perceptual mapping
4.5.1 Product positioning
Positioning is not hard to understand, although achieving good positioning can be quite
difficult. Essentially, for each product category we can identify a “map” in the consumer’s
head. In the center of this “perceptual map” lies the ideal kind of product they consumer
would like. Real products are scattered around the map according to how they measure
up on the key attributes that define the map for the consumer.
The objective of positioning is to put our brand in the dominant position near the center of
this map. Skilled product positioning can even drive all the other brands to the edges of
16
Mark W. Speece, Doan T. Tuan, Luc T. Thu Huong, Practical Marketing Research In Viet
Nam -- An Integrated Marketing Perspective, Asian Institute of Technology, Bangkok,
Thailand, Unpublished 1996, (p.80 /Chapter 5)
20
the map, or even off it entirely. We want our brand to be seen as the best, the brightest,
the only sensible one.
Research on positioning usually involves presenting information about the key attributes
of several brands (including ours). Rating scales are used to measure the consumer’s
perception toward the various attributes of each brand, including our (potential) brand.
Remember, in researching positioning at this stage of the new product development
process, we are still dealing with a concept, even though we may have gone as far as to
produce finished advertising. It is easy to vary the attributes of the still imaginary product
now, but it will be difficult and expensive to vary attributes once the product is marketed
(if it ever is), the images have already been established in consumers’ minds. Now, we
can even draw up several alternative finished ads, each one emphasizing something
different. Only one version would be included in the batch of competing product ads
shown to any respondent. Then we could draw up perceptual maps for each of the
variant positionings of our product.
This makes it easy to compare how the presentation stressing different things (aroma,
sweetness, natural taste, etc.) will affect where our product fits into perceptual maps.
Which, if any, of the alternative positionings beats the competition? Which competitors
specifically does it beat, and which ones has it failed to knock out? The answers to such
questions are critical in helping the marketing manager decide best version of the new
product. After all, the “best” version of the product and of the message is crafted to gain
wide acceptance in our target market. This is not necessarily exactly the same as “best”
in a technical sense.
17
4.5.2 Perceptual mapping
One way in which managers can grasp the positioning of their brand versus competing
brands is through the study of perceptual maps. In a perceptual map, each product or
brand occupies a specific point. Products or brands that are similar lie close together,
and those that are different lie far a part. Perceptual map provides mangers with
meaningful pictures of how their products and brands compare to other products and
brands.
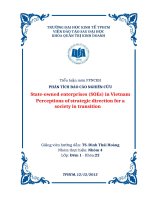
There are several ways by which perceptual maps can be created. As shown in the figure
below, they can be created by using nonattribute-based or attribute-based approaches:
17
Neil Holbert and Mark Speece, opcit, (p. 171-172)
21
Alternative Approaches To The Development Of Perceptual Maps
Similarity
Nonattribute-based
approach Preference
Perceptual maps
Attribute-based Factor analysis
approach
Discriminant analysis
The attribute-based approaches use procedures in that they rely on characteristic-by-
characteristic assessments of the various objects using, for example, Likert-tyle or
semantic differential scales. The ratings of the objects on each of the items are
subsequently analyzed using typically either factor or discriminant analysis to identify the
key dimensions that consumers use to distinguish the objects.
The nonattribute-based approaches different methods in determining how individuals
perceive the relationships among objects. Instead of asking the subject to rate objects on
the designated attributes, they ask individuals to make some summary judgments about
the similarity of objects. When making these judgment, individuals are free to use their
own characteristics. An attempt is then made to locate the objects in a multidimensional
space in which the number of dimensions corresponds to the number of characteristics
the individuals used in forming the judgments. Multidimensional scaling analysis is the
label typically used to describe the nonattribute-based approaches that use similarity
judgments to develop perceptual maps.
18
18
Gilbert A. Churchill, Jr., Marketing Research -- Methodological Foundations, 6th Edition,
The Dryden Press, 1995, (p. 490-491)
22
The advantages of the attribute-based versus the nonattribute-based approaches to
multidimensional scaling analysis are summarized in the table below
19
:
Comparison Of The Nonattribute- And Attribute-Based Approaches For
Developing Perceptual Maps
Responden
t
Technique Measures Advantages Disadvantages
Nonattribute
-based
judgment
Judged
similarity of
various
products
and/or
brands
Does not depend on a
predefined attribute set.
Allows respondents to use
their normal criteria when
judging objects. Allows for
condition that perception of
the whole may not be simply
the sum of the perceptions
of the parts.
Difficult to name dimensions.
Difficult to determine if, and
how, the judgments of
individual respondents
should be combined. Criteria
that respondents use depend
on the stimuli being
compared. Requires special
programs. Provides
oversimplified view of
perceptions when few
objects are used.
Attribute-
based
discriminant
or factor
analysis
Ratings on
various
products
and/or
brands on
prespecifie
d attributes
Facilitates naming the
dimensions. Easier to cluster
respondents into groups with
similar perceptions. Easy
and inexpensive to use.
Computer programs are
readily available.
Requires a relatively
complete set of attributes.
Rests on assumption that
overall perception of a
stimulus is made of the
individual’s reactions to the
attributes making up the
stimulus.
4.6 Product diffusion process
The diffusion process helps explain how new ideas or cultural practices spread through a
society, as well as how new products are diffused. The criticality of new product adoption
is clear, but, you might be asking, why should consumer decisions about new products
be studied any differently from decisions about other products?
The main distinction in traditional analyses of the diffusion of innovations is the emphasis
on communications within the social structure rather than individual information
processing. The relational approach analyzes communication networks and how social-
structural variables affect diffusion flows in the system, in contrast to a monodic
approach, which focuses on the personal and social characteristics of individual
consumers.
4.6.1 Diffusion variables
19
Gilbert Churchill, opcit, (p. 502)
23
The critical determinants of success for a new product have been identified in thousands
of diffusion studies. From these studies, the main elements in the diffusion of innovations
include
1. innovation (new product, service, idea, and so on)
2. communication (through certain channels)
3. time (at which certain individuals decide to adopt the product relative to others)
4. social system (interrelated people, groups, or other systems)
The results of the process show that some members of the social system are adopters --
people who have made a decision to continue using a new products. Other people who
have made decision not to adopt may occur for many reasons. Some will be exposed to
information about the product or will wait until other people have tried the product before
doing so themselves. Some consumers will quickly decide a new product is not what they
want, perhaps because of brands loyalty and satisfaction with current products. Other
consumers may want a product but may not buy it for a variety of reasons.
20
4.6.2 Products most likely to succeed
New products most likely to be adopted by consumers have some common basic
characteristics. Innovations include both a hardware and software component. Hardware
refers to the physical or tangible aspects of a product. Software is the information base
that accompanies the hardware component. A frequent mistake is spending resources on
research and development to perfect the physical attributes of the product but failing to
provide adequate resources for the software necessary for success with the product.
Understanding consumers’ values and lifestyles in developing a software may determine
success of the new product just as much as the technical R&D.
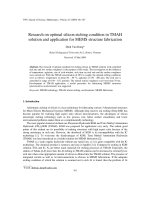
Total product concept
New products are often rejected because of failure to adopt a total product concept. The
total product concept defines the expectations of consumers about tangible and other
attributes such as delivery conditions and post-purchase service. The augmented product
includes what the customer perceives the product to do to provide more than what is
expected (and thereby provides extra “value” beyond what would be justified to pay the
price of the product). All these produce the product potential or everything potentially
feasible that will attract and hold customers. The total product concept is shown
graphically in the figure below:
20
James F. Engel, Roger D. Blackwell and Paul W. Miniard, Consumer Behavior, 8th Edition,
The Dryden Press, 1995, (p. 875-876)
24
Total Product Concept
Generic product
Expected product
Augmented product
Potential product
Note: The dots inside each ring represent specific activities or tangible attributes.
Source: Theodore Levitt, The Marketing Imagination (New York: Free Press, 1986), 79.
Why are some winners and some losers? What are some of the attributes or
expectations and augmentations of a total product? There may be five characteristics
that are associated with success with new products. They are: (1) relative advantage; (2)
compatibility; (3) complexity; (4) trialability; and (5) observability.
Relative advantage
The most important question to ask in evaluating the potential success of a new product
is, “Will it be perceived to offer substantially greater advantage than the product it
supersedes?” The issue is not whether the product is objectively better than the existing
product but whether consumers are likely to perceive a relative advantage. To what
degree will the new product be a substitute for existing ones or complementary with the
array of products already in consumers’ inventories?
Compatibility
Compatibility is an important determinant of new product acceptance. Compatibility refers
to the degree to which the product is consistent with existing values and past
experiences of the potential adopters.
Complexity
Complexity is the degree to which an innovation is perceived as difficult to understand
and use. The more complex the new product, the more difficult it will be to gain
acceptance.
25