The kindness project for schools
Bạn đang xem bản rút gọn của tài liệu. Xem và tải ngay bản đầy đủ của tài liệu tại đây (13.7 MB, 133 trang )
Report Card on American Education:
Ranking State K-12 Performance, Progress and Reform
© 2014 American Legislative Exchange Council
All rights reserved. Except as permitted under the United
States Copyright Act of 1976, no part of this publication may
be reproduced or distributed in any form or by any means
or stored in a database or retrieval system without the prior
permission of the publisher.
Published by:
American Legislative Exchange Council
2900 Crystal City Drive
Suite 600
Arlington, VA 22202
Phone: (202) 725-7764
Fax: (703) 373-0927
www.alec.org
For more information, contact
the ALEC Public Affairs office.
Dr. Matthew Ladner and David J. Myslinski
Lindsay Russell, director, Task Force on Education
ISBN: 978-0-9853779-5-3
Report Card on American Education: K-12 Performance, Progress and Reform is published by the American Legislative Exchange
Council (ALEC) as part of its mission to promote limited government, free markets and federalism. ALEC is the nation’s largest
nonpartisan, voluntary membership organization of state legislators, industry representatives, research analysts and policy
think tanks. ALEC is governed by a board of directors of state lawmakers, which is advised by the Private Enterprise Advisory
Council representing business leaders and entrepreneurs.
The American Legislative Exchange Council is a 501(c)(3) nonprofit, public policy organization. Contributions are tax-deductible.
nen
About the Authors v
Acknowledgements vi
Foreword: Mike Pence, Governor of Indiana vii
CHAPTER 1 : Educaon Reform: A Year in Review 1
North Carolina Lawmakers Go Big on K-12 Reform in 2013 2
D.C., Tennessee and Indiana See the Biggest Gains Between 2011 and 2013 NAEP 3
New Private Choice Programs and Expansions Abound in 2013 5
Course Access Programs Gain Ground 8
Special Needs Parental Choice Programs Connued to Advance in 2013 9
Lawmakers Enact Strong Improvements to Charter School Laws 10
More States Adopt “A” Through “F” School Leer Grades 12
Massive Open Online Courses Connued to Rapidly Expand in 2013 13
Taking Addional Steps in the Journey of a Thousand Miles 14
CHAPTER 2: A Decade Of Data On State Academic Achievement 17
Fourth-Grade Reading 24
Eighth-Grade Reading 27
Fourth-Grade Mathemacs 28
Eighth-Grade Mathemacs 28
States Making Progress on all Four NAEP Exams 29
Conclusion: Scaered Progress with Miles to Go 30
CHAPTER 3: Educaon Policy Grades and Academic Performance 33
Public Categories 34
Academic Standards 34
Charter Schools 34
Homeschooling Regulaon Burden Level 35
Private School Choice 35
Teacher Quality Policies 35
Digital Learning 35
Overall Policy Grade 35
Policy Grades Methodology 35
Ranking States on the Performance of General Educaon Low-Income Students 36
Addional Informaon 37
STATE SNAPSHOTS 39
CHAPTER 4: New Approaches To the Challenges Of Urban Schooling 91
State Academic Trends in Urban Schools 93
Naming District Names-District-Level NAEP Scores 95
Big News from the Big Easy 96
Charter Schools Lead the Way in District of Columbia Improvement 98
Bloomberg Era Ends in NYC with Small School Iniave Found a Success 102
Sign of the Times: Mayor Emanuel Bales Teacher Unions in the Windy City 103
Conclusion: The Clock is Ticking 104
APPENDICES 106
Appendix A: Methodology for Ranking the States 106
Appendix B: Methodology for Grading the States 108
Appendix C: Index of Figures and Tables 110
Appendix D: Model Policies for K–12 Reform 111
Appendix E: Educaon Reform Organizaons 120
www.alec.org v
DR. MATTHEW LADNER
Dr. Matthew Ladner is the senior advisor of policy and research for the Foundation for Excellence in
Education. He previously served as vice president of research at the Goldwater Institute. Prior to join-
ing Goldwater, Ladner was Director of State Projects at the Alliance for School Choice. Ladner has writ-
ten numerous studies on school choice, charter schools and special education reform, and coauthored
the Report Card on American Education: Ranking State K-12 Performance, Progress and Reform for the
American Legislative Exchange Council. Ladner has testified before Congress, the United States Com-
mission on Civil Rights and numerous state legislative committees. Ladner is a graduate of the Univer-
sity of Texas at Austin and received both a Masters and a Ph.D. in Political Science from the Universi-
ty of Houston. Ladner is a senior fellow with the Foundation for Educational Choice and the Goldwater
Institute. Ladner lives in Phoenix, Ariz., with his wife Anne and children Benjamin, Jacob and Abigail.
DAVID J. MYSLINSKI
David J. Myslinski serves as a communications specialist for the Foundation for Excellence in Education
and was the state policy director for Digital Learning Now, focusing on digital education policies across
all 50 states. Prior to joining the foundation, he served as the Education Task Force director at the Amer-
ican Legislative Exchange Council, where he focused on digital learning, K-12 education reform, and high-
er education policies on the state level. He is a coauthor of the Report Card on American Education:
Ranking State K-12 Performance, Progress and Reform for ALEC, and currently serves on the ALEC Execu-
tive Committee to the Task Force on Education and is a vice-chair of the Digital Learning Subcommittee.
Myslinski has previously worked on state policies relating to health care and telecommunications. He is
a graduate of Rutgers University.
A Ar
vi Report Card on American Education
We wish to thank the following for making this Report Card on American Education possible:
First, we thank the Allegheny Foundation and the Gleason Family Foundation for their generous sup-
port for the creation and promotion of this book.
The authors would like to specifically thank Lindsay Russell, director of the ALEC Task Force on Educa-
tion, for her tireless work and guidance in the production of this publication.
We also thank Lisa B. Nelson, Michael Bowman, Bill Meierling, Ashley Varner, Molly Fuhs, Jordan Con-
rad and the professional staff of ALEC for their assistance in all aspects of this publication.
Akwdts
www.alec.org vii
O
ur greatest obligation as policymakers is
to ensure that all of our children have ac-
cess to a quality education. Our nation’s
long-term success is dependent upon the success
of our children, whose early start in life depends
greatly on the quality of our schools. This funda-
mental truth was evident to our nation’s found-
ers. George Washington once said that a “virtu-
ous and happy people will be found in the right
education of youth.”
In this era of global competition and mobile
capital, we owe it to our children to ensure they
are prepared to succeed in a changing world. If
we fail our children in the classroom, they are
more likely to fail in life. In Indiana, we’ve taken
this lesson to heart. In our efforts to increase ac-
cess to quality schools, we enacted the most am-
bitious school choice program in the country in
2011. Last year, nearly 20,000 low-income Hoo-
siers used vouchers, or what we call Choice Schol-
arships, to attend the school of their choice—a
500 percent increase from the year before. This
year, the number of applications has grown to
nearly 30,000. In addition to the Choice Scholar-
ships, more than 35,000 Indiana students are at-
tending public charter schools across our state.
We have a strong commitment to high aca-
demic standards in Indiana that is producing real
results. In 2013, under our A-F system of school
accountability, 500 public schools improved a full
letter grade or more. Indiana’s gains on the “Na-
tion’s Report Card” were in the top five for fourth
grade reading and math, and our graduation rate
is at an all-time high. Finally, more than 86 per-
cent of Hoosier third graders passed the state
reading exam, a critical measure of future educa-
tional success.
We have also worked hard to ensure that our
students have a rich set of post-secondary edu-
cation opportunities. While anyone who wants
to go to college should be able to do so, many
high-wage, high-demand jobs do not require a
four-year college degree. With strong biparti-
san support, Indiana is making career and voca-
tional education an option for every high school
student in Indiana in order to ensure that all stu-
dents have a pathway to a career regardless of
whether they decide to go to college. We are ex-
panding curricula in our high schools and devel-
oping new partnerships with local businesses to
support career and technical education on a re-
gional basis.
Because every child should start school pre-
pared to learn, we developed a voluntary pre-K
voucher program for disadvantaged children in
Indiana. I have always believed the best pre-K
program is a family that provides the kind of en-
richment that every child deserves, but too often
rwrd
by Mike Pence, Governor of Indiana
viii Report Card on American Education
FOREWORD
low-income children need extra help. Targeted
pre-K programs can improve future education-
al outcomes for our most disadvantaged kids, es-
pecially when families can choose with a voucher
the programs that are best for their kids.
Indiana and other states have made great
progress in our efforts to give our children the
best educational options available to them. Much
remains to be done. Too many of our children are
trapped in failing schools and do not have access
to the kind of learning needed to produce with-
in them the skills necessary to develop the skills
students need to succeed in today’s challenging
economy. The Report Card on American Educa-
tion is an invaluable resource that shows where
we have been, where we are, and most impor-
tant, where we need to go from here. It is re-
quired reading for anyone who believes that we
need to make sure all of our kids get a fair shot at
the American Dream.
Sincerely,
Mike Pence
Governor of Indiana
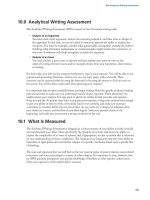
1
CHAPTER
Education Reform:
A Year in Review
2 Report Card on American Education
P
olicy advancements in recent years have
given students across America more edu-
cational options than many thought prob-
able—even as recently as five years ago. And 2013
proved to be another landmark year, as state law-
makers expanded successful reforms and ex-
plored innovative new policies that build on pri-
or educational successes. Importantly, students
are rightly at the core of lawmaker conversations.
NORTH CAROLINA LAWMAKERS GO BIG ON
K-12 REFORM IN 2013
North Carolina legislators moved the Tar Heel
State into the top ranks of education reform with
a comprehensive set of K-12 reforms. In so doing,
North Carolina became the latest in a growing
number of states to dispatch the “either/or” ap-
proach to K-12 reform. In the past, K-12 reformers
spent time debating whether to pursue a reform
strategy based upon incentives (such as parental
choice programs and merit bonuses) or instruc-
tional/transparency reforms based upon testing
and curriculum. In 2013, North Carolina lawmak-
ers wisely decided not to bother with an “either/
or” debate and instead adopted a “both/and”
multifaceted strategy to improve public schools.
They adopted “A” through “F” school grades
to describe academic performance—a crucial
step toward increasing transparency in the sys-
tem. These grades will replace a multi-measured
system detailing whether the school met mini-
mum requirements under the No Child Left Be-
hind (NCLB) Act with a grade on a universally un-
derstood scale.
As parental choice policies represent the most
basic method for improving education outcomes,
open enrollment, charter school options and pri-
vate choice options all give parents the opportu-
nity to match the individual needs of their child
with the particular strengths of a school. Every
child and every school is unique, meaning the
greater variety of schooling options available,
the more likely each child will find a school that
matches his or her needs.
North Carolina lawmakers had previously tak-
en small steps toward parental choice. In 2011,
they removed a statewide cap on the number of
charter schools, which had previously been set at
100. And in 2012, they created a personal use tax
credit for households with special education stu-
dents to cover some private school expenses.
However, North Carolina lawmakers went big
and broad in 2013, passing two school voucher
programs—one for students in low- to middle-
income families and the other for children with
special needs. Collectively, these programs make
North Carolina the top-ranked parental choice
state. Students eligible for the North Carolina Op-
portunity Scholarship program include children
previously attending a public school whose fami-
lies are below 133 percent of the income thresh-
old, qualifying them for a free or reduced-price
lunch under the National School Lunch Program.
In North Carolina, 50 percent of students qual-
ify for a free or reduced-price lunch, and another
12 percent have an Individualized Education Plan
qualifying them for special education services. Al-
though overlap exists between these two popula-
tion pools—many special education students also
qualify for free or reduced-price lunches, based
upon family income—a large majority of North
Carolina public school students will qualify for
participation.
Between these private choice programs and
improvements in the state’s charter school laws
giving parents ultimate control over their child’s
education, it is clear that bottom-up pressure for
public school improvement is on the way.
Education Reform:
A Year in Review
www.alec.org 3
EDUCATION REFORM: A YEAR IN REVIEW
North Carolina lawmakers also funded an ef-
fort to increase the number of Advanced Place-
ment and International Baccalaureate courses.
State funds will be used to encourage students
with the potential to pass college preparatory
coursework and will pay for associated testing
fees and for teacher professional development.
1
D.C., TENNESSEE AND INDIANA SEE THE BIG-
GEST GAINS BETWEEN 2011 AND 2013 NAEP
The National Assessment of Educational Prog-
ress (NAEP) released the 2013 results for fourth-
and eighth-grade mathematics and reading as-
sessments. The District of Columbia and state of
Tennessee demonstrated statistically significant
gains over the 2011 scores in all four exams. Indi-
ana had the third highest overall gains.
Arizona, Colorado, Delaware, the District of
Columbia, Indiana, Iowa, Nebraska, New York,
Tennessee, West Virginia and Wyoming saw sta-
tistically significant gains in fourth-grade mathe-
matics between 2011 and 2013. No state suffered
a statistically significant decline in fourth-grade
math scores, and the majority of states saw ef-
fectively flat scores during this period.
The District of Columbia, Florida, New Hamp-
shire, Pennsylvania and Tennessee achieved sig-
nificant gains in eighth-grade mathematics be-
tween the 2011 and 2013 NAEP exams. Montana,
Oklahoma and South Dakota, however, suffered
significant declines in eighth-grade math scores.
The vast majority of states saw no significant
change in the math performance of their eighth-
grade students.
NAEP fourth-grade reading trends between
2011 and 2013 saw a similar pattern, with juris-
dictions seeing a significant increase, outnumber-
ing states that saw significant declines by a 6-to-3
margin. Colorado, the District of Columbia, In-
diana, Iowa, Maine, Tennessee and Washington
showed gains, while Massachusetts, Montana
and North Dakota suffered significant declines.
The vast majority of states did not see a statisti-
cally significant decline or increase.
FIGURE 1 | STATES MAKING STATISTICALLY SIGNIFICANT PROGRESS ON THE NAEP FOURTH-GRADE
MATH EXAM BETWEEN 2011 AND 2013 (ALL STUDENTS)
WA
OR
CA
ID
NV
AZ
UT
WY
CO
WI
MO
AR
GA
KS
OK
MN
IN
OH
PA
SC
FL
AK
MT
ND
SD
NE
NM
TX
LA
IA
IL
MI
NY
KY
TN
MS
AL
VA
NC
ME
HI
WV
VT
NH
MA
RI
CT
NJ
DE
MD
Progress
No progress
D.C.
4 Report Card on American Education
CHAPTER ONE
NAEP eighth-grade math has proved the most
difficult subject to improve for states since 2011;
however, the District of Columbia, Florida, Hawaii,
New Hampshire, Pennsylvania and Tennessee saw
statistically significant gains in eighth-grade math
during this time. Montana, Oklahoma and South
Dakota, however, suffered significant declines in
scores.
Tennessee, the District of Columbia and Indi-
ana have all been K-12 reform leaders in recent
years. Commenting on the NAEP improvement,
Tennessee Lt. Gov. Ron Ramsey noted, “From
tenure reform to teacher evaluations to the elim-
ination of the union monopoly on collective bar-
gaining, Tennessee has led the nation in pursu-
ing ambitious reforms. Now we see the results.
Thanks go to Governor Haslam, Commission-
er Huffman and our state legislators for show-
ing remarkable resolve in the face of criticism.”
2
The District of Columbia has seen an ever-grow-
ing percentage of students attending charter
schools. In 2011, charter schools educated 41
percent of D.C. Public School (DCPS) students,
and the share continues to grow.
3
Former DCPS
Chancellor Michelle Rhee instituted a suite of ad-
ditional reforms during her tenure. D.C. NAEP
scores remain low, but one can only describe the
progress since the mid-1990s as substantial.
Indiana’s reforms under former Gov. Mitch
Daniels and Commissioner Tony Bennett likewise
ran the gamut from expanding parental choice to
embracing public school transparency through
letter grades and more. The electoral process
ended the tenure of both hard-charging reform-
ers Rhee and Bennett (Rhee indirectly through
the Washington, D.C. mayoral election; Bennett
through the direct election of the Indiana Super-
intendent of Public Instruction). Both, however,
seem likely to regard academic improvement as
a far greater reward than staying in office quietly
presiding over more of the same.
The 2013 NAEP also marks the end of the first
decade in which all 50 states and the District of
Columbia participated in NAEP testing, which
FIGURE 2 | STATES MAKING STATISTICALLY SIGNIFICANT PROGRESS OR DECLINES ON THE NAEP
EIGHTH-GRADE MATH EXAM BETWEEN 2011 AND 2013(ALL STUDENTS)
Declines
Progress
No progress
WA
OR
CA
ID
NV
AZ
UT
WY
CO
WI
MO
AR
GA
KS
OK
MN
IN
OH
PA
SC
FL
AK
MT
ND
SD
NE
NM
TX
LA
IA
IL
MI
NY
KY
TN
MS
AL
VA
NC
ME
HI
WV
VT
NH
MA
RI
CT
NJ
DE
MD
D.C.
www.alec.org 5
EDUCATION REFORM: A YEAR IN REVIEW
FIGURE 3 | STATES MAKING STATISTICALLY SIGNIFICANT PROGRESS OR DECLINES ON THE NAEP
FOURTHGRADE READING EXAM BETWEEN 2011 AND 2013ALL STUDENTS
WA
OR
CA
ID
NV
AZ
UT
WY
CO
WI
MO
AR
GA
KS
OK
MN
IN
OH
PA
SC
FL
AK
MT
ND
SD
NE
NM
TX
LA
IA
IL
MI
NY
KY
TN
MS
AL
VA
NC
ME
HI
WV
VT
NH
MA
RI
CT
NJ
DE
MD
DC
Declines
Progress
No progress
D.C.
allows a long-term look at progress. Education
improvement tends to be slow and steady in the
best of circumstances, making a longer term view
of progress more valuable than a two-year snap-
shot, such as comparing 2013 NAEP scores with
those in 2011. Chapter 2 of this book will focus on
this decade in academic progress (or lack there-
of) for all states.
NEW PRIVATE CHOICE PROGRAMS AND EXPAN-
SIONS ABOUND IN 2013
The 18th edition of the Report Card on American
Education included the story of Greg Forster bet-
ting The Washington Post columnist Jay Mathews
dinner over whether state lawmakers would pass
seven or more new or expanded private choice
programs. Forster nearly tripled up on the mini-
mum requirement in 2011 and easily passed the
hurdle again in another blockbuster year for pri-
vate school choice in 2012. The Report Card pro-
poses to use this wager as the unofficial stan-
dard of having a great year in the parental choice
movement. Lawmakers easily exceeded that
standard yet again in 2013.
Alabama and South Carolina lawmakers
joined the parental choice movement for the first
time in 2013. The Alabama Legislature surprised
everyone by passing the Alabama Accountability
Act, which included two private choice programs.
The Alabama Accountability Act Tax Credit/Re-
bate will provide a tax credit or rebate to par-
ents transferring their child from a failing public
school to a school of their choice. In addition, the
act’s School Choice Scholarships Program creates
a $25 million scholarship tax credit for taxpay-
ers to further aid children attending failing pub-
lic schools.
Georgia and Iowa lawmakers increased the
statewide caps on their scholarship tax credits
by $8 million and $3.25 million, respectively. In-
diana lawmakers expanded the eligibility for the
Hoosier State’s scholarship tax credit to students
attending private schools, if they fall below 200
percent of the eligibility needed to qualify for the
6 Report Card on American Education
CHAPTER ONE
FIGURE 4 | STATES MAKING STATISTICALLY SIGNIFICANT PROGRESS ON THE NAEP EIGHTH-GRADE
READING EXAM BETWEEN 2011 AND 2013(ALL STUDENTS)
WA
OR
CA
ID
NV
AZ
UT
WY
CO
WI
MO
AR
GA
KS
OK
MN
IN
OH
PA
SC
FL
AK
MT
ND
SD
NE
NM
TX
LA
IA
IL
MI
NY
KY
TN
MS
AL
VA
NC
ME
HI
WV
VT
NH
MA
RI
CT
NJ
DE
MD
DC
DC
Progress
No progress
D.C.
National School Lunch Program’s free or reduced-
price lunches. Indiana lawmakers also expanded
the eligibility for their broad voucher program and
increased the maximum size of the scholarship.
Arizona legislators expanded and improved
the Arizona Empowerment Scholarship Account
(ESA) Program—the first education savings ac-
count program in the nation. Education savings
accounts represent the 21st century update to
choice programs. The nation’s first pilot ESA pro-
gram has entered its third year of operation in
Arizona, and it allows parents to control an ac-
count that can be used for private school tuition,
à la carte courses from public school certified pri-
vate tutors, licensed therapists, online education
programs and college or university tuition. If they
choose, parents may place a limited amount of
ESA funds into a Coverdell Education Savings Ac-
count to accumulate interest for the child’s fu-
ture higher-education expenses. Parents are in
charge—down to the last penny—and the model
encourages parents to consider both quality and
cost when choosing among providers.
In 2013, Arizona lawmakers expanded the
program’s eligibility to kindergarten students
otherwise eligible to participate, such as stu-
dents with special needs, those attending a “D”
or “F” rated public school, those in foster care,
or dependents of active duty military members.
Arizona lawmakers also enacted critical program
design improvements by increasing the fiscal
oversight of accounts and increasing the funding
for accounts.
Ohio lawmakers expanded the EdChoice
Scholarship Program to make $4,250 scholar-
ships available statewide to children in families
below 200 percent of the federal poverty lev-
el. Program eligibility started with kindergarten
students, and a subsequent grade will be eligi-
ble each year for the next 12 years (kindergarten
only the first year kindergarten and first grade
the second year and so forth).
www.alec.org 7
EDUCATION REFORM: A YEAR IN REVIEW
TABLE 1 | STATES MAKING STATISTICALLY SIGNIFICANT PROGRESS OR DECLINES ON THE NAEP
EXAMS BETWEEN 2011 AND 2013ALL STUDENTS
Fourth-Grade
Math
Eighth-Grade
Math
Fourth-Grade
Reading
Eighth-Grade
Reading
Alabama
Alaska
Arizona
Arkansas
California
Colorado
Connecticut
Delaware
District of Columbia
Florida
Georgia
Hawaii
Idaho
Illinois
Indiana
Iowa
Kansas
Kentucky
Louisiana
Maine
Maryland
Massachusetts
Michigan
Minnesota
Mississippi
Missouri
Montana
Nebraska
Nevada
New Hampshire
New Jersey
New Mexico
New York
North Carolina
North Dakota
Ohio
Oklahoma
Oregon
Pennsylvania
Rhode Island
South Carolina
South Dakota
Tennessee
Texas
Utah
Vermont
Virginia
Washington
West Virginia
Wisconsin
Wyoming
8 Report Card on American Education
CHAPTER ONE
FIGURE 5 | STATES WITH PRIVATE CHOICE PROGRAMS
WA
OR
CA
ID
NV
AZ
UT
WY
CO
WI
MO
AR
GA
KS
OK
MN
IN
OH
PA
SC
FL
AK
MT
ND
SD
NE
NM
TX
LA
IA
IL
MI
NY
KY
TN
MS
AL
VA
NC
ME
HI
WV
VT
NH
MA
RI
CT
NJ
DE
MD
DC
DC
DC
D.C.
States with New or Expanded Programs in 2013
States with Exisng Private Choice Programs in 2013
Douglas County
Wisconsin lawmakers created a new state-
wide voucher program for children who qualify
for the National School Lunch Program. Program
participation is capped at 500 students in the
first year and 1,000 students thereafter. Wiscon-
sin lawmakers also created new tax deductions
for private school expenses.
COURSE ACCESS PROGRAMS GAIN GROUND
Advances in digital learning have created the op-
portunity for students to reach a near limitless
catalogue of courses. An innovative approach
currently in states such as Louisiana and Utah
allows students—regardless of school—to take
part in publicly funded digital learning as a part
of their school day. This allows students in pub-
lic district schools, public charter schools and—
in some cases—students in homeschools to re-
main in their school while enrolling in alternative
course options.
This is a particularly important policy for rural
districts, schools facing difficulty in finding quali-
fied teachers or schools that can’t justify hiring a
qualified teacher for a course with only a few stu-
dents. In 2013, Texas lawmakers created a course
access program that will soon reach 2.5 million
students. Michigan and Wisconsin also set in mo-
tion their course access programs, helping to cre-
ate a national network of high-quality options for
students beyond traditional school walls.
Lawmakers interested in this policy should
examine the ALEC Course Choice Program Act,
which features best practices from multiple states
that have enacted course access legislation. An
important aspect of this policy is annual parental
notification. Choices are only beneficial when par-
ents and students know those choices are avail-
able to them. Requiring annual reporting to the
legislature is also an important check on the pro-
gram to ensure students’ needs are being met.
www.alec.org 9
EDUCATION REFORM: A YEAR IN REVIEW
FIGURE 6 | STATES WITH PRIVATE CHOICE PROGRAMS FOR CHILDREN WITH DISABILITIES
WA
OR
CA
ID
NV
AZ
UT
WY
CO
WI
MO
AR
GA
KS
OK
MN
IN
OH
PA
SC
FL
AK
MT
ND
SD
NE
NM
TX
LA
IA
IL
MI
NY
KY
TN
MS
AL
VA
NC
ME
HI
WV
VT
NH
MA
RI
CT
NJ
DE
MD
D.C.
States with New or Expanded Programs in 2013
States with Exisng Private Choice Programs in 2013
SPECIAL NEEDS PARENTAL CHOICE PROGRAMS
CONTINUED TO ADVANCE IN 2013
The case for parental choice for children with dis-
abilities is especially powerful. District lobbyists
have claimed for decades that state funding for
special needs children does not cover their costs.
Taking them at their word regarding their need
to shift funds out of general education and into
special education, these individuals have no ba-
sis for complaint if a special needs child leaves
with their state funding; they can either shift less
money or spend more on their remaining special
needs children.
More important still, federal law allows par-
ents to sue districts for failure to provide a “free
and appropriate education,” and these suits
sometimes result in large judgments against dis-
tricts. Nationwide, 2 percent of special needs
children attend private schools at district ex-
pense—but they tend to be the children of
wealthy parents who can access highly specialized
attorney services. Choice programs short-circuit
the need for lawsuits by allowing dissatisfied par-
ents to depart if they feel the need.
Florida lawmakers created the first such law,
the McKay Scholarship Program, in 1999. Since
then, 10 states have followed suit, and lawmakers
continued to create and improve private choice
programs for children with disabilities in 2013.
For example, South Carolina lawmakers created
a scholarship tax credit program for children with
disabilities. Not to be outdone, North Carolina
legislators replaced a personal use tax credit for
children with disabilities with a school voucher
program for special needs children to accompany
their broader program for low-income children.
Utah lawmakers created an important fund-
ing formula for the Carson Smith Special Needs
Scholarship. The program was previously fund-
ed by appropriations, which had routinely re-
quired lotteries for program admission. Mean-
while, Mississippi lawmakers created the Nate
10 Report Card on American Education
CHAPTER ONE
FIGURE 7 | STATES MAKING 10-POINT OR GREATER GAINS ON THE STRENGTH OF THEIR CHARTER
SCHOOL LAW BETWEEN 2010 AND 2013
WA
OR
CA
ID
NV
AZ
UT
WY
CO
WI
MO
AR
GA
KS
OK
MN
IN
OH
PA
SC
FL
AK
MT
ND
SD
NE
NM
TX
LA
IA
IL
MI
NY
KY
TN
MS
AL
VA
NC
ME
HI
WV
VT
NH
MA
RI
CT
NJ
DE
MD
DC
DC
DC
D.C.
20 points or greater gain
10 points or greater gain
Rogers Scholarship for Children with Disabilities
Program for children with speech and language
impairments.
Lawmakers in Utah’s southern neighbor sub-
stantially improved the Arizona Empowerment
Scholarship Account program. The changes to the
program will make participation easier for both
special needs and other eligible children. Indi-
ana lawmakers, meanwhile, expanded eligibility
for their voucher program to include all children
with disabilities.
4
The ALEC Task Force on Education has devel-
oped both model voucher and education savings
account policies for study by those interested in
improving the opportunities for the most deserv-
ing and often poorly served students.
LAWMAKERS ENACT STRONG IMPROVEMENTS
TO CHARTER SCHOOL LAWS
The National Alliance for Public Charter Schools
(NAPCS) conducted a study of the changes in
charter school laws across the country between
the years 2010 and 2013. Using their metrics re-
garding the key elements of solid charter school
legislation, they summarized their findings as:
• Thirty-ve states have made policy improve-
ments that resulted in increases in their
scores. Only Pennsylvania scored lower in
2013 than in 2010.
• Seven of these 35 states “essenally over-
hauled” their charter school laws (dened as
an increase in scores by 20 points or more).
These include Colorado, Hawaii, Indiana, Lou-
isiana, New Mexico, Rhode Island and South
Carolina.
• Ten of these 35 states made “notable improve-
ments” (dened as an increase in their scores
of 10 to 19 points). These include Florida, Illi-
nois, Massachuses, Michigan, Missouri,
Nevada, New Jersey, New York, North Caro-
lina and Ohio.
• Eighteen of these 35 states made moderate
www.alec.org 11
EDUCATION REFORM: A YEAR IN REVIEW
TABLE 2 | YEARBYYEAR SCORES FOR STATE CHARTER SCHOOL LAWS 20102013
(SOURCE: NATIONAL ALLIANCE FOR PUBLIC CHARTER SCHOOLS)
State 2010 2011 2012 2013 Point Change
Alaska 56 62 62 63 7
Arizona 136 133 133 141 5
Arkansas 116 116 122 122 6
California 150 150 150 150 0
Colorado 138 142 142 160 22
Connecticut 106 106 106 110 4
Delaware 121 121 127 127 6
District of Columbia 132 132 132 134 2
Florida 133 147 151 151 18
Georgia 134 134 125 135 1
Hawaii 75 82 82 139 64
Idaho 104 104 101 110 6
Illinois 100 100 117 117 17
Indiana 112 112 148 148 36
Iowa 62 71 71 71 9
Kansas 63 63 63 63 0
Louisiana 128 132 128 151 23
Maine - - 163 166 3
Maryland 42 42 42 42 0
Massachusetts 135 148 148 145 10
Michigan 122 122 138 138 16
Minnesota 168 172 172 172 4
Mississippi - 39 39 39 0
Missouri 119 119 119 132 13
Nevada 109 109 126 126 17
New Hampshire 111 114 120 113 2
New Jersey 104 104 104 114 10
New Mexico 117 117 147 147 30
New York 134 148 148 148 14
North Carolina 107 107 122 125 18
Ohio 106 106 113 117 11
Oklahoma 101 106 106 109 8
Oregon 116 116 120 120 4
Pennsylvania 134 131 131 131 -3
Rhode Island 71 74 108 108 37
South Carolina 117 117 117 141 24
Tennessee 101 101 109 109 8
Texas 120 120 124 124 4
Utah 127 127 127 131 4
Virginia 65 69 69 69 4
Washington - - - 161 N/A
Wisconsin 77 77 77 77 0
Wyoming 87 87 87 87 0
improvements, with changes resulng in an
increase in scores anywhere from one to nine
points. These include Alaska, Arizona, Arkan-
sas, Conneccut, Delaware, District of Colum-
bia, Georgia, Idaho, Iowa, Maine, Minnesota,
New Hampshire, Oklahoma, Oregon, Tennes-
see, Texas, Utah and Virginia.
• The scores for six states remained the same.
These include California, Kansas, Maryland,
Mississippi, Wisconsin and Wyoming.
12 Report Card on American Education
CHAPTER ONE
FIGURE 8 | JURISDICTIONS ADOPTING “A” THROUGH “F” LETTER GRADES FOR SCHOOL
TRANSPARENCY
WA
OR
CA
ID
NV
AZ
UT
WY
CO
WI
MO
AR
GA
KS
OK
MN
IN
OH
PA
SC
FL
AK
MT
ND
SD
NE
NM
TX
LA
IA
IL
MI
NY
KY
TN
MS
AL
VA
NC
ME
HI
WV
VT
NH
MA
RI
CT
NJ
DE
MD
D.C.
“A” through “F” Leer Grades
• Three states have enacted brand new legis-
laon. Two of them—Maine and Washing-
ton—enacted laws relavely well aligned
with NAPCS’ model law. Mississippi, on the
other hand, passed a weak law but strength-
ened it in 2013, which was not reected in the
rankings.
5
Table 2 shows the year-by-year scores for
charter schools in each state. Maine came in
strong with new legislation in 2012, which they
improved in 2013, resulting in the second-high-
est ranked law in the nation. Hawaii delivers the
biggest point gain in the ranking with a huge
improvement to their legislation in 2013. No-
tice also that new kids on the block—Maine and
Washington—now have charter school laws rat-
ed higher than either Arizona or Florida, accord-
ing to NAPCS criteria.
The Report Card on American Education es-
pecially wants to congratulate charter school ad-
vocates in Maine and Washington, not only for
adopting charter school laws, but for adopting
strong charter school laws. The Maine and Wash-
ington laws are not only among the highest rat-
ed by the NAPCS criteria, they rank ahead of such
strong charter states as Arizona and Florida.
Charter advocates obviously had the right
idea: Go big or go home.
Meanwhile, Alabama, Kentucky, Montana,
Nebraska, North Dakota, South Dakota, West Vir-
ginia and Vermont still have yet to pass a charter
school law.
MORE STATES ADOPT “A” THROUGH “F”
SCHOOL LETTER GRADES
Policymakers continued to adopt easily under-
stood letter grades to describe public school ac-
ademic performance in 2013. Rating schools “A”
through “F” began in Florida in 1999 and repre-
sented tough medicine: The state called out un-
derperforming schools in a way that everyone
could instantly grasp. In Florida, state officials
www.alec.org 13
EDUCATION REFORM: A YEAR IN REVIEW
post school- and district- level information about
performance and grades on the Internet, and
schools are required to send a school report
card to parents. Tough love is still love: Florida’s
schools began a steady process of improvement,
both on the Florida Comprehensive Assessment
Test and on NAEP (a source of external validation
for the state exam).
The practice of grading schools had many crit-
ics in 1999, and some remain today, despite Flor-
ida’s strong improvement. Far from withering un-
der the glare of public shame, Floridians rolled
up their sleeves and began the hard work of im-
proving their underperforming schools. Schools
focused their resources on improving academ-
ic achievement. Alerted to the problems in their
schools, communities rallied to the aid of low-
performing schools. Thousands of Floridians vol-
unteered their time to tutor struggling students.
Improving academic performance—and thus the
school’s grade—became a focus.
New York City became the second jurisdiction
to adopt school letter grades at the district level.
After New York, a growing number of states—in-
cluding Arizona, Indiana, Louisiana, New Mexico,
Oklahoma and Utah—adopted the “A” through
“F” grading practice. More recently, a growing
number of Atlantic Coast, Midwest and South-
ern states adopted school letter grades—includ-
ing Alabama, Arkansas, Ohio, Maine, Mississippi,
North Carolina, South Carolina and Virginia.
Few of these states have released multiple
years of letter grades, and fewer still have put let-
ter grades in place as a part of a broad compre-
hensive set of reforms designed to improve pub-
lic education. Indiana is one of those few states,
and their gains on the 2013 NAEP proved quite
impressive (see Chapter 2). Some states, such
as Utah, saw years pass between the time law-
makers passed “A” through “F” letter grades and
when the Department of Education (grudgingly,
in the case of Utah education officials) released
the first set of grades to the public.
A number of states adopted their “A” through
“F” policies as part of negotiating a waiver from
NCLB, and others adopted the policy through leg-
islation. School grading policies are not monolith-
ic in nature. For instance, some heavily factor in
student academic growth, while other states’ pol-
icies, such as Louisiana’s, do not. Florida began
with more schools earning “D” and “F” grades
than “A” and “B” grades and then watched that
trend reverse itself over the years, despite rais-
ing standards multiple times. Arizona, on the oth-
er hand, began with a majority of schools earning
“A” and “B” from the outset.
Over time, the variation in these school grad-
ing details may increase our knowledge of how
best to fashion a system in order to nudge a fast-
er improvement rate for public schools.
MASSIVE OPEN ONLINE COURSES CONTINUED
TO RAPIDLY EXPAND IN 2013
Stanford professor Sebastian Thrun created the
first Massive Open Online Course (MOOC) in
2011, and the pace of expansion has yet to abate.
The short period since 2011 has already featured
an explosion in the number of courses, partici-
pating universities and MOOC online platforms.
While primarily a higher education phenom-
enon, the availability of free online courses from
some of the finest universities in the world has
already moved into the K-12 arena. “K-12 educa-
tors are currently exploring the use of open con-
tent, learning analytics, competency-based ed-
ucation and personalized instruction, which all
point to the role that MOOCs can and will play
for learners,” Leslie Conery, interim chief educa-
tion officer at International Society for Technol-
ogy in Education, noted. “These trends will con-
tinue to grow and become more prevalent as the
cost of technology continues to decline and ac-
cess to both devices and connectivity continues
to increase. MOOCs present schools with a great
way to supplement and enhance their current
curriculum.”
6
A growing number of providers have been
creating MOOCs aimed specifically at high school
students. During the 2013 legislative session,
Florida lawmakers authorized MOOCs in high
school subjects with end-of-course exams now
offered for Algebra I and Geometry. The legis-
lation grants high school credit for MOOCs with
proctored end-of-course exams by 2015-2016. In
the meantime, a variety of university and univer-
sity/district partnerships have continued to de-
velop high-school MOOCs.
7
Dhawal Shah, a software engineer and found-
er of Class Central, a free online aggregator of
online educational offerings, has endeavored to
14 Report Card on American Education
CHAPTER ONE
keep track of the rapidly expanding MOOC uni-
verse. This is no easy task. In late 2013 he pro-
vided the following summary of the MOOC
phenomenon:
200+ universities. 1,200+ courses. 1,300+
instructors. 10 million students.
One cannot help but to suspect that this sum-
mary went out of date moments after Shah typed
it. He predicts an increasing number of universi-
ties will grant college credit for MOOCs, a grow-
ing number of MOOCs created by corporations
will emerge for employee training and new cours-
es will make use of open platform software in
2014 at an even faster pace.
8
The MOOC revolution remains young and
wild, and the full implications for the K-12 system
remain unclear. Harvard, Stanford and dozens of
other universities have put classes online at costs
varying between free and negligible. Innovators
have developed solutions to grant college cred-
it when students pass third-party proctored final
exams. Much work lies ahead in reformatting our
systems of education to incorporate these new
developments while keeping the crucial human
touch in education. While the future impact of
technology on education remains unclear, we can
say the following with certainty: We live in an age
of wonders.
TAKING ADDITIONAL STEPS IN THE JOURNEY OF
A THOUSAND MILES
The K-12 reform movement has had more to cel-
ebrate in the past three years than in any recent
period. It is important to recognize, however, that
even these incredibly hard fought victories repre-
sent only the first small steps on a long journey
of transforming a public education system that
fails to serve the needs of far too many. Amer-
icans can and should, in part, judge schools by
how much they give to children who are starting
in life with the least.
Most American poor children still go to
schools in states with weak transparency sys-
tems that use fuzzy labels to obscure academic
failure. Most low-income students have little to
no meaningful choice over what schools they at-
tend. Most poor children attend schools that so-
cially promote them year after year, regardless of
their ability to read or do grade-level work. Poor
children attend public schools that do too little to
attract highly effective teachers or remove inef-
fective teachers from the classroom.
Many defenders of the education status quo
blame poverty itself for the children’s plight.
These detractors continually ignore the fact that
today’s students often have parents, grandpar-
ents, great-grandparents and others who them-
selves attended public schools. The assignment
of our public school system in helping to break
this cycle of poverty involves the imparting of ac-
ademic knowledge and skills that are vital to the
future success of children. The past failure of
the public school system to perform this crucial
task does indeed make it more difficult to per-
form in the present. The current public school
system spends and employs people at levels that
would stagger the imagination of an American
school administrator in decades past, and which
inspires envy among the vast majority of school
systems around the globe. If the current system
cannot get this task done under these fortuitous
circumstances, we need to update our system.
The only part of this process that is finished is the
beginning.
www.alec.org 15
EDUCATION REFORM: A YEAR IN REVIEW
ENDNOTES
1. Similar eorts were undertaken in Florida, and since their onset, the number of black and Hispanic students passing
Advanced Placement exams has more than quadrupled.
2. Humphrey, Tom. 2013. “Haslam, Human Trumpet Historic Gains on Naonal Report Card.” Available on the Internet at
hp://knoxblogs.com/humphreyhill/2013/11/07/haslam-human-trumpet-historic-gains-naonal-report-card-brede-
sen-hand/.
3. Naonal Alliance of Public Charter Schools. 2012. “A Growing Movement: America’s Largest Charter School Communi-
es.” Available on the Internet at hp://publiccharters.org/data/les/Publicaon_docs/NAPCS%202012%20Market%20
Share%20Report_20121113T125312.pdf.
4. Friedman Foundaon for Educaonal Choice. 2013. “The School Choice Advocate: A Spike in School Choice.” Publicaon
of the Friedman Foundaon for Educaonal Choice, available on the Internet at hp://www.edchoice.org/CMSModules/
EdChoice/FileLibrary/1010/A-Spike-in-School-Choice.pdf.
5. Ziebarth, Todd and Louann Bierlein. 2013. “Assessing the Increasing Strength of Charter Laws Between 2010 and 2013.”
Publicaon of the Naonal Alliance of Public Charter Schools, page 3. Available on the Internet at hp://www.public-
charters.org/data/les/Publicaon_docs/Charter%20School%20Law%20Strength_20130730T113930.pdf.
6. Jackson, Nancy Mann. 2013. “MOOCs go to K12: Higher ed trend expands to high schools: Among the most obvious ways
that MOOCs can benet high school students is by oering courses that would not normally be available.” Arcle in Dis-
trict Administraon, available on the Internet at hp://www.districtadministraon.com/arcle/moocs-go-k12-higher-
ed-trend-expands-high-schools.
7. Ackerman, Sherri. 2013. “High school students try out MOOCs.” Arcle on RedenED, available on the Internet at hp://
www.redenedonline.org/2013/12/high-school-students-try-out-moocs/.
8. Shah, Dhawal. 2013. “MOOCs in 2013: Breaking Down the Numbers.” Arcle on EdSurge, available on the Internet at
hps://www.edsurge.com/n/2013-12-22-moocs-in-2013-breaking-down-the-numbers.
16 Report Card on American Education
CHAPTER ONE
2
CHAPTER
A Decade Of Data On State
Academic Achievement