Unequal Regional Development in Rural Vietnam Sources of Spatial Disparities and Policy Considerations
Bạn đang xem bản rút gọn của tài liệu. Xem và tải ngay bản đầy đủ của tài liệu tại đây (901.16 KB, 11 trang )
325
Journal of Economics and Behavioral Studies
Vol. 5, No. 6, pp. 325-335, June 2013 (ISSN: 2220-6140)
Unequal Regional Development in Rural Vietnam: Sources of Spatial Disparities and
Policy Considerations
*
Hoang Van Long,
Mitsuyasu Yabe
Kyushu University, Hakozaki, Japan
*
Abstract: In Vietnam, the poor have long been assumed to be the ethnic minorities mostly living in the
highlands. After more than two decades of introducing Doi moi
1
policy into the economy, along with
having enjoyed various improvements in social and economic aspects, the disparities between the
majority and ethnic majorities, the lowlands and the highlands, and between regions, still have been
widened. This paper aims at examining sources of spatial disparities in rural areas, and exploring the
current situation of regional economic development using both development policy review and
econometrics approaches. Data from Vietnam Household Living Standard Survey (VHLSS) 2008 was used
in the study. The expenditure per capita was employed as the dependent variable to regress with
household characteristics and resources in order to obtain the effecting factors. In addition, the regional
dummy variables were employed to show the effects from different geographic locations. The results
showed that the household characteristics and resources such as education level, perennial land area,
water surface area, and the accessibility to infrastructure facilities such as road, electricity and local
market had positive effect on the expenditure. Furthermore, the North Central Coastal region showed
negative impact on household expenditure. Interestingly, this finding does not absolutely follow the
hypothesis and indicates that the economic development strategy and polices should be adjusted to
decrease the gap among regions based on their economic advantages for balancing the economic situation
of the whole country in the future.
Keywords: Development Policies, Rural Infrastructures, Rural Poverty, Rural Development, Vietnam
1. Introduction
In Rural Vietnam, the poor have long been assumed to be the ethnic minorities mostly living in the
highlands. The economic development in Vietnam after the introduction of Doi moi
2
resulted in a
significant reduction in the poverty rate from 58% in 1993 to 14% in 2008 (Vietnamplus, 2009), and an
annual growth rate of above 7% a year between 1990 and 2008. Vietnam was set to join the
middle-income countries in 2011 (Vandermoortele & Bird, 2010). However, inequalities between the rich
and the poor, the lowlands and the highlands, the rural and the urban, as well as the ethnic lines or among
difference regions have been a serious concern among policy makers (Epprecht, Müller, & Minot, 2009;
Vandermoortele & Bird, 2010; Walle & Gunewardena, 2001), especially in the rural areas where 75% of
population were living and tend to be poorer compare the urban ones. These gaps arise from the
differences of culture, language, custom, and the ability to access credit and technology. The difference
between ethnic minorities is also considered as a dimension for equality (Heltberg, 2003; Walle &
Gunewardena, 2001). Understanding the dimensions of income disparity is useful to evaluate the
effectiveness of policy in poverty reduction and economic development. The issue of unequal regional
development has been a concern in other publications such as Hodgson (2007). Furthermore, the
concerns of policies for the next stage of economic development should focus on the geographic location
rather than targeting the poor. Therefore, finding of the low-income regions and addressing their
determinant factors have an important implication for rural and economic development policy and
strategy.
The objectives of this paper are to examine the income disparity and unequal regional economic
development in rural Vietnam. This study, however, differs from other previous researches in some
aspects. First, it uses the regression-based approach rather than Gini coefficient or other indices to
measure disparity level. Using regression-based approach can explain the contribution of difference
1
Doi Moi is the economic renovation policy started in 1986
2
Doi Moi is economic renovation policy program started in Vietnam in1986
326
factors to the disparity level. Secondly, using both development policy review and micro-econometric
approach can fully understand the reason of disparities from different points of view in the rural economy.
Third, the model employed the regional dummy variables to differentiate this region to others in terms of
living standard. Finally, this paper will to explore the devolution of inequality dimensions in the rural
areas compared to other research in the past.
The research questions are (1) how the disparity dimensions changes after the more than two decades of
economic renovation and (2) which policies can intervene or harmonize the disparities in the rural
economy. This paper is organized into five sections. After the introduction, the related literature review of
inequality measures including the review of development policies are presented in the second section.
The third section discusses the methodology with the econometric specification, the detail descriptions of
the dataset, and explanatory variables. Results and discussions are presented in the fourth section. The
conclusions and policy implications are found the fifth section.
2. Literature Review
Income Inequality Measures: Income inequality in the paper refers to “economic inequality” between
groups in population. There are many methods the measure inequality in the literature. Popular measure
of income inequality is the Gini coefficients. This ranges the income inequality for 0 to 1, which 0 is the
perfect equality and 1 is the perfect income inequality. Other measures are Theils T and Theils L, which
allow decomposing the income inequality into parts such as rural and urban areas. Atkinson’s class of
income inequality is more general and it sometime be used (Haughton & Khandker, 2009). With the about
measures of income inequality have the advantage that they do know to show the effecting factors to the
income inequality level. In this paper, the authors will discuss more on the regression-based approach to
explain the factors of income inequality by employing development policy review and an econometric
regression model.
Regression-based Approach: Income inequality can be measured by the differences of income or
expenditure per capita. It is linked with skill, education, opportunities, happiness, health, life expectancy,
welfare, assets and social mobility (Heshmati, 2004). The studies of income inequality have been
conducted for more than the past three decades. This section examines the progress of income inequality
on household studies, with special attention given to income inequality indices and regression-based
composition approach. Shorrocks (1980, 1982) decomposed income inequality by income sources and
population subgroups. He mentioned “the quantitative significance of income variations associated with
age, sex, race, occupation, the level of education, and so on”. He argued that income is contributed by
different sources, and that income inequality can be analyzed by the variances of these sources. Oaxaca
(1973) and Blinder (1973) developed the regression-based method for measuring income inequality.
They used this method to measure inequality of wage in labor economics. They employed variables
known as “individual characteristics” in their regression, and separated their models into two groups to
quantify the inequality of wage income. Their model tried to make an explanation for the reason of
“whites earn much higher wages than blacks and males earn substantially higher wages than females”.
“Discrimination coefficient” was mentioned by both of the authors to explain why the differential wages
exist in case of other “characteristics” do not change (Blinder, 1973; Oaxaca, 1973), and (Adger, 1999).
Fields & Yoo (2000) and Fields (2003) further developed the method by using income generating
equation to “account for” or “decompose” inequality in a country and its change over time. Gunderson
((1989) identified the discrimination of wages between male and female. In defining the gap of wages, he
proposed some methods such as narrowing defined occupation and regression wage decomposition. He
applied the regression that breaks down wage differentials by the difference of “characteristics” and
“structure” between male and female. Pracharopoulos and Patrinos (1994) attempted to identify the
ethnic discrimination in Latin American countries where almost all of the populations are indigenous
peoples. They used multivariate regression analysis method popularized by Oaxaca (1973) and Blinder
(1973). Their study concluded that indigenous people are poor, illiterate, and prone to health problems
and disadvantage in earning. They also explained that less education is strongly correlated to poverty.
Interestingly, their statistical results showed that much of earnings differential between indigenous and
non-indigenous workers would disappear by equalizing human capital characteristics. They finally
proposed that a further research should “combine the quantitative approach taken with qualitative
analysis, such as the participatory-observation research approach (or participatory poverty assessment)”.
Without this qualitative data, probable reasons for the discrepancy, including race, access to training, and
327
cultural values, are merely speculative. Recently, Wan (2004) conducted a research on income inequality
in China by employing the regression of household income and the effecting factors. His paper reviewed
the methods of income inequality measurement, and the advances of regression approach. He applied the
regression-based approach from Morduch & Sicular (2002) and Fields & Yoo (2000) instead of the
traditional method. His empirical analysis resulted in using both conventional and regression approaches
in measuring income inequality.
Vietnam’s footprints on inequality measures: In Vietnam, Walle & Gunewardena (2001) have first
applied the Blinder-Oaxaca approach in measuring the sources of inequality among the majority and
ethnic minority groups. The model was modified to the situation of Vietnam by adding “geographic affects”
to their composition for two reasons. First, in the Vietnamese economy, one important characteristic
determining living standards is where people live. Second, omitting “geographic effects” could severely
bias estimates of the return to non-geographic characteristics. They concluded that household income
was strongly affected by location, education, and land. They recommended for the separation of the Kinh
majority model of economic earnings with other ethnic minority groups in order to fight poverty. Heltberg
(2003) has also applied the regression-based composition approach developed by Oaxaca (1973) and
Blinder (1973) in measuring spatial inequality in Vietnam. He employed household characteristics and
sub-group indicators variables to regress log of expenditures against these variables. The data were
extracted from VLSS in 1992/93 and in 1997/98. In addition, he concluded that higher education is also
important for income disparity. Besides, the growing income disparity during Vietnam’s reform period
appeared to be caused by rising spatial income disparity as well as growing returns to higher education.
Policy should strive to create the conditions for more equal returns to location. Adger (1999) argued that
“income disparity is important source because of its relationship to other factors in the evolution of the
agriculture economy such as the incidence of poverty and the sustainability of emerging income sources”.
Recently, Epprecht, et al. (2009) used the VHLSS 1999 to investigate the remoteness of rural poverty in
Vietnam. They concluded that rural poverty significantly increases with the geographic remoteness
regardless to ethnicity and education. In addition, the local infrastructures such as local markets, health
care facilities and schools are important for poverty reduction. To sum up, there are researches related to
inequality conducted in Viet Nam using VHLSSs. However, this study can make a contribution that focus
on the regional disparities and employ policy review and the updated data on VHLSS. In addition, it used
the VHLSS 2008, means that one decade later than the research from Epprecht, et al.(2009). Therefore, it
is necessary to estimate to show the newer factors effected to regional disparities. As a result, the factors
can reflect the effectiveness of economic development policy during the last decade.
Review of economic development polices in Vietnam: Vietnam continues to introduce a series of
economic, social and political reforms from Doi moi period until the present for the economic
advancement and international integration of the country. The initial impetus for Doi moi was domestic
reform due to the urgent need in agriculture production(Smith, 2009) with entitling the land tenure and
liberalizing the input markets. Afterward, the reforms were made in other sectors. The recent related
major economic development policies can be categorized into three sectors such as industrial
development, focal economic zone development, ethnic minority development and poverty reduction
policies. One of the most important factors that influence the livelihood of rural household is the land
policy. Since Doi moi, there were several reforms on agriculture land policy has been conducted. These
reforms focused on the land tenure rights and the rights of farmers in agriculture production. A
remarkable point can help review the process of land reform. Soon after the decollectivisation in
agriculture, “the first land law” was presented in the Resolution 10 (Khoan 10). According to Resolution
10, the family household was endorsed as the basic unit of agriculture production and distribution. This
policy resulted in changing Vietnam from a food importing country to the second biggest rice exporter in
the world. In 1993, the Land Law was enacted which provided the land holder five rights on Land Use
Certificate (LUC) are to transfer, to exchange, to heritance, to lease, and to mortgage. In 2003, one
modification on the Land Law was made to secure the rights for both spouses in the LUC. These changes
in the land regulations create the market for land that the rural households have the own right to make
decisions on agriculture production and improve their income. However, still some issues exist in the land
tenure that causes the different patterns of agriculture production between regions and especially
between the North and the South.
Secondly, promoting industrial development policies makes a big effect on economic development in the
last two decades (ICEM, 2007). The industrial development policies focused on the economic zones,
328
industrial zones, and the urban areas where they have comparative advantages and leaving the rural and
remote areas behind. The annual growth rate of industries is about 10 percent per year (ICEM, 2007). As a
result, there are 96 industrial and export processing zones have been launched in cities such as Ha Noi,
Hai Phong, Ho Chi Minh, Binh Duong, Dong Nai and Ba Ria Vung Tau because of good basic infrastructure
and easy transformation conditions (Business-in-Asia, 2007). The Economic Focal Region development
policies are found in the Decree No. 145/2004/QD-TTg, 148/2004/QD-TTg, and
146/2004/QD-TTg(VPQH, 2004a, 2004b, 2004c). According to these documents, the country will form
three Economic Focal Regions in the North Region, the Central Region and the South Region, respectively,
from the year of 2010 to 2020. The development of industries, services, infrastructures is being
prioritized to boost the economic situation. More recently, the Economic Focal Region in the Mekong Delta
has been established under the Decree No. 492/QD-TTg (Minister, 2009). The GPD per capita is being
targeted to increase some ten percent per year and the poverty will be almost eliminated in the year of
2020.
Concerning ethnic development policy, from the beginning of the country’s independence declaration, the
ethnic minorities groups are treated politically and economically equal. However, almost of them have low
backgrounds of development. Therefore, there is still gap between them and the majority. The
government has always given more priorities and supports for them with various development programs
and projects. They can be listed out such as “135 program”, “30a program” that have been launched in the
ethnic minorities’ areas for poverty reduction, economic development, heath care, education, culture
reservation. Besides, the ethnic minorities have access to free services such as health care and education.
As a result, the livelihood of ethnic minorities has been improved significantly. However, the gap still exists
between them and it needs more and more efforts from government and policy makers in order to get
fully reduced poverty and improved rural development. Recently, the big program for poverty reduction
has been implemented under the Decision No. 30a/2008/NQ-CP by the government. In this program,
there are 62 poor districts and 43 of them from the Northwest region are given priority for social and
economic development. However, due to the limitation of development resources, this program mostly
focuses on human resource development, capacity building, and poverty reduction direct support.
Therefore, these regions having the poorest districts are still far from development compared to others of
the country. In conclusion, there are still some regions being left behind in terms economic development,
giving then undue disadvantage compared to others. Given this situation, one may ask as to what kind of
incentives the government needs to provide for these regions to catch up with the others.
Box 1: Major economic policies introduced since Doi moi
1986
The VI Congress of Vietnam Communist Party adopts economic policy reform (Doi moi).
1987
Promulgation of the Foreign Investment Law, opening of the economy; Promulgation of the Land Law,
affirming the land use right of farming households.
1988
Reform of banking system; Resolution 10 of Vietnam Communist Party granting business autonomy to
farming households.
1989
Elimination of the two-price system; Elimination of many export quotas; Financial tightening of SOEs.
1990
Adoption of the Company Law and Private Enterprise Law, creating legal ground for operation to the
private sector.
1991
Private enterprises are allowed to directly export and import.
1992
Pilot equitization of SOEs.
1993
Promulgation of the Law on Enterprise Bankruptcy, the Law on Environment, and the Land Law.
1994
1994 Elimination of export license for all commodities, excluding rice, wood and crude oil; Promulgation of
the Labor Code; Establishment of state general corporations.
1995
Promulgation of the State Owned Enterprise Law; Vietnam joins ASEAN and AFTA.
1997
Elimination of all barriers for domestic rice trade; Private sector is allowed to export rice.
1998
Non-tariff and exchange control measures are introduced to regulate import, and protect domestic
production during the Asian financial crisis.
1999
Adoption of the Enterprise Law; Implementation of VAT; Decree on free export and import right is issued
2000
Adoption of the Vietnam - United States Trade Agreement.
2001
Adoption of the program for arranging, renovating, developing and improving the efficiency of SOEs in the
period 2001-05.
2002
Freely the interest rate of loans in credit organizations
2003
Promulgation of the Land Law 2003
2005
Competitive Law is become valid
2006
Private business is accepted in the National Communist Congress X.
Viet Nam become the 150
th
member of WTO
Source: ICEM (2007); Wikipedia(2011) and authors’ additions
329
3. Methodology
Econometric Specification of Regression-based Decomposition and Sources of Disparities: Fields
(2003), Heltberg (2003) and Wan & Zhou (2005) proposed to the semi-log regression method the explain
sources of incomes disparity from the affecting factors.
lnY
i
= y
i
=
a
i
+
b
1
X
1i
+
b
2
X
2i
+ +
b
k
X
ki
+
e
i
,
(1)
Where y
i
is the log of per capita expenditure and x
1
,…, x
k
are exogenous determinants of income such as
land, capital assets, education, occupation, demographic variables, ability to access infrastructures and
regional dummies. The regression result shows how much income inequality is explained by the effecting
factors. In other words, “x% of the income inequality is attribute to education, y% to region, z% to gender,
etc.”(Fields, 2003). In this semi-log regression, the log of expenditure per capita is used as dependent
variable as it was used in other previous researches (Heltberg, 2003; Walle & Gunewardena, 2001; Wan &
Zhou, 2005). The selection of household expenditure as the variable to estimate the household income has
been widely used in the literature. Under the difficulties to collect to information on revenue and cost of
economic activities in the rural areas where their income sources are mixed. This alternative shows the
advantage to estimate the rural income more precisely. Independent variables are extracted from
household characteristics and resources.
Descriptions of the dataset: This study uses the data from Vietnam Household Living Standard Survey
2008. The descriptions of the total sample are in the below table.
The VHLSS is the dataset collected by the GSO with the technical support from the World Bank. The survey
was first conducted in 1993 and the next is in 1998/1999. During the 2000s, this survey was made one
per two year such as 2002, 2004, 2006, 2008, and 2010. The content of the survey is mostly about income
and expenditure of both types of household from the rural and urban areas in eight regions of the country.
This sample is selected for the households who live in the rural areas only. The table 1 shows the total
sample of data used in the empirical model. These observations are categorized to different living regions
in Vietnam. The dataset included 6,576 samples from 9,189 samples of the VHLSS 2008. The reason for
the different is that this research selects the household who lives only in rural areas. Statistically, the
percentage of household who live in rural areas in Vietnam is 70.4% in 2009. Therefore, it is interesting
that the percentage of the select sample in the total dataset turns out a similar number of 71.5%.
Descriptions of Variables: The variables were extracted from the pool of dataset. In which, the dependent
variable is the natural logarithm value of total expense in the household. The independent variables are
grouped as follows:
Household Characteristics: Household characteristics effect to household income and expenditures. In
details, the number of household members or household size, age and education of household head are
mainly the key factors that can contribute to the earning ability of the household. The variable of squared
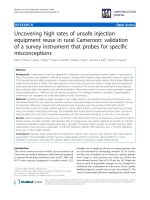
Figure 1: Vietnam map by regions
330
age is to explain that the income household will increase at the beginning period in their life and
diminishes at the later period.
Leadership: The political positions of household head may benefit for their household in economic earning
activities. This research examines weather household heads with leader positions in the community can
bring higher advantages for their household in terms of income earning or not.
Job Status: Job status describes that whether the household which skilled works will get higher income for
their household or not. This is one important point for human development policies in the rural areas for
the government to make affords on providing vocational training to farmers and rural residents.
Labor Force Allocation to Industries and Services: The household members who work in industry and
service sectors contribute significantly to household income in the rural areas. However, they need basic
education level and training skill to involve in the works. The dataset tests that whether this activity of
rural household labor allocation can contribute to improve household living standards or not.
Ethnicity: Ethnicity is one of the household characteristics. However, there are 54 ethnic groups in
Vietnam include the majority, the Kinh. It was found in the previous researches that the minorities seem
to be poorer that the majority. It is meaningful to include this factor to explain as a source in disparity.
Land: In rural areas, land is the major capital for household to cultivate and the major source to generate
household income. In a country with more than 70% of labor forces working in agriculture, the land
resources play a crucial role for rural livelihoods. The land resources categorized into difference types
such as land for rice, annual trees, perennial trees, forestland, water surface, grassland, garden, land for
housing, and land for temporality purposes.
In addition, the allocation of land recourses to difference crops in household production strategies effect
to the profit and ended with household income and expenditure.
Ability to Access Infrastructures: The rural infrastructures and services such as road, market, electricity,
and post office are indirect factors to facilitate household production and consumption. Therefore, the
households, which can access to some or all of these infrastructures and services may gain higher income
than the others.
Remittance: Remittance plays an important role for rural livelihood and rural development in developing
countries such as Vietnam. This research considers estimating the level of remittance from both domestic
and international remittances in rural areas by household members.
Geographic Locations: Vietnam has eight geographic regions. Each region has difference natural and social
condition. Therefore, location in different region may have different condition for economic development.
Some regions have difficult conditions than others because of land quality, natural disasters and trading
conditions. The geographic locations are presented by regional dummy variables in the model.
Table 1: Description of dataset by regions
Region Code
Region Name
Obs.
RD
Red River Delta
1,431
NE
North East
1,026
NW
North West
351
NC
North Central
846
SC
South Central Coast
579
CH
Central Highlands
408
SE
South East
612
MD
Mekong River Delta
1,323
Total
6,576
Source: Authors’ Calculation
331
Table 2: Description of variables
Variable
Description
Unit
Mean
Std. Dev.
EXPELOG
Log of expenditure per capita (unit of expenditure:
'000 VND)
1,000
VND
8.603
0.560
HHSIZE
Total number of family members
People
4.197
1.681
MARIRAL
Marital status of household head (married = 1,
otherwise = 0)
0.829
0.376
ETHNIC
Ethnicity of household head (Ethnic = 1; otherwise
= 0)
0.191
0.393
GENDER
Gender of household head, male = 1; female=0
0.798
0.402
AGE
Age of household head
years
49.764
13.685
AGESQ
Square of age of household head
years
2663.742
1486.927
EDUC
Education level of household head categorized by
VHLSS from 0 to 11(illiterate=0,…, doctorate=11)
0.031
0.503
LEADER
Leadership of household head(leader=1;
otherwise=0)
0.012
0.110
UNSKJOB
Unskilled job of household head(Un-skill=1;
otherwise=0)
0.907
0.290
INSEMAN
Total number of household member who work in
industries or services
number
0.301
0.595
RICELAND
Total area of land that household cultivates rice in a
year
ha
0.285
0.778
ANTRLAND
Total are of land for annual trees
ha
0.153
0.435
PERETRLAND
Total area of land for perennial trees
ha
0.065
0.513
FORESTLAND
Total area of land for forestry
ha
0.035
0.599
WATERAREA
Total area of water surface
ha
0.022
0.222
GRASSLAND
Total area of land for grass
ha
0.001
0.028
RESILAND
Area of land for housing or construction purpose
ha
0.014
0.085
GARDENLAND
Area of garden
ha
0.000
0.010
TEMPLAND
Area of land for temporary purpose
ha
0.000
0.013
REMITTANCED
Weather household get remittance or not? (Yes=1;
No=0)
0.871
0.335
ROADV
Is there road to the village? (Yes=1; No=0)
0.883
0.322
POST
Is there post office in the village? (Yes=1; No=0)
0.896
0.306
ELECTRIC
Can household access electricity? (Yes=1; No=0)
0.990
0.097
INTERMART
Is there inter-commune market in this commune?
(Yes=1; No=0)
0.629
0.483
NE
Households who live in region NE (Northeast = 1;
RD = 0)
0.156
0.363
NW
Households who live in region NW (Northwest = 1;
RRD = 0)
0.053
0.225
NC
Households who live in region NC (North Central )=
1; RRD = 0
0.129
0.335
SC
Households who live in region SC (South Central
Coastal )= 1; RRD = 0
0.088
0.283
CH
Households who live in region CH (Central
Highlands = 1; RRD = 0)
0.062
0.241
SE
Households who live in region SE (Southeast = 1;
RRD = 0)
0.093
0.291
MD
Households who live in region MD (Mekong Delta =
1; RRD = 0)
0.201
0.401
N = 6,576
Source: Authors’ calculation
332
4. Results and Discussion
Household size: HHSIZE is the variable for the total number of household members and it shows the
negative effect on the expenditure per capita. It is obvious that households with more members suffer a
harder life than households with fewer. The marital status of the household head also affects positively on
expenditure per capita. In addition, the age of the household head makes the same impact. One of the
important factors that affects to household expenditure is the ethnicity. The results show that the ethnic
minority groups have lower expenditure than the majority. The income disparity between the ethnic
minority and the majority are concerned in many researches since Doi moi launched in Vietnam.
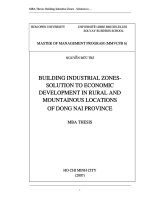
Table 3: Estimates from Model Result
Variable
Coef.
Sig.
P>t
HHSIZE
-0.089
***
0.000
MARIRAL
0.117
***
0.000
ETHNIC
-0.445
***
0.000
GENDER
-0.006
0.782
AGE
0.042
***
0.000
AGESQ
0.000
***
0.000
EDUC
0.065
***
0.000
LEADER
0.041
0.479
UNSKJOB
-0.056
**
0.015
INSEMAN
0.015
0.180
RICELAND
0.034
***
0.000
ANTRLAND
0.048
***
0.004
PERETRLAND
0.086
***
0.000
FORESTLAND
0.021
*
0.030
WATERAREA
0.120
***
0.000
GRASSLAND
0.223
0.284
RESILAND
0.161
*
0.022
GARDENLAND
-0.455
0.436
TEMPLAND
0.268
0.551
REMITTANCED
0.016
0.365
ROADV
0.118
***
0.000
POST
-0.028
0.154
ELECTRIC
0.215
***
0.001
INTERMART
0.020
0.117
NE
0.036
0.099
NW
0.018
0.597
NC
-0.138
***
0.000
SC
-0.014
0.562
CH
0.071
**
0.013
SE
0.256
***
0.000
MD
0.045
*
0.022
CONS.
7.576
***
0.000
R-squared
0.2814
Adj R-squared
0.278
Number of obs.
6,576
*** Significant at 1%;
**Significant at 5%;
*Significant at 10%
333
Ethnicity: The variable of ETHNIC is found as the negative factor to the household living standard. The
disparity between the majority and the ethnic minorities has long been concerned in the literature.
Vietnam has 53 ethnic minorities who live in all regions of the country but mostly concentrated in the
highland areas. The living standard of the ethnic minority is tended to be lower than the majority despite
numerous policies introduced to assist these groups (Baulch, 2008). The result from this research is also
the evidence of the disparity between the majority and the ethnic minorities. Therefore, the development
policies should be consider about the sustainability of its impacts for improve the living standard of these
less developed groups by combination of policies to focus on both ethnic people and less developed
regions.
Education: The variable of education level is EDUC has found to affect positively to expenditure per capita.
However, the number of household head who has high level of education is low in rural areas. Therefore,
improving the education level is also a good way to improve the living standard for the rural household.
Job Status: The job statuses of the household head are found in the dummy variables of LEADER, and
UNSKJOB. The result shows that households whose heads have professional skills have higher living
standard than those with the household head who has no professional skill.
Land Resources: As mentioned above, the Doi moi policy was started with the agriculture production
reform. The change of land tenure is one of the most important for agriculture production. This is one of
the reasons for the growth of agriculture productivity and rural income. The land resources are found in
the variables of RICELAND, ANTRLAND, PERETRLAND, FORESTLAND, WATERAREA, GRASSLAND,
RESILAND, GARDENLAND, and TEMPLAND. They stand for area of rice cultivation per year, area of annual
crops, area of perennial trees, area of forest land, area of water surface, area of grass land, area of resident
land, and temporary land, respectively. Almost these land resources variables show positive effects on
household expenditure per capita. Furthermore, a household can get higher welfare with rice cultivation
land, the perennial crop areas such as coffee, cashew, rubber, and the water surface areas. This result also
implies that households that have more land tend to have a higher income than the others that have less.
Remittance: The remittance contributes significantly to the living standard of rural people. This is a
resource for the rural development in Vietnam. The result can be found in the variable of REMITANCED.
Households that have members working in the urban or oversea can send back money home for living
expense or production investment. Almost all the households get remittance from their family member
(87%). However, it is not significant to increase household expenditure.
Infrastructure Facilities: The ability to access basic infrastructure facilities such as road and electricity is
significantly increased with household welfare. The infrastructure facility variables are ROADV, POST,
ELECTRIC, and INTERMART. The local road and electricity plays an important role in household
expenditure and rural development. This indicates that the government should afford to provide the basic
infrastructure to the whole country.
Spatial Regional Disparity: Vietnam country is economically and ecologically divided into 8 regions.
Each region has different natural and socio-economic characteristics. Therefore, settlement in each region
has some advantages and disadvantages for economic development. Locations of resettlement also affect
household expenditure. In addition, the mountainous or remotes areas considered being less productive
areas with poor access to infrastructure, health and education facilities. This resulted in lower living
standards compared to other regions (Kang & Imai, 2010). The location where the people live affects
differently on the household’s economic situation. For example, (Kang & Imai, 2010) stressed that the
ethnic minority group living in the Mekong Delta and the South East coast benefit more than those living
in the mountainous areas. Lastly, the empirical result shows the North Central Coastal is at a disadvantage
because they have lower economic returns than others. In the Northwest, most of the land is less fertile
and the households suffer from the natural disasters almost every year. Therefore, people living there
tend to have low income. Furthermore, the industries and services are underdeveloped, which is another
reason for the low income in the region.
5. Conclusion and Policy Implications
The factors that affect the regional disparity in rural areas of Vietnam are associated with household
characteristics and resources. In order to shorten this gap, policy should be improved by creating more
334
capacity for the ethnic household to strengthen their access to education, land resources and the services
for economic development. This result is similar to the findings of (Walle & Gunewardena, 2001) using the
VHLSS 92-93. It can be concluded that the dimensions of disparity have not changed since 1990s.
However, the results show the effects of regional differences to household income. The reason is some
regions in Vietnam have more disadvantage than the others in terms of improving their living standard.
Therefore, the economic development policy should focus on the comparative advantage of its region to
shorten the gap and create more returns to the disadvantage regions. The empirical analysis shows that
North Central Coastal has negative impact on the household welfare. This result does not absolutely
follow the hypothesis that the poor concentrate in the highland. It is an important point for the decision
makers to shorten the gap between regions of the country. For economic development in the rural areas,
the policies should be focused on (1) improving the education level is important for decree the disparity
in the rural areas, and prioritizing vocational trainings for the rural labors to provide working skill are
strongly recommend; (2) increasing the production of the cash crops, fishery; (3) improving the
infrastructure facilities, and lastly (4) strengthen economic empowerments for poorer regions by creating
the linkages between rural and urban areas, the less developed to developed regions, and the ethnic
minorities with the majority.
Acknowledgement: The authors would like to give the warmest thanks to Mr. Joseph Arbiol, and Mr.
Kyle Johnson who proofread of this paper at the earlier draft. Their efforts are highly appreciated.
References
Adger, W. N. (1999). Exploring income inequality in rural, coastal Viet Nam. Journal of Development
Studies, 35(5), 96 - 119.
Baulch, B. (2008). The economic development of ethnic minorities in Viet Nam.
Blinder, A. S. (1973). Wage Discrimination: Reduced Form and Structural Estimates. Journal of Human
Resources, 8(4), 436-455.
Business-in-Asia (Producer). (2007). Map of industrial zones and export processing zones in Vietnam.
Retrieved from
Epprecht, M., Müller, D. & Minot, N. (2009). How remote are Vietnam’s ethnic minorities? An analysis of
spatial patterns of poverty and inequality. The Annals of Regional Science, 1-20. doi:
10.1007/s00168-009-0330-7
Fields, G. S. (2003). Accounting for Income Inequality and Its Change: A New Method, with Application to
the Distribution of Earnings in the United States. Worker Well-Being and Public Policy (Research
in Labor Economics), 22, 1-38.
Fields, G. S. & Yoo, G. (2000). Falling Labor Income Inequality in Korea's Economic Growth: Patterns and
Underlying Causes. Review of Income and Wealth, Series, 46(2), 139-159.
Gunderson, M. (1989). Male-Female Wages Differentials and Policy Responses. Journal of Economic
Literature, 27(1), 46-72.
Haughton, J. & Khandker, S. R. (2009). Handbook on Poverty and Inequality. Washington, DC: The World
Bank.
Heltberg, R. (2003). Spatial Inequality in Vietnam: A Regression-based Decomposition Working Paper. :
The World Bank.
Heshmati, A. (2004). A Review of Decompostion of Income Inequality: Institute for the Study of Labor.
Hodgson, A. (Producer). (2007). Unequal regional development in Vietnam. Retrieved from
ICEM. (2007). Analysis of Pollution from Manufacturing Sectors in Vietnam: International Centre for
Environmental Management.
Kang, W. & Imai, K. S. (2010). Pro-Poor Growth, Poverty and Inequality in Rural Vietnam: The University
of Manchester.
Decision No. 492/QD-TTg dated April 16, 2009 of the Prime Minister on major orientations for
socio-economic development of the Mekong Delta key economic region (2009).
Morduch, J. & Sicular, T. (2002). Rethinking Inequality Decomposition, with Evidence from Rural China.
Economic Journal, 112, 93-106.
Oaxaca, R. (1973). Male-Female Wage Differentials in Urban Labor Markets. International Economic
Review, 14(3), 693-709.
Psacharopoulos, G. & Patrinos, H. A. (1994). Indigenous People and Poverty in Latin America: An
Empirical Analysis Work Bank Regional and Sectoral Studies. Washington, DC.: Work Bank.
Shorrocks, A. F. (1980). The Class of Additively Composable Inequality Measures. Econometrica, 48(4),
335
613-626.
Shorrocks, A. F. (1982). Inequality Decompositions by Factor Components. Econometrica, 50(1), 193-212.
Smith, M. (2009). Economic Integration and Vietnam’s Development: Final Report: IBM Belgium in
associated with DMI, Ticon & TAC.
Vandermoortele, M. & Bird, K. (2010). Viet Nam's Progress on Economic Growth and Poverty Reduction:
Impressive improvements Development Progress Stories: Oversea Development Institute, the U.K.
Vietnamplus (Producer). (2009). New proposals to reduce poverty rate. Retrieved from
Decision No. 145/2004/QD-TTg dated August 13, 2004 of the Prime Minister on major orientations for
socio-economic development of the Northern key economic region till 2010, with a vision to
2020 (2004a).
Decision No. 146/2004/QD-TTg dated August 13, 2004 of the Prime Minister on major orientations for
socio-economic development of the Southern key economic region till 2010, with a vision to 2020
(2004b).
Decison No. 148/2004/QD-TTg dated August 13, 2004 of the Prime Minister on major orientations for
socio-economic development of the central Vietnam key economic region till 2010, with a vision
to 2020 (2004c).
Walle, D. V. D. & Gunewardena, D. (2001). Sources of ethnic inequality in Viet Nam. Journal of Development
Economics, 65(1), 177-207.
Wan, G. (2004). Accounting for Income Inequality in Rural China: A Regression-based Approach. Journal
of Comparative Economics, 32, 348-363.
Wan, G. & Zhou, Z. (2005). Income Inequality in Rural China: Regression-based Decomposition Using
Household Data. Review of Development Economics, 9(1), 107-120. doi:
10.1111/j.1467-9361.2005.00266.x