Coffee Boom, Coffee Bust and Smallholder Response in Vietnam's Central Highlands
Bạn đang xem bản rút gọn của tài liệu. Xem và tải ngay bản đầy đủ của tài liệu tại đây (173.09 KB, 15 trang )
Coffee Boom, Coffee Bust and Smallholder
Response in Vietnam’s Central Highlands
Dang Thanh Ha and Gerald Shively*
Abstract
This paper studies the recent boom and bust in Vietnam’s coffee economy. Data from smallholder coffee
farms in the Central Highlands are used to examine responses to a drop in producer coffee prices. A multi-
nomial logistic regression model is used to identify several factors associated with four specific patterns
observed among coffee farmers: no response to price change, reductions in use of purchased inputs, changes
in crop mix, and responses aimed at enhancing liquidity through off-farm work or borrowing. Patterns of
response are shown to have differed systematically across sub-groups of smallholders. Policy implications
raised by the findings are discussed.
1. Introduction
Introduced by the French in the 1850s, coffee remained relatively unimportant in
Vietnam until the 1980s (de Fontenay and Leung, 2001). In the decade between 1990
and 2000 Vietnamese farmers, approximately 80% of them smallholders (Greenfield,
2002), planted more than a million hectares of Robusta coffee, enabling Vietnam to
surpass Colombia as the world’s second-largest coffee producer (ICO, 2002). In the
1990s coffee production increased at an annual average rate of 30% and by the end
of the decade coffee was providing as much as 10% of Vietnam’s annual export earn-
ings. A number of factors help to explain the rapid growth of the coffee sector in
Vietnam, among them a policy of privatization and economic liberalization (Doi Moi),
state-sponsored migration, and price spikes generated by frosts in Brazil. During the
mid-1990s the economic benefits of Vietnam’s coffee boom spread rapidly and were
far reaching. By mid-decade more than one million Vietnamese were participating
directly or indirectly in the country’s coffee economy (Nhan, 2002).
Vietnam’s entry into the world coffee market, combined with rising stocks, inelastic
demand and a shift toward low-cost Robusta for processing (Ponte, 2002) helped con-
tribute to a precipitous decline in international coffee prices, to below 40 cents a pound
in late 2001—a three-decade low in constant dollar terms (Brown et al., 2001).
1
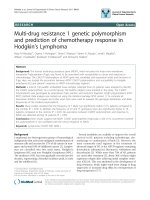
Figure
1 presents producer coffee prices and harvested coffee area in Vietnam over the period
1990–2002. The figure clearly illustrates Vietnam’s basic coffee story: a steady expan-
sion of coffee area in the latter half of the 1990s and simultaneous erosion in producer
prices.
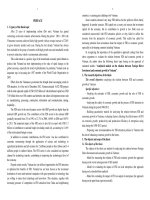
Of course, fluctuating fortunes for smallholders is a phenomenon unique to neither
coffee nor Vietnam. For example, Figure 2 displays annual international price indices
Review of Development Economics, 12(2), 312–326, 2008
DOI:10.1111/j.1467-9361.2007.00391.x
*Ha: Nong Lam University, Thu Doc, Ho Chi Minh City, Vietnam. Tel: 84-8-896-1708; Fax: 84-8-896-0713;
E-mail: Shively: 403 West State Street, West Lafayette, IN 47907, USA. Tel:
765-494-4218; Fax: 765-494-9176; E-mail: For helpful research assistance we thank
Jessica Perdew and Nam Anh Tran. This research was made possible through support provided by the Office
of Agriculture and Food Security, Bureau for Global Programs, US Agency for International Development,
under the terms of Award No. PCE-A-00-98-00019-00. The opinions expressed herein are those of the
authors and do not necessarily reflect the views of the US Agency for International Development.
© 2007 The Authors
Journal compilation © 2007 Blackwell Publishing Ltd, 9600 Garsington Road, Oxford, OX4 2DQ, UK and 350 Main St, Malden, MA, 02148, USA
COFFEE BOOM AND BUST IN VIETNAM 313
© 2007 The Authors
Journal compilation © Blackwell Publishing Ltd. 2007
for coffee, cocoa, tea, palm oil and rubber over the period 1960–2005 and illustrates
the volatile nature of prices for these crops. Coefficients of variation for these com-
modities typically range between 30 and 70% when calculated using annual average
prices and more than 100% when based on monthly data.
Price fluctuations such as those in Figure 2 are important for several reasons. On the
supply side, many countries rely heavily on just a few primary commodities, including
agro-industrial crops for export earnings, so that fluctuations in prices lead directly to
fluctuations in incomes and account balances. On the demand side, price cycles have
been shown to affect trade flows as well as inflation rates in importing and exporting
countries (Cashin et al., 2000; Barichello, 2000). Recent research documenting the
0
20
40
60
80
100
price
0
100
200
300
400
500
area
Price
Area
Source: Prices for green Robusta beans (in US cents per kilogram) from International
Coffee Organization; harvested area (in 1000 hectares) from FAO.
1990 1991
1992
1993
1994 1995
1996 1997
1998 1999
2000
2001
2002
Figure 1. Farm Gate Price and Harvested Coffee Area, Vietnam, 1990–2002
Source: United Nations Conference on Trade and Development (UNCTAD).
0
100
200
300
400
500
600
700
800
900
1960
1962
1964
1966
1968
1970
1972
1974
197
6
1978
1980
1982
1984
1986
1988
1990
1992
1994
1996
199
8
2000
200
2
2004
Year
Index 1961=100
Coffee
Cocoa
Tea
Palm oil
Rubber
Figure 2. Historical Price Indices for Major Agricultural Export Commodities,
1960–2005
314 Dang Thanh Ha and Gerald Shively
© 2007 The Authors
Journal compilation © Blackwell Publishing Ltd. 2007
extent of agricultural price fluctuations and the detrimental effects thereof include Li
(2002, for cocoa in Indonesia); Potter (2001, for oil palm in Indonesia); Gotsch and
Burger (2001, for cocoa in Malaysia); McMillan (2003, for cashew in Mozambique);
Burger and Smit (1997, for rubber worldwide); and Huff (2002, for rubber in pre-World
War II Malaya).
The focus here is the collapse in coffee prices, which has attracted much attention.
Pérez-Grovas et al. (2001), Varangis et al. (2003), and Maluccio (2005), provide
analyses of the “coffee crisis” from Latin American perspectives. Charveriat (2001) and
Mehta and Chavas (2004) offer global perspectives. In the case of Vietnam, de
Fontenay and Leung (2001), the World Bank (2004), and Lindskog et al. (2005) con-
clude that the collapse in coffee prices had important effects throughout the country,
and reversed the fortunes of many smallholders. For example, for three consecutive
years beginning in late 1999, producer prices in Vietnam were insufficient for most
farmers to cover the variable costs of coffee production (USDA FAS, 2002, 2003). Not
surprisingly, one of the most acutely affected areas has been the largest coffee-
producing area in Vietnam, Dak Lak province (Table 1). In Dak Lak, overproduction
and subsequent price dampening had “a serious negative impact on the livelihoods of
Vietnamese coffee producers” (ICARD and Oxfam, 2002, p. 1).Although coffee prices
recovered modestly in the 2002–03 production year, many smallholders in Dak Lak
and elsewhere continue to struggle with low producer prices.Vietnam’s on-going coffee
crisis is widely acknowledged within and outside the country, and finding ways to
improve outcomes for coffee farmers remains a key component of Vietnam’s agricul-
tural strategy.
2
In this paper data from 1999 and 2003 surveys of smallholder coffee farmers in
Vietnam’s Central Highlands are used to study how farmers coped with declining
coffee prices. Data from the 2003 survey are employed to estimate a multinomial logis-
tic model to measure the factors associated with four specific patterns observed among
smallholders: no response, changes in input use, changes in land use, and cash enhance-
ment. The role of ethnicity in conditioning these responses is studied, as well as the
importance of irrigation access and farmers’ subjective outlooks regarding coffee
prices. We find farmers’ responses were fairly mixed, and that lowland Kinh migrants
were more likely to change crops, borrow, or engage in off-farm employment than
Table 1. Coffee Production by Region in Vietnam, 1996
Yield Production Share in total
Region (tons/ha) (’000 tons) production (%)
Central Highlands 1.88 185,895 80.3
Dak Lak 2.09 134,815 58.2
Lam Dong 1.49 37,690 16.3
Gia Lai 1.59 11,457 4.9
Southeast 1.83 37,056 16.3
Dong Nai 1.87 29,894 12.9
North Mountains 0.99 4,443 1.9
North Central Coast 1.09 2,486 1.1
South Central Coast 0.86 1,618 0.7
Total 1.82 231,498 100.0
Source: Minot (1998).
members of ethnic minority communities. The patterns suggest both farm- and farmer-
specific constraints on smallholders’ ability to respond to declining agricultural prices.
2. Study Site and Data
Coffee is grown in a variety of locations and by a variety of farmers in Vietnam. Given
this diversity generating a survey sample that broadly represents coffee growers is
difficult. Here, we focus on a sample drawn from one of the most important coffee
districts of Vietnam, in the Central Highlands province of Dak Lak. In 2001 the total
coffee area of Vietnam was 566,800 hectares, of which the Central Highlands accounted
for 476,800 hectares. Within the Central Highlands, Dak Lak province accounted for
257,100 hectares and roughly 50% of total national coffee output. Of Dak Lak’s 16
districts, Cu M’gar has the largest coffee area, representing roughly 14% of the total
coffee area of Dak Lak. Our data come from the Ea Tul catchment, in Dak Lak’s Cu
M’gar district.
3
The study area has undergone tremendous economic and social change in recent
decades. Following reunification in 1975, the government of Vietnam designated Dak
Lak as a New Economic Zone (NEZ) and established hundreds of state farms and
cooperatives in the area, most of them emphasizing industrial crops. As a result of the
NEZ designation, population density increased more than five-fold in just four decades
(from 17 people per square kilometer in 1975 to more than 90 people per square kilo-
meter in 2002). Most of this migration consisted of an influx of ethnic Kinh farmers
(Vietnam’s majority) from densely populated lowland areas. For example, although the
Kinh originally represented a very small proportion of the population of Dak Lak, by
2000 their share in the provincial population had risen above 70%. Migration was ini-
tially induced by government programs, but beginning in the late 1980s and early 1990s
substantial migration into Dak Lak occurred spontaneously. By 2000, the province’s
population stood at 1.8 million people, of which approximately 400,000 were members
of ethnic minority groups. Smallholders control approximately 80% of the coffee
area. The remainder is controlled by the Vietnam National Coffee Coporation
(VINACAFE).
The rise of Vietnam’s coffee economy nearly doubled GDP in Dak Lak within
a decade—from $204 per capita in 1990 to $390 per capita in 2000.
4
But rapid
agricultural growth has raised both environmental and social concerns. On the envi-
ronmental front, many observers note that coffee production in Dak Lak has tended
to follow an extensive, rather than intensive, path. For example, in the decade between
1990 and 2000 an estimated two-thirds of coffee output growth was due to area expan-
sion (ICARD and Oxfam, 2002). This rapid area expansion led to substantial forest
destruction. Although Dak Lak still contains some of the most extensive forests in
Vietnam, forest clearing has been severe (De Koninck, 1999) leading to habitat and
biodiversity loss (UNEP-WCMC, 2000). Total land for agricultural production in Dak
Lak doubled in the 1990s, with an average increase of 46,000 hectares per year. A
majority of newly claimed land has been used for cash crop production, notably coffee.
Due to the rapid expansion of land for agriculture, the forest-covered area decreased
from 90% in 1960 to 57% in 1995, and then to less than 50% in the late 1990s. Between
1980 and 2000 Dak Lak lost forest at an average rate of 20,000 hectares per year (ADB,
2003). In the Ea Tul catchment, forest area was reduced from 58% in 1980 to 20% in
2000 (Ha et al., 2001).
From a social perspective, a massive influx of Kinh farmers into areas of ancestral
importance to ethnic minorities led to a series of land conflicts between migrants and
COFFEE BOOM AND BUST IN VIETNAM 315
© 2007 The Authors
Journal compilation © Blackwell Publishing Ltd. 2007
316 Dang Thanh Ha and Gerald Shively
© 2007 The Authors
Journal compilation © Blackwell Publishing Ltd. 2007
local ethnic minority people, and between various migrant populations (ADB, 2003).
Although many minority farmers have benefited from Vietnam’s coffee expansion,
minority groups are widely perceived to be economically disadvantaged vis-à-vis their
Kinh counterparts. This conjecture is partly supported by data from our sample indi-
cating significantly higher per capita incomes among Kinh farmers (7.6 million VND
on average in 2003, compared with 4.4 million VND for non-Kinh respondents). The
inability of ethnic minorities to benefit from and respond to general economic incen-
tives is an issue that remains high on the stated agenda of policymakers in Vietnam,
and significant challenges to reducing poverty among these groups remain (ADB, 2000;
Doutriaux et al., 2006). Below we address the extent to which Kinh farmers were able
to respond in a different way from their non-Kinh counterparts to the collapse in coffee
prices.
Table 2 contains a summary of data from our smallholder surveys.
5
The stratified
random surveys were conducted by a team from Nong Lam University as part of a
larger study of rural livelihood in coffee-growing areas of the Central Highlands. The
surveys cover agricultural production and household activities in 1999 and 2003.
The observations do not represent a panel, but the sample households were drawn
from the same area, namely the four communes of Ea Tul, Ea Kpal, Ea Pok and Quang
Phu. The two samples are similar in most respects. The main exception is that rice
Table 2. Characteristics of Sample Farms, Dak Lak Province
1999 2003
Variable Mean Std Dev Mean Std Dev
Farm area (hectares) 1.49 1.11 1.50 1.00
Income
a
(1000 Dong) 25,273 29,097 35,501 31,673
Income per capita
a
(1000 Dong) 4,191 4,696 6,597 6,741
Ethnicity (% Kinh) 73.0 44.7 68.9 46.4
Household size (number) 6.4 2.2 5.9 2.0
Dependency ratio 1.22 0.86 1.01 0.69
(# > 65 + # < 15)/# workers
Age of household head (years) 52.9 12.2 45.2 11.5
Education of household head (years) 7.7 3.5 7.0 3.7
Female headed household (%) 16.0 37.0 17.7 38.3
Year first planted coffee (year) 1990 4.3 1991 4.9
Land ownership 86.0 27.7 84.3 28.7
(% of farm area with title)
b
Pump ownership (% w/pump) 73.0 44.1 76.1 42.8
Irrigation (% w/irrigation) 72.3 45.2 84.2 36.6
Livestock (% w/pig or cow) 53.1 50.0 38.8 48.8
Off-farm work 13.0 33.7 42.6 49.6
(% w/off-farm income > 0)
Rice cultivation (% w/rice area) 66.0 47.5 25.4 43.6
Rice cultivation 10.9 13.4 4.7 10.1
(% of farm area w/rice)
N 215 209
Source: survey data.
Notes:
a
nominal income in 1000 Dong; in 1999 1US$ ഠ 14,000 D; in 2003 1US$ = 15,553 D.
b
For definition of land ownership, see text.
COFFEE BOOM AND BUST IN VIETNAM 317
© 2007 The Authors
Journal compilation © Blackwell Publishing Ltd. 2007
production was far less prominent in the 1999 survey (66% of households vs 25% in
2003) and off-farm employment was far more widespread in the 2003 survey (43% vs
13% in 1999). All farmers in both rounds of the survey planted and sold coffee.
The economic rewards of producing coffee in Dak Lak have been very substantial
for coffee-growing smallholders, on average. For example, a disaggregated poverty map
for Vietnam indicates that poverty rates in southern, coffee-growing districts of the
Central Highlands are markedly lower than those in northern districts, where less
coffee development has occurred (Minot, 2000). Our survey data indicate average
annual household nominal incomes in the study areas of approximately 25 million
VND (US$1828) in 1999 and 46 million VND (US$2560) in 2003.
6
Translated into per
capita terms, these incomes are roughly equivalent to GDP per capita in Vietnam
(US$430 in 2002), a remarkable pattern insofar as poverty in Vietnam tends to be
highest in rural areas. While this underscores the importance of coffee as an income-
generating mechanism in the Central Highlands, our data also suggest that the crop
has nevertheless diminished in importance in recent years. Households derived 87%
of total income from coffee in 1999 and 77% in 2003. Thus while total household
income rose slightly, on average, between the 1999 and 2003 surveys, the total share of
income derived from coffee production fell. This reflects lower prices and an ongoing
process of crop and income diversification that began following the coffee price col-
lapse in the mid-1990s.
Table 3 contains data illustrating the broad patterns of activity diversification in the
samples. These data suggest widespread diversification of activities among the sample
farms and a rising proportion over time of households reporting either planting
multiple crops or engaging in off-farm employment. For example, the proportion of
households that reported planting two or more crops increased between 1999 and 2003,
and the proportion that reported planting three or more crops nearly doubled.
7
Simi-
larly, the proportion of households reporting off-farm employment increased from
13% in 1999 to 43% in 2003. Only the proportion of sample households that reported
engaging in livestock sales was lower in the later round of the survey (53% compared
with 39% in 1999). The remainder of the paper focuses on the extent to which these
patterns and more specific reactions to the collapse in coffee prices can be explained
by features of the sample respondents.
Table 3. Diversification of Activities by Sample Farms, Dak Lak Province
1999 2003
Off-farm employment 13.0 42.6
(% of households)
Livestock sales (cattle and pigs) 53.1 38.8
(% of households)
Planted two or more crops 43.6 46.9
(% of households)
Planted three or more crops 7.9 14.4
(% of households)
N 215 209
Source: survey data.
318 Dang Thanh Ha and Gerald Shively
© 2007 The Authors
Journal compilation © Blackwell Publishing Ltd. 2007
3. Household Responses to the Price Collapse
We begin the analysis of household response to the collapse in coffee prices by exam-
ining data on broad indicators of behavioral response, as reported retrospectively by
households when interviewed in 2003. Table 4 contains data for the entire sample of
farms, and separately for those below 1.5 hectares (small farms) and above 1.5 hectares
(large farms). Note that 1.5 hectares corresponds to the average farm size in the
sample. This split places 66% of the sample in the small farm category. The median
farm size in the 2003 sample was 1.2 hectares.
During the 2003 survey respondents were asked to report how they responded to
the collapse in coffee prices. We should note that we made no attempt to tie the
drop in the producer price of coffee to a specific reference year because not all farmers
perceived the downward trend in price the same way (in part due to some modest
but short-lived price recovery in 1998). Instead, the survey simply aimed to record
self-reported responses to falling prices. As a result, some farmers in the sample may
have reported how they responded to the price drop following the 1995 growing
season, whilst others may have reported how they responded in the 1998–2002
period. In all instances, we allowed farmers to report multiple responses. We included
specific categories of response and also allowed open-ended descriptions of changes
in household activities and practices. As a result, column sums in Table 4 exceed 100%.
Most households, however, reported only a single major category of response to the
collapse in price. Nearly a third of the sample reported no change in strategy or
activity.
In the case of an annual crop, the theory of a profit-maximizing farmer would suggest
that the primary response to a price reduction should be a reduction in planted area
(Askari and Cummings, 1976). In the case of a perennial crop, however, optimal short-
run responses to a price decline need not follow this pattern, since long-run consider-
ations regarding investment and disinvestments in trees may come into play.
8
As
indicated in Table 4, in our sample the most common reaction to the drop in price,
Table 4. Smallholder Response to Collapse in Coffee Prices, Dak Lak Province, 2003 (%)
Response Small farms (0–1.5 ha) Large farms (1.5+ ha) All farms
No response 32.8 26.4 30.6
Reduced fertilizer 44.5 34.7 41.1
Eliminated fertilizer 10.9* 29.2* 17.2
Reduced irrigation 5.1 9.7 6.7
Eliminated irrigation 6.6* 22.2* 12.0
Planted new crops 10.2 8.3 9.6
Removed coffee 8.0* 2.8* 6.7
Borrowed money 3.6 4.2 3.8
Got a job 5.8 2.8 4.8
Sold livestock 2.2 0.0 1.4
Sold land 0.0 0.0 0.0
N 137 72 209
Note: multiple responses possible. An asterisk indicates the difference between means is statistically signif-
icant at a 90% confidence level.
Source: survey data.
regardless of farm size, was a reduction in the amount of fertilizer applied to coffee.
A slightly larger proportion of small farms than large farms reported a reduction in
fertilizer use (45% vs 35%), although this difference is not statistically significant.
While this reaction clearly reflects a desire on the part of households to reduce cash
expenditures, it also reflects the tendency of households to shift resources out of coffee
and into other crops, without abandoning coffee completely.In fact, a number of house-
holds reported that while they reduced fertilizer use in coffee, they simultaneously
increased fertilizer use on other crops, especially corn and black pepper. This basic
pattern is further underscored by the complete elimination of fertilizer by 17% of
households in the sample, and the reduction or elimination of irrigation (typically
requiring the use of electric or gasoline pumps) in 19% of households.
9
Somewhat sur-
prisingly, a statistically higher proportion of large farms reported a complete cessation
of irrigation or fertilization. This may reflect a greater capacity to withstand a loss in
income on larger farms and a tendency to maintain production on small farms, even
in the face of falling prices. Nevertheless, a significantly larger proportion of small
farms reported removing coffee trees (8.0% vs 2.8%) and a larger proportion of
small farms reported planting new crops in response to falling coffee prices. Roughly
similar (and small) proportions of households reported borrowing as a direct result of
falling prices. Small farms were slightly more likely to seek off-farm employment or to
sell livestock. No household reported selling land. Taken together, the data in Table 4
suggest that small farms were somewhat less responsive to falling coffee prices than
large farms, and that a disproportionate share of large farms were sufficiently buffered
from their reliance on coffee that they could treat their investment in trees with a
certain degree of benign neglect (foregoing both irrigation and fertilizer) while waiting
for coffee prices to recover.
Questions that naturally emerge from Table 4 are whether patterns of response sys-
tematically differed, and whether differences can be explained by household features.
To answer these questions a more detailed analysis is undertaken using a multinomial
logistic regression. This approach requires collapsing the categories appearing in Table
4, so as to maintain the opportunity for econometric estimation of coefficients of
interest. Accordingly, we create four broad categories of response, q = {1, 2, 3, 4}. Into
category 1 we place those households that reported no response to the price collapse.
Into category 2 we place households that reported input reductions, i.e. reductions in
fertilizer or irrigation rates. This includes households that eliminated fertilizer or
irrigation entirely. Category 3 contains households that changed crops, either by
removing coffee trees or by planting new crops in combination with existing coffee.
The final category includes households that directly enhanced liquidity, either by
borrowing money (formally or informally), seeking off-farm employment, or selling
livestock. When households reported multiple responses, a unique category was
assigned, with changes in crops at the top of the hierarchy, followed by liquidity
enhancements and reductions in inputs.
Table 5 contains results for our four equation multinomial logistic regression where
no response is the omitted response category. Normalizing the regression coefficients
on this category, the estimating equations take the form (Greene, 2001):
Pr = 2q
b
bbb
()
=
+++
e
eee
X
XXX
2
234
1
Pr = 1q
bbb
()
=
+++
1
1
234
eee
XXX
COFFEE BOOM AND BUST IN VIETNAM 319
© 2007 The Authors
Journal compilation © Blackwell Publishing Ltd. 2007
320 Dang Thanh Ha and Gerald Shively
© 2007 The Authors
Journal compilation © Blackwell Publishing Ltd. 2007
where X represents a vector of independent variables and b
i
represents a vector of
coefficients associated with response category i. All coefficients are reported as rela-
tive risk ratios, that is, probabilities of response relative to the omitted category such
that:
As a result of this transformation, all estimated coefficients are positive by construc-
tion. An estimated coefficient greater than 1 indicates that the independent variable is
associated with a higher probability of response under that category, compared with
the omitted response; an estimated coefficient less than 1 indicates that the indepen-
dent variable is associated with a lower probability of response under that category,
compared with the omitted response. Absolute values of z statistics (reported in paren-
theses in Table 5) have been adjusted accordingly.
Overall, several statistically meaningful patterns emerge from the data, with nine
statistically significant coefficient estimates. Controlling for other features of the house-
holds, Kinh ethnicity is associated with a significantly lower relative probability of
reductions in inputs, and a significantly higher relative probability of seeking enhanced
Pr = 2
Pr = 1
q
q
b
()
()
= e
X
2
Pr = 4q
b
bbb
()
=
+++
e
eee
X
XXX
4
234
1
Pr = 3q
b
bbb
()
=
+++
e
eee
X
XXX
3
234
1
Table 5. Multinominal Logistic Regression of Smallholder Response, Dak Lak Province, 2003
Liquidity
Input reductions Crop changes enhancements
Ethnicity 0.303* 2.017 11.476*
(1 = Kinh; 0 otherwise) (2.35) (0.90) (1.98)
Village 6.929* 1.197 1.289
(0/1) (3.89) (0.33) (0.35)
Head’s education 0.989 1.093 1.021
(years) (0.20) (1.13) (0.21)
Irrigation source 1.304 0.645 4.712*
(1 = well; 0 otherwise) (0.73) (0.89) (2.32)
Farm size 4.304* 1.383 1.643
(ha per person) (3.08) (0.50) (0.64)
Workers 1.344* 0.949 1.512*
(number per ha) (1.88) (0.22) (1.81)
Tenure 2.469 2.870 0.676
(% of area owned) (1.44) (0.99) (0.39)
Expected coffee price 1.000 0.999* 1.002
(ratio to sample mean) (0.88) (1.70) (1.17)
Number of responses in category 99 30 16
Notes:Total sample size N = 209. Omitted response category (N = 64) is “no response.” See text for defini-
tion of response categories. All coefficients reported as relative risk ratios. Absolute values of z statistic
(reported in parentheses) are similarly transformed. An asterisk indicates the estimated coefficient is sig-
nificantly different from zero at a 90% confidence level.
liquidity.The latter pattern likely indicates preferential access to borrowing and greater
off-farm employment opportunities among Kinh respondents. Some evidence points
to village differentials, especially in the case of reduced input levels, but no evidence
suggests responses were conditioned by education.
10
Several patterns emerge with respect to four fixed factors: irrigation source, farm
size, number of workers, and security of tenure. In each case, one would expect these
factors to influence the range of possible response, and in each case statistical evidence
supports this conjecture. In the case of the irrigation source, which here is coded as a
binary indicator of whether the household used a well as a source of irrigation water,
households with an established well (a relatively reliable source of irrigation water
compared with the alternatives, such as a stream or pond) were more likely to seek
enhanced liquidity through non-agricultural means. Within the study site, the water
demands of coffee are quite high, and competition for water is frequently reported by
farmers. The regression results suggest farmers without a secure source of irrigation
water were more likely to shift land or inputs away from coffee. Results also suggest
large farms were more likely than small farms to reduce or eliminate inputs (i.e. fer-
tilizer and irrigation). That the correlation between farm size and borrowing is weak
in this sample is somewhat surprising given Duong and Izumida’s (2002) evidence of
a link between land ownership and access to credit in Vietnam.The pattern found here
likely reflects the uniformly low rates of borrowing as a response to price reductions
in the sample.
Household labor capacity emerges as an important explanatory factor in the regres-
sions. Not surprisingly, households with a larger number of workers per hectare were
more likely to seek off-farm employment. They were also more likely to reduce input
levels, probably as a reflection of higher immediate requirements for cash and food in
larger households.To gauge the importance of tenure security in conditioning response,
we include in the regression a measure of farm ownership. During the survey, respon-
dents were asked to identify tenure status for all of their plots based on three main
categories: (1) area owned and documented by a government-issued land use certifi-
cate (n = 200), (2) area under tribal control but not documented by a government-
issued land use certificate (n = 14), and (3) area recently cleared and not documented
by a government-issued land use certificate (n = 43). As indicated by the sum across
categories, several households held land under more than one category. A variable
“percentage of land owned” was constructed using total farm size, net of area rented
in or out, as denominator and total area documented by government-issued land use
certificates as numerator. Land ownership was positively correlated with the likelihood
of reducing input levels. The weak correlation of land ownership with other categories
of response indicates in part the small degree of variation in the land ownership vari-
able, and in part the fact that households with high rates of ownership were the least
likely to change their behavior in response to the price fall.
The final variable included in the regressions is the respondent’s expectation
regarding coffee prices. During the survey each respondent was asked to forecast
the minimum, expected, and maximum coffee price for the next growing season. The
expected price, expressed as a ratio of the respondent’s price to the sample mean
response, is included as a conditioning variable in the regressions. Other things equal,
households that had above average expectations regarding the future coffee price,
vis-à-vis their sample cohorts, were less likely to change crops compared with the
reference group. Within the context of this sample, crop changes seem to be largely
driven by price expectations. Changes in input use, in contrast, are conditioned by
external factors and household characteristics.
COFFEE BOOM AND BUST IN VIETNAM 321
© 2007 The Authors
Journal compilation © Blackwell Publishing Ltd. 2007
322 Dang Thanh Ha and Gerald Shively
© 2007 The Authors
Journal compilation © Blackwell Publishing Ltd. 2007
Regression results reported in Table 5 can be used to further highlight the role of
ethnicity and farm size in conditioning the observed responses. Table 6 reports
observed and adjusted probabilities of response, where the adjusted probabilities hold
constant all factors reported in Table 5, varying only the ethnicity of the household or
its farm size. In other words, the data in Table 6 present probabilities that answer the
question “what would have been the response of a large farm or a Kinh household,
had the household otherwise possessed the average set of household characteristics?”
These adjustments provide some interesting insights into patterns in the data. Com-
paring first the probabilities for Kinh and non-Kinh households we see that, after
adjusting for other factors in the regression, non-Kinh farmers were less likely to have
no response to price changes (an adjusted probability of 0.25 compared with an
observed probability of 0.32) and were more likely to have responded by adjusting
inputs (an adjusted probability of 0.69 compared with an observed probability of 0.62).
In other words, part of the lack of response observed in non-Kinh households reflects
characteristics other than household ethnicity, per se. In contrast, controlling for other
factors, Kinh households were more likely to have responded by enhancing liquidity
(an adjusted probability of 0.13 compared with an observed probability of 0.10)
suggesting that differential access to borrowing and off-farm employment by Kinh
households is a strong feature of the data, and intensifies when one controls for other
observable characteristics of the household. In a comparison of small and large farms,
adjusted probabilities of response are quite similar to observed probabilities, although
adjustments increase the likelihood of small farms reporting no response to price
changes. The overall patterns in Table 6 indicate the approximate magnitude of the
impact of farm size on response. Importantly, the role of farm size in conditioning
household response to the reduction in price appears to be robust to the inclusion of
other observable features of households.
4. Conclusions and Policy Implications
Coffee farmers in Vietnam responded to falling coffee prices by reducing or shifting
input use and changing crops. Small farms appear to have been somewhat restricted
in their willingness or ability to respond to falling coffee prices compared with larger
farms, most likely because larger farms were sufficiently buffered from their reliance
on coffee to neglect their trees (foregoing both irrigation and fertilizer) while waiting
for coffee prices to recover. Against the alternative of “doing nothing,” larger farms,
households with greater labor capacity, and households with greater tenure security
Table 6. Observed and Adjusted Probabilities of Response, 2003
Observed probability of response Adjusted probability of response
Non- Small Large Non- Small Large
Response Kinh Kinh farms farms Kinh Kinh farms farms
No response 0.32 0.30 0.35 0.21 0.25 0.33 0.38 0.18
Reduced inputs 0.62 0.41 0.40 0.61 0.69 0.37 0.39 0.63
Changed land use 0.05 0.19 0.16 0.11 0.06 0.17 0.15 0.12
Enhanced liquidity 0.02 0.10 0.09 0.06 0.01 0.13 0.08 0.06
Source: computed from results of regression reported in Table 5.
COFFEE BOOM AND BUST IN VIETNAM 323
© 2007 The Authors
Journal compilation © Blackwell Publishing Ltd. 2007
were all more likely to adjust input use. Crop changes were strongly correlated with
expected prices in our sample, but largely uncorrelated with observed household fea-
tures. Kinh households appear to have been more likely than their ethnic minority
counterparts to have enhanced liquidity through borrowing or off-farm work, provid-
ing some evidence of better access to credit and labor markets among this group.
The observation that responses to falling prices differed systematically has two
policy implications. First, although coffee supply appears to have been responsive to
changes in producer price, generalizing features of this supply response across the
entire population of coffee producers appears problematic. In fact, a considerable
amount of friction in supply response seems tied to specific characteristics of the pop-
ulation, including ethnicity, and the opportunities afforded to ethnic majority farmers.
Second, the patterns reported here suggest that a broad range of policies may be
required to help smallholders adjust to temporary price changes or adapt to more
fundamental shifts in relative prices. In particular, small farms and ethnic minority
households appear to have fewer opportunities to enhance liquidity in the short term,
requiring these groups to adjust to price changes in more fundamental ways, including
shifting land to new crops.
11
Repeated cycles of investment and disinvestment in peren-
nial crops are likely to be detrimental to these households in the long run, and could
lead to instability in the agricultural sector as a whole. Although we do not wish to dis-
count well-known arguments against price stabilization, results nevertheless suggest
small farms might benefit more from price stabilization than comparatively larger
farms. In addition, while crop diversification is typically understood to be a risk-
reducing strategy for smallholders, small landholdings appear to have acted as a
constraint to farm-level crop diversification in this sample.
12
For this reason, expand-
ing rural livelihood opportunities in ways that help to diversify income is more likely
to benefit Vietnamese smallholders with limited land resources than promoting new
cash crops. These lessons may apply equally well in other settings where industrial
crops present smallholders with upside potential, but downside risk.
References
ADB, Study on the Policy and Institutional Framework for Forest Resources Management. Asian
Development Bank. TA No. 3255—VIE. Rome, Italy and Hanoi, Vietnam: Agriconsulting
S.P. A. (2000).
———, “Participatory Poverty and Governance Assessment: Dak Lak Province. Prepared in
Collaboration with ActionAid Vietnam; ADB (2003). www.adb.org/Documents/Reports/
PPGA/daklak.pdf (accessed July 1, 2004).
Askari, H. and J.T. Cummings, Agricultural Supply Response: A Survey of the Econometric
Evidence. New York: Praeger (1976).
Barichello, R., “Impact of the Asian Crisis on Trade Flows: A Focus on Indonesia and Agricul-
ture.” In R.M.A. Lyons, R.D. Knutson, K. Meilke, and A. Yunez-Naude (eds), Policy
Harmonization and Adjustment in the North American Agricultural and Food Industry.
Winnipeg, Manitoba: Texas A&M University/University of Guelph/El Colegio de Mexico
(2000):7–23.
Brown, O., C. Charveriat, and D. Eagleton, “Background Study on the Coffee Market.” Oxford:
OxfamUK. Manuscript (2001).
Burger, K. and H.P. Smit, The Natural Rubber Market: Review, Analysis, Policies and Outlook.
Cambridge: Woodhead (1997).
Caputo, M.R., “How to do Comparative Dynamics on the Back of an Envelope in Optimal
Control Theory,” Journal of Economic Dynamics and Control 14 (1990):655–83.
324 Dang Thanh Ha and Gerald Shively
© 2007 The Authors
Journal compilation © Blackwell Publishing Ltd. 2007
Cashin, P., H. Liang, and C.J. McDermott, “How Persistent are Shocks to World Commodity
Prices?” IMF Staff Papers 47(2) (2000):177–217.
Charveriat, C.,“Bitter Coffee: How the Poor are Paying for the Slump in Coffee Prices.” Oxford:
Oxfam. Manuscript (2001).
de Fontenay, P. and S. Leung, “Managing Commodity Price Fluctuations in Vietnam’s Coffee
Industry.” National Centre for Development Studies, Australian National University.
Manuscript (2001).
De Koninck, R., Deforestation in Vietnam. Ottawa, Canada: International Development
Research Centre (1999).
Doutriaux, S., C. Giesler, and G. Shively, “Competing for Coffee Space: Development-Induced
Displacement in the Highlands of Vietnam.” Cornell University. Manuscript (2006).
Duong, B. and Y. Izumida, “Rural Development Finance in Vietnam: A Microeconometric
Analysis of Household Surveys,” World Development 30(2) (2002):319–35.
Gilbert, C.L, “International Commodity Agreements: An Obituary Notice.” World Development
24(1) (1996):1–19.
Gotsch, N. and K. Burger, “Dynamic Supply Response and Welfare Effects of Technological
Change on Perennial Crops: The Case of Cocoa in Malaysia,” American Journal of Agricul-
tural Economics 83(2) (2001):272–85.
Greenfield, G., “Vietnam and the World Coffee Crisis: Local Coffee Riots in a Global Context,”
(2002) Accessed July 1, 2004 at www.vicofa.org.vn.
Ha, D.T., P.H.D. Phuoc, N.T. Nguyen, L.V. Du, P.T. Hung, V.O. Espaldon, and A.O. Magsino,
“Impacts of Changes in Policy and Market Conditions on Land Use, Land Management
and Livelihood Among Farmers in Central Highlands of Vietnam.” In A.G. Garcia (ed.),
Sustaining Natural Resources Management in Southeast Asia. Los Baños, Philippines:
SEAMEO Regional Center for Graduate Study and Research in Agriculture (SEARCA)
(2001).
Huff, W.G., “Boom-or-Bust Commodities and Industrialization in Pre-World War II Malaya,”
Journal of Economic History 62(4) (2002):1074–115.
ICARD and Oxfam, “The Impact of the Global Coffee Trade on Dak Lak Province, Viet Nam:
Analysis and Policy Recommendations.” ICARD, Oxfam Great Britain and Oxfam Hong
Kong (2002).
ICO, International Coffee Organization data accessed at www.ico.org (2002).
Li, T.M., “Local Histories: Global Markets: Cocoa and Class in Upland Sulawesi,” Development
and Change 33(3) (2002):415–37.
Lindskog, E., K. Dow, G.N. Axberg, F. Miller, and A. Hancock, “When Rapid Changes in Envi-
ronmental, Social, and Economic Conditions Converge:Challenges to Sustainable Livelihoods
in Dak Lak, Vietnam.” Stockholm: Stockholm Environment Institute (2005).
McMillan, M.S., “When Economic Reform Goes Wrong: Cashew in Mozambique,” Brookings
Trade Forum (2003):97–151.
Maluccio, J.A., “Coping with the ‘Coffee Crisis’ in Central America: The Role of the Nicaraguan
Red de Protección Social.” Food Consumption and Nutrition Division Discussion Paper 188.
Washington, DC: The International Food Policy Research Institute (2005).
Mehta, A. and J P. Chavas, “Responding to the Coffee Crisis: What Can We Learn from Price
Dynamics.” Agricultural and Applied Economics Staff Paper No. 472. Madison: University of
Wisconsin-Madison (2004).
Minot, N.,“Competitiveness of Food Processing in Vietnam:A Study of the Rice, Coffee,Seafood
and Fruit and Vegetables Subsectors.” Report prepared for Ministry of Planning and United
Nations Industrial Development Organisation, Vietnam (1998). www.un.org.vn/unido/frame4/
food.pdf (accessed July 1, 2004).
———, “Generating Disaggregated Poverty Maps: An Application to Vietnam,” World Devel-
opment 28(2) (2000):319–31.
Nhan, D.T., “International Cooperation and Strategic Adjustment in Each and Every Country:
the Musts for Sustainable World Coffee Production.” Speech delivered at International Coffee
Organization Conference in May 2002. www.vicofa.org.vn/ (accessed July 1, 2004).
Pérez-Grovas, V., E. Cervantes and J. Burstein, “Case Study of the Coffee Sector in Mexico.”
Fort Collins: Fair Trade Research Group, Colorado State University. Manuscript (2001).
Ponte, S., “The ‘Latte Revolution’? Regulation, Markets and Consumption in the Global Coffee
Chain,” World Development 30(7) (2002):1099–122.
Potter, L., “Agricultural Intensification in Indonesia: Outside Pressures and Indigenous Strate-
gies,” Asia Pacific Viewpoint 42(2&3) (2001):305–24.
United Nations Conference on Trade and Development (UNCTAD) Commodity Price Statis-
tics (1992–2005). www.unctad.org/Templates/Page.asp?intItemID=1889&lang=1 (accessed
January 31, 2006).
United Nations Environment Programme-World Conservation Monitoring Centre (UNEP-
WCMC). 2000. Biodiversity Profile of the Socialist Republic of Viet Nam. www.unep-wcmc.
org/infoserv/countryp/vietnam (accessed June 21, 2004).
USDA Foreign Agricultural Service, Vietnam Coffee SEMI-ANNUAL 2002 (2002).
———, Vietnam Coffee SEMI-ANNUAL 2003 (2003).
van de Walle, D., “Choosing Rural Road Investments to Help Reduce Poverty,” World Devel-
opment 30(4) (2002):575–89.
Varangis, P., P. Siegel, D. Giovannucci, and B. Lewin, “Dealing with the Coffee Crisis in Central
America: Impacts and Strategies.” Development Research Group, Policy Research Working
Paper 2993. Washington, DC: The World Bank (2003).
World Bank, “The Socialist Republic of Vietnam Coffee Sector Report.” Agriculture and
Rural Development Department Report No. 29358-VN. Washington, DC: The World Bank
(2004).
Notes
1. The inability of exporting countries to revive the International Coffee Agreement is also
sometimes cited as a contributing factor (Gilbert, 1996).
2. The Government of Vietnam’s response to falling coffee prices has included support
for variety replacement, investment in two regional coffee trading centers, and bi-lateral
negotiation with the Government of Indonesia to voluntarily reduce Robusta areas in the
two countries by 20% and 15%, respectively, by 2005. In addition, efforts are underway
to promote cacao as an alternative to coffee on as many as 10,000 hectares in Dak Lak
province.
3. The study area is located in the Ea Tul catchment. The catchment has a total land area of 431
square kilometers. The Ea Tul catchment forms one part of the Srepok River watershed. The
river originates in the Central Highlands of Vietnam, and runs westward joining the Mekong
River in Cambodia.
4. Vietnam’s non-agricultural sectors have grown rapidly as well, although the strong perfor-
mance of coffee and rice has contributed to a pattern of extremely balanced growth in Vietnam.
The ratio between agriculture’s contribution to GDP growth and industry’s contribution aver-
aged 1.0 between 1990 and 2000. For regional neighbors, this compares with relatively greater
agricultural growth in Myanmar (6.18), Lao PDR (2.88), Cambodia (2.74), India (1.31) and
Bangladesh (1.12); and relatively greater industrial growth in China (0.66), the Philippines (0.65),
Thailand (0.54), Indonesia (0.42), and Malaysia (0.29).
5. The survey questionnaire and data are available from the authors on request.
6. Reported annual household incomes vary widely among respondents, ranging from about 2
million VND (US$146) to nearly 200 million VND (US$14,625).
7. Diversification strategies differ systematically across households. For example, the correla-
tion between farm size and number of crops planted is positive and statistically significant.
8. Caputo (1990) illustrates how,in a dynamic setting, short-run supply response may be perverse
while the long-run output supply response to a sustained reduction in price should be negative.
9. In most cases the elimination of irrigation reflects only the elimination of the variable flow
of irrigation services during the growing period, not disinvestment in irrigation infrastructure
per se (pumps, pipes, etc.).
COFFEE BOOM AND BUST IN VIETNAM
325
© 2007 The Authors
Journal compilation © Blackwell Publishing Ltd. 2007
10. Data from the 1999 survey suggest that observed differences among villages in input reduc-
tions may be explained by relatively high initial levels of chemical fertilizer in some villages
(especially Ea Pok, Eak Pam, and Quang Phu).
11. Dak Lak’s isolation and poor linkage to non-agricultural sectors continues to hinder income
diversification, despite evidence of slight growth in non-agricultural employment in recent years.
Van de Walle (2002) analyzes rural road investments and connections to poverty in Vietnam.
12. Our limited sample size requires caution when generalizing to Vietnam’s entire coffee sector.
Nevertheless, finding appropriate methods for diversifying rural incomes remains an important
challenge in Vietnam, and elsewhere.
326 Dang Thanh Ha and Gerald Shively
© 2007 The Authors
Journal compilation © Blackwell Publishing Ltd. 2007