Low power design for VLSI
Bạn đang xem bản rút gọn của tài liệu. Xem và tải ngay bản đầy đủ của tài liệu tại đây (3.74 MB, 97 trang )
VIETNAM NATIONAL UNIVERSITY – HO CHI MINH CITY
UNIVERSITY OF SCIENCE
NGUYỄN THỊ ĐÊ
LOW POWER DESIGN FOR VLSI
Specialization: Electronic Engineering – Microelectronic Major
Code: 60 52 70
MASTER DEGREE THESIS
ELECTRONIC ENGINEERING – MICROELECTRONICS
SUPERVISOR
ASSOC. PROF. DR. NGUYỄN HỮU PHƯƠNG
HO CHI MINH CITY, 2010
1
Nguyễn Thị Đê
Table of Contents
TABLE OF CONTENTS 1
LIST OF FIGURES 3
LIST OF TABLES 6
CHAPTER I: INTRODUCTION 7
1.1. Rationale 7
1.2. Scope 7
1.3. Structure of the Research 8
CHAPTER II: TECHNIQUES TO REDUCE POWER DISSIPATION 9
2.1. Sources of Power Dissipation 9
2.1.1. Static Dissipation 10
2.1.2. Dynamic Dissipation 12
2.2. Techniques to Reduce Power Dissipation 13
2.2.1. Dynamic Power Reduction 13
2.2.2. Static Power Reduction 14
CHAPTER III: MATLAB SIMULATION OF POWER DISSIPATION 18
3.1. MatLab 18
3.1.1. Why do choose MatLab? 18
3.1.2. A Short Introduction to Matlab 18
3.2. Relationship between Power Dissipation and Related Circuit Parameters . 20
3.2.1. Static Power Dissipation 20
3.2.1.1. Relationship between Static Power and Static Current 21
3.2.1.2. Relationship between Static Power and Supply Voltage 22
3.2.2. Dynamic Power Dissipation 23
3.2.2.1. Relationship between Dynamic Power and Activity Switching 23
3.2.2.2. Relationship between Dynamic Power and Load Capacitance 24
2
Nguyễn Thị Đê
3.2.2.3. Relationship between Dynamic Power and Supply Voltage 25
3.2.2.4. Relationship between Dynamic Power and Frequency 26
CHAPTER IV: LOW POWER DESIGN OF A SIMPLE LOGIC CIRCUIT. 28
4.1. 1-Bit Magnitude Comparator Circuit 28
4.1.1. Principle 28
4.1.2. Truth Table 28
4.2. Low Power Design 29
4.2.1. Low Power Design at Circuit Level 29
4.2.1.1. Purpose 29
4.2.1.2. Design Basic 29
4.2.1.3. Design Implementation 35
4.2.2. Low Power Design at Layout Level 55
4.2.2.1. Purpose 55
4.2.2.2. Layout Implementation 55
CHAPTER V: CONCLUSION 93
BIBLIOGRAPHY 94
3
Nguyễn Thị Đê
List of Figures
Figure 2.1: CMOS inverter model for static power dissipation evaluation 11
Figure 2.2: A Variable-Threshold CMOS (VTCMOS) inverter circuit 15
Figure 2.3: Generic structure of a Multiple-Threshold CMOS (MTCMOS) 16
Figure 3.1: Relationship between Static Power and Static Current 26
Figure 3.2: Relationship between Static Power and Supply Voltage 27
Figure 3.3: Relationship between Dynamic Power and Activity Switching 28
Figure 3.4: Relationship between Dynamic Power and Load Capacitance 29
Figure 3.5: Relationship between Dynamic Power and Supply Voltage 30
Figure 3.6: Relationship between Dynamic Power and Frequency 31
Figure 4.1: General operation using switch logic 30
Figure 4.2: Operation of the CMOS NOT gate 30
Figure 4.3: Operation of the 2-input NAND gate 31
Figure 4.4: Operation of the 2-input NOR gate 31
Figure 4.5: Logic formation using nFET in the CMOS logic gate 32
Figure 4.6: Logic formation using pFET in the CMOS logic gate 33
Figure 4.7: XOR and XNOR gates 34
Figure 4.8: XOR and XNOR gates with complementary structuring 35
Figure 4.9: Design_1 Schematic Circuit 36
Figure 4.10: Schematic Circuit using CMOS Transistors 37
Figure 4.11: Waveform of Signals 38
Figure 4.12: Static Power Dissipation 39
Figure 4.13: Dynamic Power Dissipation 41
Figure 4.14: Average Power Dissipation 42
Figure 4.15: Supply Current 43
Figure 4.16: Supply Power (VI) 44
Figure 4.17: Average Supply Power (VI) 45
4
Nguyễn Thị Đê
Figure 4.18: Design_2 Schematic Circuit 46
Figure 4.19: Schematic Circuit Using CMOS Transistors 47
Figure 4.20: Waveform of Signals 48
Figure 4.21: Static Power Dissipation 49
Figure 4.22: Dynamic Power Dissipation 50
Figure 4.23: Average Power Dissipation 51
Figure 4.24: Supply Current 52
Figure 4.25: Supply Power (VI) 53
Figure 4.26: Average Supply Power (VI) 54
Figure 4.27: Layout_1 View 56
Figure 4.28: Extracted View 57
Figure 4.29: Extracted Parasitic Capacitors 58
Figure 4.30: Analog_Extracted View 59
Figure 4.31: LVS Verification 60
Figure 4.32: Waveform of Signals 61
Figure 4.33: Static Power Dissipation 62
Figure 4.34: Dynamic Power Dissipation 63
Figure 4.35: Average Power Dissipation 64
Figure 4.36: Supply Current 65
Figure 4.37: Supply Power (VI) 66
Figure 4.38: Average Supply Power (VI) 67
Figure 4.39: Layout_2 View 68
Figure 4.40: Extracted View 69
Figure 4.41: Extracted Parasitic Capacitors 70
Figure 4.42: Analog_Extracted View 71
Figure 4.43: LVS Verification 72
Figure 4.44: Waveform of Signals 73
Figure 4.45: Static Power Dissipation 74
Figure 4.46: Dynamic Power Dissipation 75
5
Nguyễn Thị Đê
Figure 4.47: Average Power Dissipation 76
Figure 4.48: Supply Current 77
Figure 4.49: Supply Power (VI) 78
Figure 4.50: Average Supply Power (VI) 79
Figure 4.51: Layout_3 View 80
Figure 4.52: Extracted View 81
Figure 4.53: Extracted Parasitic Capacitors 82
Figure 4.54: Analog_Extracted View 83
Figure 4.55: LVS Verification 84
Figure 4.56: Waveform of Signals 85
Figure 4.57: Static Power Dissipation 86
Figure 4.58: Dynamic Power Dissipation 87
Figure 4.59: Average Power Dissipation 88
Figure 4.60: Supply Current 89
Figure 4.61: Supply Power (VI) 90
Figure 4.62: Average Supply Power (VI) 91
6
Nguyễn Thị Đê
List of Tables
Table 3.1: Useful operations, functions and constants in Matlab 19
Table 3.2: Useful plotting commands in Matlab 200
Table 4.1: Truth table for 1-bit magnitude comparator circuit 29
Table 4.2: Summary Table………………………………………………………………92
7
Nguyễn Thị Đê
CHAPTER I
INTRODUCTION
This introductory chapter emphasizes the importance of VLSI low power
design for modern electronic devices and systems, and presents the scope and the
structure of my thesis.
1.1. Rationale
Nowadays, electronic circuits and systems must have as low power dissipation
as possible, especially in the field of mobile communications.
In these devices, if have no techniques to reduce power consumption then,
they will suffer from either a very short battery life or a very heavy battery pack.
Even in the case of non-portable systems, reductions in power consumption
are also important. These systems often run hot and this causes failure mechanisms.
We must cost for cooling and packaging. Therefore, it is essential to have the peak
power under control [9][13][16].
1.2. Scope
The main study of the thesis is to examine the techniques of reducing CMOS
power dissipation; obtaining the relationship between power dissipation with related
circuit parameters; and how to design for power dissipation optimization up to
layout level of a simple digital circuit.
A 1-bit magnitude comparator circuit will be used as an example of a digital
circuit for design and estimating power dissipation. The design is implemented in
8
Nguyễn Thị Đê
180nm technology using Cadence software. Even rather simple but this illustrative
design includes many aspects of low power design.
1.3. Structure of the Research
The remainder of this research comprises four chapters
Chapter II: Techniques to Reduce Power Dissipation
Chapter III: MatLab Simulation of Power Dissipation
Chapter IV: Low Power Design of A Simple Logic Circuit
Chapter V: Conclusion
9
Nguyễn Thị Đê
CHAPTER II
TECHNIQUES TO REDUCE POWER
DISSIPATION
This chapter discusses quantitatively the static and dynamic power
dissipation in CMOS circuit, and techniques to reduce them.
2.1. Sources of Power Dissipation
In [14], the instantaneous power P(t) drawn from the power supply is
proportional to the instantaneous supply current i
DD
(t) and the supply voltage V
DD
(assumed constant ).
P(t) = i
DD
(t).V
DD
(2.1)
The average power over some time interval T is
=
∫
()
(2.2)
Power dissipation in CMOS circuit comes from two components:
Static dissipation due to
o Sub-threshold conduction through OFF transistors
o Tunneling current through gate oxide
o Leakage through reverse-bias diodes
Dynamic dissipation due to
o Charging and discharging of load capacitances
10
Nguyễn Thị Đê
o “Short-circuit” current while both pMOS and nMOS
networks are simultaneously conducting.
=
+
(2.3)
2.1.1. Static Dissipation
Considering the static CMOS inverter shown in Figure 2.1, if the input = ‘0’,
the associated nMOS transistor is OFF and pMOS transistor is ON. The output
voltage is V
DD
or logic ‘1’. When the input = ‘1’, the associated nMOS transistor is
ON and the pMOS transistor is OFF. The output voltage is 0 volts (GND) [14].
Ideally, when transistors are OFF no current flow through the circuit, the power
dissipation is zero.
However, reality even in case transistor is OFF, exist sub-threshold,
tunneling, and leakage currents. That leads to small amounts of static current
flowing through the OFF transistor and static power dissipation is the product of
total static current and the supply voltage
P
static
= I
static
.V
DD
(2.4)
Where, I
static
is total static current.
The sub-threshold current:
=
1 −
(2.5)
=
.
(2.6)
Where I
ds0
is the current at threshold and is dependent on process and device
geometry; e
1.8
term is found empirically, n is a process – dependent term affected by
11
Nguyễn Thị Đê
the depletion region characteristics and typically in the range of 1.4-1.5 for CMOS
process.
Figure 2.1: CMOS inverter model for static power dissipation evaluation
We see that the sub-threshold current is exponential function of threshold
voltage, so that it is increasing significantly as threshold voltages have reduced.
Tunneling current caused by high electric field that through gate oxide.
Reverse biased diode leakage current occurs between diffusion regions,
wells, and the substrate.
The reverse biased diode leakage current is expressed by
.
. 1
bias
q V
kT
reverse S
I A J e
(2.8)
Where V
bias
is the reverse bias voltage across the junction, J
S
is the reverse
saturation current density and the A is the junction area.
In advanced technology, magnitude of reverse biased diode leakage is
generally much smaller than the sub-threshold or gate leakage and may be
neglected.
12
Nguyễn Thị Đê
In older technology, static power dissipation was very small comparing with
dynamic power dissipation, so that it often considered as zero. However, in
advanced technology, 130 nm process and beyond, the static power becomes
significant. Eventually, static power dissipation may become comparable to
dynamic power even for high power systems [14][16].
2.1.2. Dynamic Dissipation
The dynamic dissipation component in CMOS circuit is charging the load
capacitance. Suppose a C is load between GND and V
DD
at an average frequency of
f
sw
. Over any given interval of time T, the load will be charged and discharged Tf
sw
time. In one complete charge/discharge cycle, a total charge of Q = CV
DD
is this
transferred from V
DD
to GND.
The average dynamic power dissipation is
=
∫
(
)
=
∫
()
(2.8)
Taking the integral of the current over some interval T as the total charge delivered
during that time, we simplify to
=
[
]
=
(2.9)
Usually, every clock cycle most gates do not switch, so that, it’s useful to
suppose an α as an switch activity factor, we can express switching frequency f
sw
as
a function of α and clock frequency f. Now the dynamic power dissipation may be
rewritten as
=
(2.10)
Activity factor of clock α = 1 because it rises and falls every cycle while data
has a maximum activity factor of 0.5 because it transitions only once each cycle.
13
Nguyễn Thị Đê
Because the signal input has rise/fall time greater than zero, exist a short time
while both nMOS and pMOS transistors will be simultaneously conducting. This
results in an additional “short circuit" current pulse from V
DD
to GND.
Short circuit power dissipation increases as edge rates become slower
because both nMOS and pMOS transistors conduct more time [14].
2.2. Techniques to Reduce Power Dissipation
Power dissipation has become critical to VLSI designers. Power reduction
techniques can be divided into those that reduce dynamic power and those that
reduce static power.
2.2.1. Dynamic Power Reduction
The equation (2.10) shows that dynamic power dissipation is reduced by
decreasing the activity factors, the switching capacitance, the power supply, or the
operating frequency.
It’s very important to reduce activity factor. We can use clock gating
technique to stop portions of the chip that are idle. A large amount of power is
dissipated by the clock network itself, so we can be turned off entire portions of the
clock network where possible. Some techniques can applied in order to reduce
switching activity such as algorithm optimization, architecture optimization,
properly choice of logic topology and logic level optimization.
Capacitance is reduced by choosing small transistors. Interconnect switching
capacitance is most effectively reduced through careful floor-planning, placing
communicating units near each other to reduce wire lengths.
Voltage has a quadratic proportional to dynamic power. Therefore, in order
to reduce significant power dissipation, the circuit should be supplied a lower
14
Nguyễn Thị Đê
voltage. However, the lower voltage can effect to speed of circuit. For example, a
laptop processor may operate at high voltage and high speed when plugged into an
AC adapter, but at lower voltage and speed when on battery power.
Frequency can also be traded for power. However, reducing frequency
energy doesn’t save energy just reduce rate at which it is consumed.
2.2.2. Static Power Reduction
Static power reduction involves minimizing I
static
. Some circuit techniques
such as turning of analog current sources and pseudo-nMOS gates when they are
not needed [14].
Recall that the sub-threshold leakage current for V
gs
< V
t
=
1 −
(2.11)
=
−
+
+
−
(2.12)
We reduce sub-threshold leakage current by increasing the threshold voltage V
t0
,
reducing V
gs
, reducing V
ds
, increasing V
sb
or lowering the temperature.
Other way to control leakage current is through a Variable-Threshold CMOS
(VTCMOS) technique. To reduce overall power dissipation while maintaining
speed performance, a supply voltage (V
DD
) and a threshold voltage (V
t
) are scaled
down in CMOS logic gate circuits. Yet designing a CMOS logic gate with low V
t
transistors will lead to increased sub-threshold leakage, and consequently, to higher
stand-by power dissipation when the output is not switching. One possible way to
overcome this problem is to adjust the threshold voltages of the transistors in order
to avoid leakage in the stand-by mode, by changing the substrate bias.
15
Nguyễn Thị Đê
In VTCMOS circuit technique, the transistors are designed inherently with a
low threshold voltage, and a variable substrate bias control circuit used to generate
the substrate bias voltages of nMOS and pMOS transistors, as show in Figure 2.2.
In active mode, the substrate bias voltage of the nMOS transistor is V
Bn
= 0
and the substrate bias voltage of the pMOS transistor is V
Bp
= V
DD
. The circuit
operates with low V
DD
and low V
T
, benefiting from both low power dissipation (due
to low V
DD
) and high switching speed (due to low V
t
).
In the stand-by mode, however, a lower substrate bias voltage for the nMOS
transistor and a higher substrate bias voltage for the pMOS transistor are generated
by the substrate bias control circuit. As a result, the threshold voltages V
tn
and V
tp
both increase in magnitudes. Since the sub-threshold leakage current drops
exponentially with increasing threshold voltage, the leakage power dissipation in
the stand-by mode can be significantly reduced with this technique.
Figure 2.2: A Variable-Threshold CMOS (VTCMOS) inverter circuit
16
Nguyễn Thị Đê
In order to reduce leakage currents, the VTCMOS technique can also be used
to automatically control the threshold voltages of the transistors, and to compensate
for process-related fluctuations of the threshold voltages.
Controlling threshold voltage values in low V
DD
and low V
t
applications
using the variable threshold CMOS circuit technique is very effective for reducing
the sub-threshold leakage currents. However, this technique usually requires twin-
well or triple-well CMOS technology.
Another technique which can be applied for reducing leakage currents in low
voltage circuits in the stand-by mode is Multiple-Threshold CMOS (MTCMOS)
technique. In this technique, we use two different types of transistors (both nMOS
and pMOS) with two different threshold voltages in the circuit. Where switching
speed is essential, we use low V
t
transistors to design the logic, whereas to prevent
leakage dissipation, high V
t
transistors are used. The generic circuit structure of the
MTCMOS logic gate is shown in Figure 2.3.
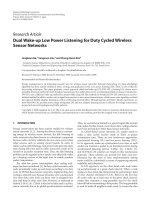
Figure 2.3: Generic structure of a Multiple-Threshold CMOS (MTCMOS)
logic gate
17
Nguyễn Thị Đê
In the active mode, the high V
t
transistors are turned on and the logic gates
consisting of low V
t
transistors can operate with low switching power dissipation
and small propagation delay. When the circuit is driven into stand-by mode, on
other hand, the high V
t
transistors are turned off and the conduction paths for any
sub-threshold leakage currents the may originate from the internal low V
t
circuit are
effectively cut off.
The MTCMOS technique is conceptually easier to apply and to use
compared to the VTCMOS technique, which usually requires a sophisticated
substrate bias control mechanism. It does not require a twin-well or triple-well
CMOS process; the only significant process-related overhead of MTCMOS circuit
is the fabrication of MOS transistors with different threshold voltages on the same
chip. One of the disadvantages of the MTCMOS circuit technique is the presence of
series-connected stand-by transistors, which increase the overall circuit area and
also add extra parasitic capacitance [17].
18
Nguyễn Thị Đê
CHAPTER III
MATLAB SIMULATION OF POWER
DISSIPATION
In this chapter we use the software Matlab to plot static power dissipation
and dynamic power dissipation versus related circuit parameters. The simulation is
rather simple but it gives us the ranges of values quickly.
3.1. MatLab
3.1.1. Why do choose MatLab?
Matlab is powerful software that is widely used in education and research. It
has nice interfaces, pictures that are comfortable for simulation and scientific
calculator. Besides that, it’s is also an easy to used programming language [1].
So that, MatLab is chosen as a programming language in order to simulate
the relationship between power dissipation and related circuit parameters.
3.1.2. A Short Introduction to Matlab
3.1.2.1. How to Start Matlab
Choose the submenu "Programs" from the "Start" menu. From the
"Programs" menu, open the "Matlab" submenu. From the "Matlab" submenu,
choose "Matlab".
19
Nguyễn Thị Đê
3.1.2.2. The Matlab Environment
The Matlab interface consists of menus, buttons and a writing area. The
command window is a location where commands are given to Matlab. The
command window is very useful if Matlab is used as a scientific calculator or as a
graphing tool. Usually, the program code is written in a separate window, and then
run it in the command window.
3.1.2.3. Useful Functions and Operations in Matlab
Table 3.1: Useful operations, functions and constants in Matlab
Operation, function or constant
Matlab
command
+ (addition) +
- (subtraction) -
× (multiplication) *
/ (division) /
square root of x sqrt(x)
e
x
exp(x)
ln x (natural log) log(x)
sin x sin(x)
e (2.71828 ) exp(1)
(3.14159265 ) pi
i
(imaginary unit, sqrt(-1)) i
… …
20
Nguyễn Thị Đê
3.1.2.4. Variables in Matlab
We can easily define our own variables in Matlab.
x=3.5*sin(2.9); y=2*x;
3.1.2.5. Vectors and Matrices in Matlab
We create a vector in Matlab by putting the elements within [] brackets.
Example: x = [ 1 2 3 4 5 6 7 8 9 10], or A = [1 2 3 ; 4 5 6 ; 7 8 9 ],
The vector (1 1.1 1.2 1.3 1.4 1.5) can be created by typing x = [ 1 1.1 1.2 1.3
1.4 1.5 ] or by typing x = 1:0.1:1.5.
3.1.2.6. Plotting with Matlab
Table 3.2: Useful plotting commands in Matlab
Graphing functions Matlab command
Label the horizontal axis. xlabel('text')
Label the vertical axis. ylabel('text')
Attach a title to the plot. title('text')
"Keep plotting in the same window." hold on
Turn off the "keep-plotting-in-the-same-window-command".
hold off
3.2. Relationship between Power Dissipation and Related Circuit Parameters
3.2.1. Static Power Dissipation
From (2.4), we have: P
static
= I
static
.V
DD
21
Nguyễn Thị Đê
3.2.1.1. Relationship between Static Power Dissipation and Static Current
Code:
function P_I()
% Relationship between Static Power Dissipation and Static Current
VDD = 5; % V
I = 1:10; % nA
P = I*VDD; % nW
plot(I,P)
title('Relationship between Static Power Dissipation and Static Current')
xlabel('Static current I (nA)')
ylabel('Static Power Dissipation (nW)')
grid
Simulation Result:
Figure 3.1: Relationship between Static Power Dissipation and Static Current
Remark: Static Power Dissipation is linearly proportional to Static Current
22
Nguyễn Thị Đê
3.2.1.2. Relationship between Static Power Dissipation and Supply Voltage
Code:
function P_V()
% Relationship between Static Power Dissipation and Supply Voltage
VDD = 1:7; % V
I = 1; % nA
P = I*VDD; % nW
plot(VDD,P)
title('Relationship between Static Power Dissipation and Supply Voltage')
xlabel('VDD (V)')
ylabel('Static Power Dissipation (nW)')
grid
Simulation Result:
Figure 3.2: Relationship between Static Power Dissipation and Supply Voltage
Remark: Static Power Dissipation is linearly proportional to Supply Voltage
23
Nguyễn Thị Đê
3.2.2. Dynamic Power Dissipation
From (2.10), we have:
=
3.2.2.1. Relationship between Dynamic Power and Activity Switching
Code:
function P_alpha()
% Relationship between Dynamic Power Dissipation and Activity Switching
VDD = 5; % V
fCLK = 125E6; % Hz
CL = 25*10E-12; % F
Alpha = 0:1;
P = Alpha*CL*VDD^2*fCLK; % W
plot(Alpha,P)
title('Relationship between Dynamic Power Dissipation and Activity
Switching')
xlabel('Activity Switching \alpha')
ylabel('Dynamic Power Dissipation (W)')
grid
Simulation Result:
24
Nguyễn Thị Đê
Figure 3.3: Relationship between Dynamic Power Dissipation and Activity
Switching
Remark: Dynamic Power Dissipation is linearly proportional to Activity
Switching
3.2.2.2. Relationship between Dynamic Power and Load Capacitance
Code:
function P_CL()
% Relationship between Dynamic Power Dissipation and Load Capacitance
Alpha = 0.5;
VDD = 5; % V
fCLK = 125E6; % Hz
CL = 1:25; % pF
P = (Alpha*CL*VDD^2*fCLK)*1E-12; % W
plot(CL,P)
title('Relationship between Dynamic Power Dissipation and Load
Capacitance')
xlabel('Load Capacitance CL (pF)')