Chapter 16 CHEMICAL AND PHASE EQUILIBRIUM
Bạn đang xem bản rút gọn của tài liệu. Xem và tải ngay bản đầy đủ của tài liệu tại đây (1.05 MB, 30 trang )
Chapter 16
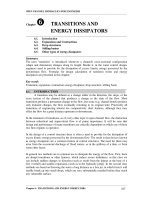
CHEMICAL AND PHASE EQUILIBRIUM
| 793
I
n Chapter 15 we analyzed combustion processes under
the assumption that combustion is complete when there is
sufficient time and oxygen. Often this is not the case,
however. A chemical reaction may reach a state of equilib-
rium before reaching completion even when there is sufficient
time and oxygen.
A system is said to be in equilibrium if no changes occur
within the system when it is isolated from its surroundings.
An isolated system is in mechanical equilibrium if no changes
occur in pressure, in thermal equilibrium if no changes occur
in temperature, in phase equilibrium if no transformations
occur from one phase to another, and in chemical equilib-
rium if no changes occur in the chemical composition of the
system. The conditions of mechanical and thermal equilib-
rium are straightforward, but the conditions of chemical and
phase equilibrium can be rather involved.
The equilibrium criterion for reacting systems is based on
the second law of thermodynamics; more specifically, the
increase of entropy principle. For adiabatic systems, chemical
equilibrium is established when the entropy of the reacting
system reaches a maximum. Most reacting systems encoun-
tered in practice are not adiabatic, however. Therefore, we
need to develop an equilibrium criterion applicable to any
reacting system.
In this chapter, we develop a general criterion for chemical
equilibrium and apply it to reacting ideal-gas mixtures. We
then extend the analysis to simultaneous reactions. Finally,
we discuss phase equilibrium for nonreacting systems.
Objectives
The objectives of Chapter 16 are to:
• Develop the equilibrium criterion for reacting systems based
on the second law of thermodynamics.
• Develop a general criterion for chemical equilibrium
applicable to any reacting system based on minimizing the
Gibbs function for the system.
• Define and evaluate the chemical equilibrium constant.
• Apply the general criterion for chemical equilibrium analysis
to reacting ideal-gas mixtures.
• Apply the general criterion for chemical equilibrium analysis
to simultaneous reactions.
• Relate the chemical equilibrium constant to the enthalpy of
reaction.
• Establish the phase equilibrium for nonreacting systems in
terms of the specific Gibbs function of the phases of a pure
substance.
• Apply the Gibbs phase rule to determine the number of
independent variables associated with a multicomponent,
multiphase system.
• Apply Henry’s law and Raoult’s law for gases dissolved in
liquids.
cen84959_ch16.qxd 5/11/05 10:08 AM Page 793
16–1
■
CRITERION FOR CHEMICAL EQUILIBRIUM
Consider a reaction chamber that contains a mixture of CO, O
2
, and CO
2
at
a specified temperature and pressure. Let us try to predict what will happen
in this chamber (Fig. 16–1). Probably the first thing that comes to mind is a
chemical reaction between CO and O
2
to form more CO
2
:
This reaction is certainly a possibility, but it is not the only possibility. It is
also possible that some CO
2
in the combustion chamber dissociated into CO
and O
2
. Yet a third possibility would be to have no reactions among the
three components at all, that is, for the system to be in chemical equi-
librium. It appears that although we know the temperature, pressure, and
composition (thus the state) of the system, we are unable to predict whether
the system is in chemical equilibrium. In this chapter we develop the neces-
sary tools to correct this.
Assume that the CO, O
2
, and CO
2
mixture mentioned above is in chemical
equilibrium at the specified temperature and pressure. The chemical compo-
sition of this mixture does not change unless the temperature or the pressure
of the mixture is changed. That is, a reacting mixture, in general, has differ-
ent equilibrium compositions at different pressures and temperatures. There-
fore, when developing a general criterion for chemical equilibrium, we
consider a reacting system at a fixed temperature and pressure.
Taking the positive direction of heat transfer to be to the system, the
increase of entropy principle for a reacting or nonreacting system was
expressed in Chapter 7 as
(16–1)
A system and its surroundings form an adiabatic system, and for such systems
Eq. 16–1 reduces to dS
sys
Ն 0. That is, a chemical reaction in an adiabatic
chamber proceeds in the direction of increasing entropy. When the entropy
reaches a maximum, the reaction stops (Fig. 16–2). Therefore, entropy is a
very useful property in the analysis of reacting adiabatic systems.
When a reacting system involves heat transfer, the increase of entropy
principle relation (Eq. 16–1) becomes impractical to use, however, since it
requires a knowledge of heat transfer between the system and its surround-
ings. A more practical approach would be to develop a relation for the
equilibrium criterion in terms of the properties of the reacting system only.
Such a relation is developed below.
Consider a reacting (or nonreacting) simple compressible system of fixed
mass with only quasi-equilibrium work modes at a specified temperature T
and pressure P (Fig. 16–3). Combining the first- and the second-law
relations for this system gives
(16–2)
dQ Ϫ P dV ϭ dU
dS Ն
dQ
T
¶ dU ϩ P dV Ϫ T ds Յ 0
dS
sys
Ն
dQ
T
CO ϩ
1
2
O
2
¬
S
¬
CO
2
794 | Thermodynamics
CO
2
CO
O
2
O
2
O
2
CO
2
CO
2
CO
CO
FIGURE 16–1
A reaction chamber that contains a
mixture of CO
2
, CO, and O
2
at a
specified temperature and pressure.
100%
products
Violation of
second law
S
Equilibrium
composition
100%
reactants
dS = 0
dS
> 0
dS
< 0
FIGURE 16–2
Equilibrium criteria for a chemical
reaction that takes place adiabatically.
W
b
REACTION
CHAMBER
δ
δ
Control
mass
T, P
Q
FIGURE 16–3
A control mass undergoing a chemical
reaction at a specified temperature and
pressure.
cen84959_ch16.qxd 5/11/05 10:08 AM Page 794
The differential of the Gibbs function (G ϭ H Ϫ TS) at constant tempera-
ture and pressure is
(16–3)
From Eqs. 16–2 and 16–3, we have (dG)
T,P
Յ 0. Therefore, a chemical reac-
tion at a specified temperature and pressure proceeds in the direction of a
decreasing Gibbs function. The reaction stops and chemical equilibrium is
established when the Gibbs function attains a minimum value (Fig. 16–4).
Therefore, the criterion for chemical equilibrium can be expressed as
(16–4)
A chemical reaction at a specified temperature and pressure cannot proceed
in the direction of the increasing Gibbs function since this will be a viola-
tion of the second law of thermodynamics. Notice that if the temperature or
the pressure is changed, the reacting system will assume a different equilib-
rium state, which is the state of the minimum Gibbs function at the new
temperature or pressure.
To obtain a relation for chemical equilibrium in terms of the properties of
the individual components, consider a mixture of four chemical components
A, B, C, and D that exist in equilibrium at a specified temperature and pres-
sure. Let the number of moles of the respective components be N
A
, N
B
, N
C
,
and N
D
. Now consider a reaction that occurs to an infinitesimal extent
during which differential amounts of A and B (reactants) are converted to C
and D (products) while the temperature and the pressure remain constant
(Fig. 16–5):
The equilibrium criterion (Eq. 16–4) requires that the change in the Gibbs
function of the mixture during this process be equal to zero. That is,
(16–5)
or
(16–6)
where the g
–
’s are the molar Gibbs functions (also called the chemical poten-
tials) at the specified temperature and pressure and the dN’s are the differen-
tial changes in the number of moles of the components.
To find a relation between the dN’s, we write the corresponding stoichio-
metric (theoretical) reaction
(16–7)
where the n’s are the stoichiometric coefficients, which are evaluated easily
once the reaction is specified. The stoichiometric reaction plays an impor-
tant role in the determination of the equilibrium composition of the reacting
n
A
A ϩ n
B
B
∆
n
C
C ϩ n
D
D
g
Ϫ
C¬
dN
C
ϩ g
Ϫ
D¬
dN
D
ϩ g
Ϫ
A¬
dN
A
ϩ g
Ϫ
B¬
dN
B
ϭ 0
1dG 2
T,P
ϭ
a
1dG
i
2
T,P
ϭ
a
1g
Ϫ
i¬
dN
i
2
T,P
ϭ 0
dN
A
A ϩ dN
B
B
¬
¡
¬
dN
C
C ϩ dN
D
D
1dG 2
T,P
ϭ 0
ϭ dU ϩ P dV Ϫ T dS
ϭ 1dU ϩ P dV ϩ V dP2Ϫ T dS Ϫ S dT
1dG 2
T,P
ϭ dH Ϫ T dS Ϫ S dT
Chapter 16 | 795
100%
products
Violation of
second law
G
Equilibrium
composition
100%
reactants
dG = 0
dG < 0 dG > 0
FIGURE 16–4
Criteria for chemical equilibrium for a
fixed mass at a specified temperature
and pressure.
REACTION
CHAMBER
T, P
N
A
moles of A
N
B
moles of B
N
C
moles of C
N
D
moles of D
dN
A
A + dN
B
B → dN
C
C + dN
D
D
FIGURE 16–5
An infinitesimal reaction in a chamber
at constant temperature and pressure.
→
0
→
0
cen84959_ch16.qxd 5/11/05 10:08 AM Page 795
mixtures because the changes in the number of moles of the components are
proportional to the stoichiometric coefficients (Fig. 16–6). That is,
(16–8)
where e is the proportionality constant and represents the extent of a reac-
tion. A minus sign is added to the first two terms because the number of
moles of the reactants A and B decreases as the reaction progresses.
For example, if the reactants are C
2
H
6
and O
2
and the products are CO
2
and H
2
O, the reaction of 1 mmol (10
Ϫ6
mol) of C
2
H
6
results in a 2-mmol
increase in CO
2
,a 3-mmol increase in H
2
O, and a 3.5-mmol decrease in O
2
in accordance with the stoichiometric equation
That is, the change in the number of moles of a component is one-millionth
(e ϭ 10
Ϫ6
) of the stoichiometric coefficient of that component in this case.
Substituting the relations in Eq. 16–8 into Eq. 16–6 and canceling e,we
obtain
(16–9)
This equation involves the stoichiometric coefficients and the molar Gibbs
functions of the reactants and the products, and it is known as the criterion
for chemical equilibrium. It is valid for any chemical reaction regardless
of the phases involved.
Equation 16–9 is developed for a chemical reaction that involves two
reactants and two products for simplicity, but it can easily be modified to
handle chemical reactions with any number of reactants and products. Next
we analyze the equilibrium criterion for ideal-gas mixtures.
16–2
■
THE EQUILIBRIUM CONSTANT
FOR IDEAL-GAS MIXTURES
Consider a mixture of ideal gases that exists in equilibrium at a specified
temperature and pressure. Like entropy, the Gibbs function of an ideal gas
depends on both the temperature and the pressure. The Gibbs function val-
ues are usually listed versus temperature at a fixed reference pressure P
0
,
which is taken to be 1 atm. The variation of the Gibbs function of an ideal
gas with pressure at a fixed temperature is determined by using the defini-
tion of the Gibbs function and the entropy-change relation
for isothermal processes . It yields
Thus the Gibbs function of component i of an ideal-gas mixture at its partial
pressure P
i
and mixture temperature T can be expressed as
(16–10)
g
Ϫ
i
1T, P
i
2ϭ g
Ϫ
*
i
1T 2ϩ R
u
T ln P
i
1¢g
Ϫ
2
T
ϭ ¢h
Ϫ
Ϫ T 1¢ s
Ϫ
2
T
ϭϪT 1¢ s
Ϫ
2
T
ϭ R
u
T ln
P
2
P
1
3¢ s
Ϫ
ϭϪR
u
ln 1P
2
>P
1
24
1g
Ϫ
ϭ h
Ϫ
Ϫ Ts
Ϫ
2
n
C
g
Ϫ
C
ϩ n
D
g
Ϫ
D
Ϫ n
A
g
Ϫ
A
Ϫ n
B
g
Ϫ
B
ϭ 0
C
2
H
6
ϩ 3.5O
2
¬
S
¬
2CO
2
ϩ 3H
2
O
dN
A
ϭϪen
A
dN
C
ϭ en
C
dN
B
ϭϪen
B
dN
D
ϭ en
D
796 | Thermodynamics
0.1H
2
→ 0.2H
H
2
→ 2H
H
2
= 1
H
= 2
0.01H
2
→ 0.02H
0.001H
2
→ 0.002H
n
n
FIGURE 16–6
The changes in the number of moles
of the components during a chemical
reaction are proportional to the
stoichiometric coefficients regardless
of the extent of the reaction.
→
0
cen84959_ch16.qxd 5/11/05 10:08 AM Page 796
where g
–
i
* (T) represents the Gibbs function of component i at 1 atm pres-
sure and temperature T, and P
i
represents the partial pressure of component
i in atmospheres. Substituting the Gibbs function expression for each com-
ponent into Eq. 16–9, we obtain
For convenience, we define the standard-state Gibbs function change as
(16–11)
Substituting, we get
(16–12)
Now we define the equilibrium constant K
P
for the chemical equilibrium
of ideal-gas mixtures as
(16–13)
Substituting into Eq. 16–12 and rearranging, we obtain
(16–14)
Therefore, the equilibrium constant K
P
of an ideal-gas mixture at a specified
temperature can be determined from a knowledge of the standard-state
Gibbs function change at the same temperature. The K
P
values for several
reactions are given in Table A–28.
Once the equilibrium constant is available, it can be used to determine the
equilibrium composition of reacting ideal-gas mixtures. This is accom-
plished by expressing the partial pressures of the components in terms of
their mole fractions:
where P is the total pressure and N
total
is the total number of moles present
in the reaction chamber, including any inert gases. Replacing the partial
pressures in Eq. 16–13 by the above relation and rearranging, we obtain
(Fig. 16–7)
(16–15)
where
Equation 16–15 is written for a reaction involving two reactants and two
products, but it can be extended to reactions involving any number of reac-
tants and products.
¢n ϭ n
C
ϩ n
D
Ϫ n
A
Ϫ n
B
K
P
ϭ
N
C
n
C
N
D
n
D
N
A
n
A
N
B
n
B
a
P
N
total
b
¢n
P
i
ϭ y
i
P ϭ
N
i
N
total
P
K
P
ϭ e
Ϫ¢G*1T2>R
u
T
K
P
ϭ
P
C
n
C
P
D
n
D
P
A
n
A
P
B
n
B
¢G* 1T 2ϭϪR
u
T 1n
C
ln P
C
ϩ n
D
ln P
D
Ϫ n
A
ln P
A
Ϫ n
B
ln P
B
2ϭϪR
u
T ln
P
C
n
C
P
D
n
D
P
A
n
A
P
B
n
B
¢G* 1T2ϭ n
C
g
Ϫ
*
C
1T 2ϩ n
D
g
Ϫ
*
D
1T 2Ϫ n
A
g
Ϫ
*
A
1T 2Ϫ n
B
g
Ϫ
*
B
1T 2
Ϫn
A
3g
Ϫ
*
A
1T 2ϩ R
u
T ln P
A
4Ϫ n
B
3g
Ϫ
*
B
1T 2ϩ R
u
T ln P
B
4ϭ 0
n
C
3g
Ϫ
*
C
1T 2ϩ R
u
T ln P
C
4ϩ n
D
3g
Ϫ
D
*
1T 2ϩ R
u
T ln P
D
4
Chapter 16 | 797
(1) In terms of partial pressures
K
P
=
P
C
P
D
CD
P
A
P
B
AB
(3) In terms of the equilibrium
composition
K
P
=
N
C
N
D
(
N
A
N
B
A
B
(
N
total
P
∆
(2) In terms of ∆G*(T)
K
P
= e
–∆
G*(T)/R T
C
D
u
nn
nn
nn
nn
n
FIGURE 16–7
Three equivalent K
P
relations for
reacting ideal-gas mixtures.
cen84959_ch16.qxd 5/11/05 10:08 AM Page 797
798 | Thermodynamics
EXAMPLE 16–1 Equilibrium Constant of a Dissociation Process
Using Eq. 16–14 and the Gibbs function data, determine the equilibrium
constant K
P
for the dissociation process N
2
→ 2N at 25°C. Compare your
result to the K
P
value listed in Table A–28.
Solution The equilibrium constant of the reaction N
2
→ 2N is listed in
Table A–28 at different temperatures. It is to be verified using Gibbs func-
tion data.
Assumptions 1 The constituents of the mixture are ideal gases. 2 The equi-
librium mixture consists of N
2
and N only.
Properties The equilibrium constant of this reaction at 298 K is ln K
P
ϭ
Ϫ367.5 (Table A–28). The Gibbs function of formation at 25°C and 1 atm is
O for N
2
and 455,510 kJ/kmol for N (Table A–26).
Analysis In the absence of K
P
tables, K
P
can be determined from the Gibbs
function data and Eq. 16–14,
where, from Eq. 16–11,
Substituting, we find
or
The calculated K
P
value is in agreement with the value listed in Table A–28.
The K
P
value for this reaction is practically zero, indicating that this reaction
will not occur at this temperature.
Discussion Note that this reaction involves one product (N) and one reactant
(N
2
), and the stoichiometric coefficients for this reaction are n
N
ϭ 2 and
n
N
2
ϭ 1. Also note that the Gibbs function of all stable elements (such as N
2
)
is assigned a value of zero at the standard reference state of 25°C and 1 atm.
The Gibbs function values at other temperatures can be calculated from the
enthalpy and absolute entropy data by using the definition of the Gibbs func-
tion, , where .
h
Ϫ
1T 2ϭ h
Ϫ
*
f
ϩ h
Ϫ
T
Ϫ h
Ϫ
298 K
g
Ϫ
* 1T 2ϭ h
Ϫ
1T 2Ϫ Ts
Ϫ
* 1T 2
K
P
Х 2 ؋ 10
؊160
ϭϪ367.5
ln K
P
ϭϪ
911,020 kJ>kmol
18.314 kJ>kmol
#
K21298.15 K2
ϭ 911,020 kJ>kmol
ϭ 12 21455,510 kJ>kmol2Ϫ 0
¢G* 1T2ϭ n
N
g
Ϫ
*
N
1T 2Ϫ n
N
2
g
Ϫ
*
N
2
1T 2
K
P
ϭ e
Ϫ¢G*1T2>R
u
T
EXAMPLE 16–2 Dissociation Temperature of Hydrogen
Determine the temperature at which 10 percent of diatomic hydrogen (H
2
)
dissociates into monatomic hydrogen (H) at a pressure of 10 atm.
Solution The temperature at which 10 percent of H
2
dissociates into 2H is
to be determined.
Assumptions 1 The constituents of the mixture are ideal gases. 2 The equi-
librium mixture consists of H
2
and H only.
cen84959_ch16.qxd 5/11/05 10:08 AM Page 798
A double arrow is used in equilibrium equations as an indication that a
chemical reaction does not stop when chemical equilibrium is established;
rather, it proceeds in both directions at the same rate. That is, at equilibrium,
the reactants are depleted at exactly the same rate as they are replenished
from the products by the reverse reaction.
16–3
■
SOME REMARKS ABOUT THE K
P
OF IDEAL-GAS MIXTURES
In the last section we developed three equivalent expressions for the equilib-
rium constant K
P
of reacting ideal-gas mixtures: Eq. 16–13, which expresses
K
P
in terms of partial pressures; Eq. 16–14, which expresses K
P
in terms of
the standard-state Gibbs function change ∆G*(T); and Eq. 16–15, which
expresses K
P
in terms of the number of moles of the components. All three
relations are equivalent, but sometimes one is more convenient to use than
the others. For example, Eq. 16–15 is best suited for determining the equi-
librium composition of a reacting ideal-gas mixture at a specified tem-
perature and pressure. On the basis of these relations, we may draw the
following conclusions about the equilibrium constant K
P
of ideal-gas
mixtures:
1. The K
P
of a reaction depends on temperature only. It is independent of
the pressure of the equilibrium mixture and is not affected by the presence
of inert gases. This is because K
P
depends on ∆G*(T), which depends on
Chapter 16 | 799
Analysis This is a dissociation process that is significant at very high tem-
peratures only. For simplicity we consider 1 kmol of H
2
, as shown in Fig.
16–8. The stoichiometric and actual reactions in this case are as follows:
Stoichiometric:
Actual:
reactants products
(leftover)
A double-headed arrow is used for the stoichiometric reaction to differentiate
it from the actual reaction. This reaction involves one reactant (H
2
) and one
product (H). The equilibrium composition consists of 0.9 kmol of H
2
(the
leftover reactant) and 0.2 kmol of H (the newly formed product). Therefore,
N
H
2
ϭ 0.9 and N
H
ϭ 0.2 and the equilibrium constant K
P
is determined
from Eq. 16–15 to be
From Table A–28, the temperature corresponding to this K
P
value is
Discussion We conclude that 10 percent of H
2
dissociates into H when the
temperature is raised to 3535 K. If the temperature is increased further, the
percentage of H
2
that dissociates into H will also increase.
T ϭ 3535 K
K
P
ϭ
N
H
n
H
N
H
2
n
H
2
a
P
N
total
b
n
H
Ϫn
H
2
ϭ
10.2 2
2
0.9
a
10
0.9 ϩ 0.2
b
2Ϫ1
ϭ 0.404
H
2
¡
0.9H
2
ϩ 0.2H
H
2
¬
∆
¬
2H
¬
1thus n
H
2
ϭ 1 and n
H
ϭ 22
1 kmol H
2
10 atm
Initial
composition
0.9H
2
0.2H
Equilibrium
composition
FIGURE 16–8
Schematic for Example 16–2.
123
123
cen84959_ch16.qxd 5/11/05 10:08 AM Page 799
temperature only, and the ∆G*(T) of inert gases is zero (see Eq. 16–14).
Thus, at a specified temperature the following four reactions have the same
K
P
value:
at 1 atm
at 5 atm
at 3 atm
at 2 atm
2. The K
P
of the reverse reaction is 1/K
P
. This is easily seen from Eq.
16–13. For reverse reactions, the products and reactants switch places, and
thus the terms in the numerator move to the denominator and vice versa.
Consequently, the equilibrium constant of the reverse reaction becomes
1/K
P
. For example, from Table A–28,
3. The larger the K
P
, the more complete the reaction. This is also apparent
from Fig. 16–9 and Eq. 16–13. If the equilibrium composition consists
largely of product gases, the partial pressures of the products (P
C
and P
D
)
are considerably larger than the partial pressures of the reactants (P
A
and
P
B
), which results in a large value of K
P
. In the limiting case of a complete
reaction (no leftover reactants in the equilibrium mixture), K
P
approaches
infinity. Conversely, very small values of K
P
indicate that a reaction does
not proceed to any appreciable degree. Thus reactions with very small K
P
values at a specified temperature can be neglected.
A reaction with K
P
Ͼ 1000 (or ln K
P
Ͼ 7) is usually assumed to proceed
to completion, and a reaction with K
P
Ͻ 0.001 (or ln K
P
Ͻ Ϫ7) is assumed
not to occur at all. For example, ln K
P
ϭϪ6.8 for the reaction N
2
∆
2N
at 5000 K. Therefore, the dissociation of N
2
into monatomic nitrogen (N)
can be disregarded at temperatures below 5000 K.
4. The mixture pressure affects the equilibrium composition (although it
does not affect the equilibrium constant K
P
). This can be seen from
Eq. 16–15, which involves the term P
∆n
, where ∆n ϭ ͚ n
P
Ϫ ͚ n
R
(the dif-
ference between the number of moles of products and the number of moles
of reactants in the stoichiometric reaction). At a specified temperature, the
K
P
value of the reaction, and thus the right-hand side of Eq. 16–15, remains
constant. Therefore, the mole numbers of the reactants and the products
must change to counteract any changes in the pressure term. The direction
of the change depends on the sign of ∆n. An increase in pressure at a speci-
fied temperature increases the number of moles of the reactants and
decreases the number of moles of products if ∆n is positive, have the oppo-
site effect if ∆n is negative, and have no effect if ∆n is zero.
5. The presence of inert gases affects the equilibrium composition (although
it does not affect the equilibrium constant K
P
). This can be seen from Eq.
16–15, which involves the term (1/N
total
)
∆n
, where N
total
is the total number
of moles of the ideal-gas mixture at equilibrium, including inert gases. The
sign of ∆n determines how the presence of inert gases influences the equi-
librium composition (Fig. 16–10). An increase in the number of moles of
inert gases at a specified temperature and pressure decreases the number of
K
P
ϭ 8.718 ϫ 10
Ϫ11
¬¬
for
¬¬¬
H
2
O
∆
H
2
ϩ
1
2
O
2
¬
at 1000 K
K
P
ϭ 0.1147 ϫ 10
11
¬¬
for
¬
H
2
ϩ
1
2
O
2
∆
H
2
O
¬¬¬
at 1000 K
H
2
ϩ 2O
2
ϩ 5N
2
∆
H
2
O ϩ 1.5O
2
ϩ 5N
2
H
2
ϩ
1
2
O
2
ϩ 3N
2
∆
H
2
O ϩ 3N
2
H
2
ϩ
1
2
O
2
∆
H
2
O
H
2
ϩ
1
2
O
2
∆
H
2
O
800 | Thermodynamics
4000
5000
1000
2000
3000
T, K
P = 1 atm
6000
5.17 ϫ 10
–18
2.65 ϫ 10
–6
2.545
41.47
0.025
267.7
76.80
97.70
0.00
0.16
14.63
99.63
K
P
% mol H
H
2
→ 2H
FIGURE 16–9
The larger the K
P
, the more complete
the reaction.
1 mol H
2
Initial
composition
Equilibrium
composition at
3000 K, 1 atm
(a)
(b)
1 mol N
2
1 mol H
2
K
P
= 0.0251
0.158 mol H
0.921 mol H
2
K
P
= 0.0251
1.240 mol H
0.380 mol H
2
1 mol N
2
FIGURE 16–10
The presence of inert gases does not
affect the equilibrium constant, but it
does affect the equilibrium
composition.
cen84959_ch16.qxd 5/11/05 10:08 AM Page 800
moles of the reactants and increases the number of moles of products if ∆n
is positive, have the opposite effect if ∆n is negative, and have no effect if
∆n is zero.
6. When the stoichiometric coefficients are doubled, the value of K
P
is
squared. Therefore, when one is using K
P
values from a table, the stoichio-
metric coefficients (the n’s) used in a reaction must be exactly the same
ones appearing in the table from which the K
P
values are selected. Multiply-
ing all the coefficients of a stoichiometric equation does not affect the mass
balance, but it does affect the equilibrium constant calculations since the
stoichiometric coefficients appear as exponents of partial pressures in
Eq. 16–13. For example,
For
But for
7. Free electrons in the equilibrium composition can be treated as an ideal
gas. At high temperatures (usually above 2500 K), gas molecules start to
dissociate into unattached atoms (such as H
2
∆
2H), and at even higher
temperatures atoms start to lose electrons and ionize, for example,
(16–16)
The dissociation and ionization effects are more pronounced at low pres-
sures. Ionization occurs to an appreciable extent only at very high tempera-
tures, and the mixture of electrons, ions, and neutral atoms can be treated as
an ideal gas. Therefore, the equilibrium composition of ionized gas mixtures
can be determined from Eq. 16–15 (Fig. 16–11). This treatment may not be
adequate in the presence of strong electric fields, however, since the elec-
trons may be at a different temperature than the ions in this case.
8. Equilibrium calculations provide information on the equilibrium compo-
sition of a reaction, not on the reaction rate. Sometimes it may even take
years to achieve the indicated equilibrium composition. For example, the
equilibrium constant of the reaction at 298 K is about
10
40
, which suggests that a stoichiometric mixture of H
2
and O
2
at room
temperature should react to form H
2
O, and the reaction should go to com-
pletion. However, the rate of this reaction is so slow that it practically does
not occur. But when the right catalyst is used, the reaction goes to comple-
tion rather quickly to the predicted value.
H
2
ϩ
1
2
O
2
∆
H
2
O
H
∆
H
ϩ
ϩ e
Ϫ
2H
2
ϩ O
2
∆
2H
2
O
¬¬
K
P
2
ϭ
P
2
H
2
O
P
2
H
2
P
O2
ϭ 1K
P
1
2
2
H
2
ϩ
1
2
O
2
∆
H
2
O K
P
1
ϭ
P
H
2
O
P
H
2
P
1>2
O
2
Chapter 16 | 801
EXAMPLE 16–3 Equilibrium Composition
at a Specified Temperature
A mixture of 2 kmol of CO and 3 kmol of O
2
is heated to 2600 K at a pres-
sure of 304 kPa. Determine the equilibrium composition, assuming the mix-
ture consists of CO
2
, CO, and O
2
(Fig. 16–12).
Solution A reactive gas mixture is heated to a high temperature. The equi-
librium composition at that temperature is to be determined.
2 kmol CO
Initial
composition
x CO
2
Equilibrium
composition at
2600 K, 304 kPa
y CO
z O
2
3 kmol O
2
FIGURE 16–12
Schematic for Example 16–3.
where
N
total
= N
H
+ N
H
+
+ N
e
–
K
P
=
H → H
+
+ e
–
∆ =
H
+
+
e
–
–
H
= 1 + 1 – 1
= 1
N
H
+
N
e
–
∆
N
total
(
(
N
H
H
+
e
–
P
H
n
nn
n
nn n n
FIGURE 16–11
Equilibrium-constant relation for the
ionization reaction of hydrogen.
cen84959_ch16.qxd 5/11/05 10:08 AM Page 801
802 | Thermodynamics
Assumptions 1 The equilibrium composition consists of CO
2
, CO, and O
2
.
2 The constituents of the mixture are ideal gases.
Analysis The stoichiometric and actual reactions in this case are as follows:
Stoichiometric:
Actual:
products reactants
(leftover)
C balance:
O balance:
Total number of moles:
Pressure:
The closest reaction listed in Table A–28 is CO
2
∆
CO ϩ
1
–
2
O
2
, for which
ln K
P
ϭϪ2.801 at 2600 K. The reaction we have is the inverse of this, and
thus ln K
P
ϭϩ2.801, or K
P
ϭ 16.461 in our case.
Assuming ideal-gas behavior for all components, the equilibrium constant
relation (Eq. 16–15) becomes
Substituting, we get
Solving for x yields
Then
Therefore, the equilibrium composition of the mixture at 2600 K and 304
kPa is
Discussion In solving this problem, we disregarded the dissociation of O
2
into O according to the reaction O
2
→ 2O, which is a real possibility at high
temperatures. This is because ln K
P
ϭϪ7.521 at 2600 K for this reaction,
which indicates that the amount of O
2
that dissociates into O is negligible.
(Besides, we have not learned how to deal with simultaneous reactions yet.
We will do so in the next section.)
1.906CO
2
؉ 0.094CO ؉ 2.074O
2
z ϭ 3 Ϫ
x
2
ϭ 2.047
y ϭ 2 Ϫ x ϭ 0.094
x ϭ 1.906
16.461 ϭ
x
12 Ϫ x 213 Ϫ x>22
1>2
a
3
5 Ϫ x>2
b
Ϫ1>2
K
P
ϭ
N
CO
2
n
CO
2
N
CO
n
CO
N
O
2
n
O
2
a
P
N
total
b
n
CO
2
Ϫn
CO
Ϫn
O
2
P ϭ 304 kPa ϭ 3.0 atm
N
total
ϭ x ϩ y ϩ z ϭ 5 Ϫ
x
2
8 ϭ 2x ϩ y ϩ 2z
¬
or z ϭ 3 Ϫ
x
2
2 ϭ x ϩ y
¬
or y ϭ 2 Ϫ x
2CO ϩ 3O
2
¡
xCO
2
ϩ yCO ϩ zO
2
CO ϩ
1
2
O
2
∆
CO
2
1thus n
CO
2
ϭ 1, n
CO
ϭ 1, and n
O
2
ϭ
1
2
2
123
1552553
cen84959_ch16.qxd 5/11/05 10:08 AM Page 802
Chapter 16 | 803
EXAMPLE 16–4 Effect of Inert Gases on Equilibrium
Composition
A mixture of 3 kmol of CO, 2.5 kmol of O
2
, and 8 kmol of N
2
is heated to
2600 K at a pressure of 5 atm. Determine the equilibrium composition of
the mixture (Fig. 16–13).
Solution A gas mixture is heated to a high temperature. The equilibrium
composition at the specified temperature is to be determined.
Assumptions 1 The equilibrium composition consists of CO
2
, CO, O
2
, and
N
2
. 2 The constituents of the mixture are ideal gases.
Analysis This problem is similar to Example 16–3, except that it involves
an inert gas N
2
. At 2600 K, some possible reactions are O
2
∆
2O (ln K
P
ϭϪ7.521), N
2
∆
2N (ln K
P
ϭϪ28.304),
1
–
2
O
2
ϩ
1
–
2
N
2
∆
NO (ln K
P
ϭ
Ϫ2.671), and CO ϩ
1
–
2
O
2
∆
CO
2
(ln K
P
ϭ 2.801 or K
P
ϭ 16.461). Based
on these K
P
values, we conclude that the O
2
and N
2
will not dissociate to
any appreciable degree, but a small amount will combine to form some
oxides of nitrogen. (We disregard the oxides of nitrogen in this example, but
they should be considered in a more refined analysis.) We also conclude that
most of the CO will combine with O
2
to form CO
2
. Notice that despite the
changes in pressure, the number of moles of CO and O
2
and the presence of
an inert gas, the K
P
value of the reaction is the same as that used in Exam-
ple 16–3.
The stoichiometric and actual reactions in this case are
Stoichiometric:
Actual:
products reactants inert
(leftover)
C balance:
O balance:
Total number of moles:
Assuming ideal-gas behavior for all components, the equilibrium constant
relation (Eq. 16–15) becomes
Substituting, we get
Solving for x yields
x ϭ 2.754
16.461 ϭ
x
13 Ϫ x 212.5 Ϫ x>22
1>2
a
5
13.5 Ϫ x>2
b
Ϫ1>2
K
P
ϭ
N
CO
2
n
CO
2
N
CO
n
CO
N
O
2
n
O
2
a
P
N
total
b
n
CO
2
Ϫn
CO
Ϫn
O
2
N
total
ϭ x ϩ y ϩ z ϩ 8 ϭ 13.5 Ϫ
x
2
8 ϭ 2x ϩ y ϩ 2z
¬
or z ϭ 2.5 Ϫ
x
2
3 ϭ x ϩ y
¬
or y ϭ 3 Ϫ x
3CO ϩ 2.5O
2
ϩ 8N
2
¡
xCO
2
ϩ yCO ϩ zO
2
ϩ 8N
2
CO ϩ
1
2
O
2
∆
CO
2
1thus n
CO
2
ϭ 1, n
CO
ϭ 1, and n
O
2
ϭ
1
2
2
3 kmol CO
Initial
composition
x CO
2
Equilibrium
composition at
2600 K, 5 atm
y CO
z O
2
8 kmol N
2
2.5 kmol O
2
8 N
2
FIGURE 16–13
Schematic for Example 16–4.
123
123
152553
cen84959_ch16.qxd 5/11/05 10:08 AM Page 803
16–4
■
CHEMICAL EQUILIBRIUM
FOR SIMULTANEOUS REACTIONS
The reacting mixtures we have considered so far involved only one reaction,
and writing a K
P
relation for that reaction was sufficient to determine the
equilibrium composition of the mixture. However, most practical chemical
reactions involve two or more reactions that occur simultaneously, which
makes them more difficult to deal with. In such cases, it becomes necessary
to apply the equilibrium criterion to all possible reactions that may occur in
the reaction chamber. When a chemical species appears in more than one
reaction, the application of the equilibrium criterion, together with the mass
balance for each chemical species, results in a system of simultaneous equa-
tions from which the equilibrium composition can be determined.
We have shown earlier that a reacting system at a specified temperature
and pressure achieves chemical equilibrium when its Gibbs function reaches
a minimum value, that is, (dG)
T,P
ϭ 0. This is true regardless of the number
of reactions that may be occurring. When two or more reactions are
involved, this condition is satisfied only when (dG)
T,P
ϭ 0 for each reaction.
Assuming ideal-gas behavior, the K
P
of each reaction can be determined
from Eq. 16–15, with N
total
being the total number of moles present in the
equilibrium mixture.
The determination of the equilibrium composition of a reacting mixture
requires that we have as many equations as unknowns, where the unknowns
are the number of moles of each chemical species present in the equilibrium
mixture. The mass balance of each element involved provides one equation.
The rest of the equations must come from the K
P
relations written for each
reaction. Thus we conclude that the number of K
P
relations needed to deter-
mine the equilibrium composition of a reacting mixture is equal to the
number of chemical species minus the number of elements present in equi-
librium. For an equilibrium mixture that consists of CO
2
, CO, O
2
, and O,
for example, two K
P
relations are needed to determine the equilibrium
composition since it involves four chemical species and two elements
(Fig. 16–14).
The determination of the equilibrium composition of a reacting mixture in
the presence of two simultaneous reactions is here with an example.
804 | Thermodynamics
Then
Therefore, the equilibrium composition of the mixture at 2600 K and 5 atm is
Discussion Note that the inert gases do not affect the K
P
value or the K
P
relation for a reaction, but they do affect the equilibrium composition.
2.754CO
2
؉ 0.246CO ؉ 1.123O
2
؉ 8N
2
z ϭ 2.5 Ϫ
x
2
ϭ 1.123
y ϭ 3 Ϫ x ϭ 0.246
Composition: COComposition: CO
2
, CO, O, CO, O
2
, O, O
No. of components: 4No. of components: 4
No. of elements: 2No. of elements: 2
No. of No. of K
p
relations needed: 4 relations needed: 4 – 2 = 2 2 = 2
FIGURE 16–14
The number of K
P
relations needed to
determine the equilibrium composition
of a reacting mixture is the difference
between the number of species and the
number of elements.
cen84959_ch16.qxd 5/11/05 10:08 AM Page 804
Chapter 16 | 805
EXAMPLE 16–5 Equilibrium Composition
for Simultaneous Reactions
A mixture of 1 kmol of H
2
O and 2 kmol of O
2
is heated to 4000 K at a pres-
sure of 1 atm. Determine the equilibrium composition of this mixture,
assuming that only H
2
O, OH, O
2
, and H
2
are present (Fig. 16–15).
Solution A gas mixture is heated to a specified temperature at a specified
pressure. The equilibrium composition is to be determined.
Assumptions 1 The equilibrium composition consists of H
2
O, OH, O
2
, and
H
2
. 2 The constituents of the mixture are ideal gases.
Analysis The chemical reaction during this process can be expressed as
Mass balances for hydrogen and oxygen yield
H balance: (1)
O balance: (2)
The mass balances provide us with only two equations with four unknowns,
and thus we need to have two more equations (to be obtained from the K
P
relations) to determine the equilibrium composition of the mixture. It
appears that part of the H
2
O in the products is dissociated into H
2
and OH
during this process, according to the stoichiometric reactions
The equilibrium constants for these two reactions at 4000 K are determined
from Table A–28 to be
The K
P
relations for these two simultaneous reactions are
where
Substituting yields
(3)
(4) 0.9570 ϭ
1w 21y2
1>2
x
a
1
x ϩ y ϩ z ϩ w
b
1>2
0.5816 ϭ
1y 21z2
1>2
x
a
1
x ϩ y ϩ z ϩ w
b
1>2
N
total
ϭ N
H
2
O
ϩ N
H
2
ϩ N
O
2
ϩ N
OH
ϭ x ϩ y ϩ z ϩ w
K
P
2
ϭ
N
H
2
n
H
2
N
OH
n
OH
N
H
2
O
n
H
2
O
a
P
N
total
b
n
H
2
ϩn
OH
Ϫn
H
2
O
K
P
1
ϭ
N
H
2
n
H
2
N
O
2
n
O
2
N
H
2
O
n
H
2
O
a
P
N
total
b
n
H
2
ϩn
O
2
Ϫn
H
2
O
ln K
P
2
ϭϪ0.044
¡
K
P
2
ϭ 0.9570
ln K
P
1
ϭϪ0.542
¡
K
P
1
ϭ 0.5816
H
2
O
∆
1
2
H
2
ϩ OH
¬¬
1reaction 2 2
H
2
O
∆
H
2
ϩ
1
2
O
2
1reaction 1 2
5 ϭ x ϩ 2z ϩ w
2 ϭ 2x ϩ 2y ϩ w
H
2
O ϩ 2O
2
¡
xH
2
O ϩ yH
2
ϩ zO
2
ϩ wOH
1 kmol H
2
O
Initial
composition
x H
2
O
Equilibrium
composition at
4000 K, 1 atm
y H
2
z O
2
2 kmol O
2
w OH
FIGURE 16–15
Schematic for Example 16–5.
cen84959_ch16.qxd 5/11/05 10:08 AM Page 805
Solving a system of simultaneous nonlinear equations is extremely tedious
and time-consuming if it is done by hand. Thus it is often necessary to solve
these kinds of problems by using an equation solver such as EES.
16–5
■
VARIATION OF K
P
WITH TEMPERATURE
It was shown in Section 16–2 that the equilibrium constant K
P
of an ideal
gas depends on temperature only, and it is related to the standard-state
Gibbs function change ∆G*(T) through the relation (Eq. 16–14)
In this section we develop a relation for the variation of K
P
with temperature
in terms of other properties.
Substituting ∆G*(T) ϭ ∆H*(T) Ϫ T ∆S*(T) into the above relation and
differentiating with respect to temperature, we get
At constant pressure, the second Tdsrelation, Tdsϭ dh Ϫ v dP, reduces to
Tdsϭ dh. Also, T d(∆S*) ϭ d(∆H*) since ∆S* and ∆H* consist of entropy
and enthalpy terms of the reactants and the products. Therefore, the last two
terms in the above relation cancel, and it reduces to
(16–17)
where is the enthalpy of reaction at temperature T. Notice that we
dropped the superscript * (which indicates a constant pressure of 1 atm)
from ∆H(T), since the enthalpy of an ideal gas depends on temperature only
and is independent of pressure. Equation 16–17 is an expression of the vari-
ation of K
P
with temperature in terms of , and it is known as the van’t
Hoff equation. To integrate it, we need to know how varies with T. For
small temperature intervals, can be treated as a constant and Eq. 16–17
can be integrated to yield
(16–18)
ln
K
P
2
K
P
1
Х
h
Ϫ
R
R
u
a
1
T
1
Ϫ
1
T
2
b
h
Ϫ
R
h
R
h
R
1T 2
h
R
1T 2
d 1ln K
p
2
dT
ϭ
¢H* 1T2
R
u
T
2
ϭ
h
Ϫ
R
1T 2
R
u
T
2
d 1ln K
p
2
dT
ϭ
¢H* 1T2
R
u
T
2
Ϫ
d 3¢H* 1T 24
R
u
T dT
ϩ
d 3¢S* 1T 24
R
u
dT
ln K
P
ϭϪ
¢G* 1T2
R
u
T
806 | Thermodynamics
Solving Eqs. (1), (2), (3), and (4) simultaneously for the four unknowns x, y,
z, and w yields
Therefore, the equilibrium composition of 1 kmol H
2
O and 2 kmol O
2
at
1 atm and 4000 K is
Discussion We could also solve this problem by using the K
P
relation for the
stoichiometric reaction O
2
∆
2O as one of the two equations.
0.271H
2
O ؉ 0.213H
2
؉ 1.849O
2
؉ 1.032OH
z ϭ 1.849
¬¬
w ϭ 1.032
x ϭ 0.271 y ϭ 0.213
cen84959_ch16.qxd 5/11/05 10:08 AM Page 806
This equation has two important implications. First, it provides a means of
calculating the of a reaction from a knowledge of K
P
, which is easier to
determine. Second, it shows that exothermic reactions such as
combustion processes are less complete at higher temperatures since K
P
decreases with temperature for such reactions (Fig. 16–16).
1h
R
6 0 2
h
R
Chapter 16 | 807
EXAMPLE 16–6 The Enthalpy of Reaction
of a Combustion Process
Estimate the enthalpy of reaction for the combustion process of hydrogen
H
2
+ 0.5O
2
→ H
2
O at 2000 K, using (a) enthalpy data and (b) K
P
data.
Solution The at a specified temperature is to be determined using the
enthalpy and K
p
data.
Assumptions Both the reactants and the products are ideal gases.
Analysis (a) The of the combustion process of H
2
at 2000 K is the amount
of energy released as 1 kmol of H
2
is burned in a steady-flow combustion
chamber at a temperature of 2000 K. It can be determined from Eq. 15–6,
Substituting yields
(b) The value at 2000 K can be estimated by using K
P
values at 1800
and 2200 K (the closest two temperatures to 2000 K for which K
P
data are
available) from Table A–28. They are K
P
1
ϭ 18,509 at T
1
ϭ 1800 K and
K
P
2
ϭ 869.6 at T
2
ϭ 2200 K. By substituting these values into Eq. 16–18,
the value is determined to be
Discussion Despite the large temperature difference between T
1
and T
2
(400 K), the two results are almost identical. The agreement between the
two results would be even better if a smaller temperature interval were used.
h
R
Х ؊251,698 kJ
/
kmol
ln
869.6
18,509
Х
h
R
8.314 kJ>kmol
#
K
a
1
1800 K
Ϫ
1
2200 K
b
ln
K
P
2
K
P
1
Х
h
R
R
u
a
1
T
1
Ϫ
1
T
2
b
h
R
h
R
ϭ ؊251,663 kJ
/
kmol
¬
Ϫ 10.5 kmol O
2
2310 ϩ 67,881 Ϫ 86822 kJ>kmol O
2
4
¬
Ϫ 11 kmol H
2
2310 ϩ 61,400 Ϫ 84682 kJ>kmol H
2
4
h
R
ϭ 11 kmol H
2
O231Ϫ241,820 ϩ 82,593 Ϫ 99042 kJ>kmol H
2
O4
¬
ϪN
O
2
1h
f
° ϩ h
2000 K
Ϫ h
298 K
2
O
2
ϭ N
H
2
O
1h
f
° ϩ h
2000 K
Ϫ h
298 K
2
H
2
O
Ϫ N
H
2
1h
f
° ϩ h
2000 K
Ϫ h
298 K
2
H
2
h
R
ϭ
a
N
p
1h
f
° ϩ h Ϫ h°2
p
Ϫ
a
N
r
1h
f
° ϩ h Ϫ h°2
r
h
R
h
R
h
R
4000
1000
2000
3000
T, K K
P
Reaction: C + O
2
→ CO
2
4.78 ϫ 10
20
2.25 ϫ 10
10
7.80 ϫ 10
6
1.41 ϫ 10
5
FIGURE 16–16
Exothermic reactions are less
complete at higher temperatures.
cen84959_ch16.qxd 5/11/05 10:08 AM Page 807
16–6
■
PHASE EQUILIBRIUM
We showed at the beginning of this chapter that the equilibrium state of a
system at a specified temperature and pressure is the state of the minimum
Gibbs function, and the equilibrium criterion for a reacting or nonreacting
system was expressed as (Eq. 16–4)
In the preceding sections we applied the equilibrium criterion to reacting
systems. In this section, we apply it to nonreacting multiphase systems.
We know from experience that a wet T-shirt hanging in an open area
eventually dries, a small amount of water left in a glass evaporates, and the
aftershave in an open bottle quickly disappears (Fig. 16–17). These
examples suggest that there is a driving force between the two phases of a
substance that forces the mass to transform from one phase to another. The
magnitude of this force depends, among other things, on the relative
concentrations of the two phases. A wet T-shirt dries much quicker in dry
air than it does in humid air. In fact, it does not dry at all if the relative
humidity of the environment is 100 percent. In this case, there is no trans-
formation from the liquid phase to the vapor phase, and the two phases are
in phase equilibrium. The conditions of phase equilibrium change, how-
ever, if the temperature or the pressure is changed. Therefore, we examine
phase equilibrium at a specified temperature and pressure.
Phase Equilibrium for a Single-Component System
The equilibrium criterion for two phases of a pure substance such as water
is easily developed by considering a mixture of saturated liquid and satu-
rated vapor in equilibrium at a specified temperature and pressure, such as
that shown in Fig. 16–18. The total Gibbs function of this mixture is
where g
f
and g
g
are the Gibbs functions of the liquid and vapor phases per
unit mass, respectively. Now imagine a disturbance during which a differen-
tial amount of liquid dm
f
evaporates at constant temperature and pressure.
The change in the total Gibbs function during this disturbance is
since g
f
and g
g
remain constant at constant temperature and pressure. At
equilibrium, (dG)
T,P
ϭ 0. Also from the conservation of mass, dm
g
ϭϪdm
f
.
Substituting, we obtain
which must be equal to zero at equilibrium. It yields
(16–19)
Therefore, the two phases of a pure substance are in equilibrium when each
phase has the same value of specific Gibbs function. Also, at the triple point
(the state at which all three phases coexist in equilibrium), the specific
Gibbs functions of all three phases are equal to each other.
g
f
ϭ g
g
1dG 2
T,P
ϭ 1g
f
Ϫ g
g
2 dm
f
1dG 2
T,P
ϭ g
f
dm
f
ϩ g
g
dm
g
G ϭ m
f
g
f
ϩ m
g
g
g
1dG 2
T,P
ϭ 0
808 | Thermodynamics
FIGURE 16–17
Wet clothes hung in an open area
eventually dry as a result of mass
transfer from the liquid phase to the
vapor phase.
© Vol. OS36/PhotoDisc
T, P
VAPOR
m
g
m
f
LIQUID
FIGURE 16–18
A liquid–vapor mixture in equilibrium
at a constant temperature and pressure.
cen84959_ch16.qxd 5/11/05 10:08 AM Page 808
What happens if g
f
Ͼ g
g
? Obviously the two phases are not in equilibrium
at that moment. The second law requires that (dG)
T, P
ϭ (g
f
Ϫ g
g
) dm
f
Յ 0.
Thus, dm
f
must be negative, which means that some liquid must vaporize
until g
f
ϭ g
g
. Therefore, the Gibbs function difference is the driving force
for phase change, just as the temperature difference is the driving force for
heat transfer.
Chapter 16 | 809
EXAMPLE 16–7 Phase Equilibrium for a Saturated Mixture
Show that a mixture of saturated liquid water and saturated water vapor at
120°C satisfies the criterion for phase equilibrium.
Solution It is to be shown that a saturated mixture satisfies the criterion
for phase equilibrium.
Properties The properties of saturated water at 120°C are h
f
ϭ 503.81 kJ/kg,
s
f
ϭ 1.5279 kJ/kg · K, h
g
ϭ 2706.0 kJ/kg, and s
g
ϭ 7.1292 kJ/kg · K (Table
A–4).
Analysis Using the definition of Gibbs function together with the enthalpy
and entropy data, we have
and
Discussion The two results are in close agreement. They would match
exactly if more accurate property data were used. Therefore, the criterion for
phase equilibrium is satisfied.
ϭϪ96.8 kJ>kg
g
g
ϭ h
g
Ϫ Ts
g
ϭ 2706.0 kJ>kg Ϫ 1393.15 K 217.1292 kJ>kg
#
K2
ϭϪ96.9 kJ>kg
g
f
ϭ h
f
Ϫ Ts
f
ϭ 503.81 kJ>kg Ϫ 1393.15 K 211.5279 kJ>kg
#
K2
The Phase Rule
Notice that a single-component two-phase system may exist in equilibrium
at different temperatures (or pressures). However, once the temperature is
fixed, the system is locked into an equilibrium state and all intensive prop-
erties of each phase (except their relative amounts) are fixed. Therefore, a
single-component two-phase system has one independent property, which
may be taken to be the temperature or the pressure.
In general, the number of independent variables associated with a multicom-
ponent, multiphase system is given by the Gibbs phase rule, expressed as
(16–20)
where IV ϭ the number of independent variables, C ϭ the number of com-
ponents, and PH ϭ the number of phases present in equilibrium. For the
single-component (C ϭ 1) two-phase (PH ϭ 2) system discussed above, for
example, one independent intensive property needs to be specified (IV ϭ 1,
Fig. 16–19). At the triple point, however, PH ϭ 3 and thus IV ϭ 0. That
is, none of the properties of a pure substance at the triple point can be var-
ied. Also, based on this rule, a pure substance that exists in a single phase
IV ϭ C Ϫ PH ϩ 2
T
WATER VAPOR
LIQUID WATER
100°C
150°C
200°C
.
.
.
FIGURE 16–19
According to the Gibbs phase rule, a
single-component, two-phase system
can have only one independent
variable.
cen84959_ch16.qxd 5/11/05 10:08 AM Page 809
(PH ϭ 1) has two independent variables. In other words, two independent
intensive properties need to be specified to fix the equilibrium state of a
pure substance in a single phase.
Phase Equilibrium for a Multicomponent System
Many multiphase systems encountered in practice involve two or more com-
ponents. A multicomponent multiphase system at a specified temperature
and pressure is in phase equilibrium when there is no driving force between
the different phases of each component. Thus, for phase equilibrium, the
specific Gibbs function of each component must be the same in all phases
(Fig. 16–20). That is,
We could also derive these relations by using mathematical vigor instead of
physical arguments.
Some components may exist in more than one solid phase at the specified
temperature and pressure. In this case, the specific Gibbs function of each
solid phase of a component must also be the same for phase equilibrium.
In this section we examine the phase equilibrium of two-component sys-
tems that involve two phases (liquid and vapor) in equilibrium. For such
systems, C ϭ 2, PH ϭ 2, and thus IV ϭ 2. That is, a two-component, two-
phase system has two independent variables, and such a system will not be
in equilibrium unless two independent intensive properties are fixed.
In general, the two phases of a two-component system do not have the
same composition in each phase. That is, the mole fraction of a component
is different in different phases. This is illustrated in Fig. 16–21 for the two-
phase mixture of oxygen and nitrogen at a pressure of 0.1 MPa. On this dia-
gram, the vapor line represents the equilibrium composition of the vapor
phase at various temperatures, and the liquid line does the same for the liq-
uid phase. At 84 K, for example, the mole fractions are 30 percent nitrogen
and 70 percent oxygen in the liquid phase and 66 percent nitrogen and
34 percent oxygen in the vapor phase. Notice that
(16–21a)
(16–21b)
Therefore, once the temperature and pressure (two independent variables) of
a two-component, two-phase mixture are specified, the equilibrium compo-
sition of each phase can be determined from the phase diagram, which is
based on experimental measurements.
It is interesting to note that temperature is a continuous function, but mole
fraction (which is a dimensionless concentration), in general, is not. The
water and air temperatures at the free surface of a lake, for example, are
always the same. The mole fractions of air on the two sides of a water–air
interface, however, are obviously very different (in fact, the mole fraction of
air in water is close to zero). Likewise, the mole fractions of water on the
y
g,N
2
ϩ y
g,O
2
ϭ 0.66 ϩ 0.34 ϭ 1
y
f,N
2
ϩ y
f,O
2
ϭ 0.30 ϩ 0.70 ϭ 1
g
f,N
ϭ g
g,N
ϭ g
s,N
¬
for component N
ppppp
p
g
f,2
ϭ g
g,2
ϭ g
s,2
¬
for component 2
g
f,1
ϭ g
g,1
ϭ g
s,1
¬
for component 1
810 | Thermodynamics
T, P
NH
3
+ H
2
O VAPOR
g
f,NH
3
= g
g,NH
3
LIQUID NH
3
+ H
2
O
g
f,H
2
O
= g
g,H
2
O
FIGURE 16–20
A multicomponent multiphase system
is in phase equilibrium when the
specific Gibbs function of each
component is the same in all phases.
100% O
2
VAPOR
T, K
0
LIQUID + VAPOR
LIQUID
10 20 30 40 50 60 70 80 90
0%
N
2
100 90 80 70 60 50 40 30 20 10
74
77.3
78
82
86
90
94
90.2
FIGURE 16–21
Equilibrium diagram for the two-phase
mixture of oxygen and nitrogen at
0.1 MPa.
cen84959_ch16.qxd 5/11/05 10:08 AM Page 810
two sides of a water–air interface are also different even when air is satu-
rated (Fig. 16–22). Therefore, when specifying mole fractions in two-phase
mixtures, we need to clearly specify the intended phase.
In most practical applications, the two phases of a mixture are not in
phase equilibrium since the establishment of phase equilibrium requires the
diffusion of species from higher concentration regions to lower concentra-
tion regions, which may take a long time. However, phase equilibrium
always exists at the interface of two phases of a species. In the case of
air–water interface, the mole fraction of water vapor in the air is easily
determined from saturation data, as shown in Example 16–8.
The situation is similar at solid–liquid interfaces. Again, at a given tem-
perature, only a certain amount of solid can be dissolved in a liquid, and the
solubility of the solid in the liquid is determined from the requirement that
thermodynamic equilibrium exists between the solid and the solution at the
interface. The solubility represents the maximum amount of solid that can
be dissolved in a liquid at a specified temperature and is widely available in
chemistry handbooks. In Table 16–1 we present sample solubility data for
sodium chloride (NaCl) and calcium bicarbonate [Ca(HO
3
)
2
] at various tem-
peratures. For example, the solubility of salt (NaCl) in water at 310 K is
36.5 kg per 100 kg of water. Therefore, the mass fraction of salt in the satu-
rated brine is simply
whereas the mass fraction of salt in the pure solid salt is mf ϭ 1.0.
Many processes involve the absorption of a gas into a liquid. Most gases are
weakly soluble in liquids (such as air in water), and for such dilute solutions
the mole fractions of a species i in the gas and liquid phases at the interface
are observed to be proportional to each other. That is, y
i,gas side
ϰ y
i,liquid side
or
P
i,gas side
ϰ Py
i,liquid side
since y
i
ϭ P
i
/P for ideal-gas mixtures. This is known as
the Henry’s law and is expressed as
(16–22)
where H is the Henry’s constant, which is the product of the total pressure
of the gas mixture and the proportionality constant. For a given species, it is
a function of temperature only and is practically independent of pressure for
pressures under about 5 atm. Values of the Henry’s constant for a number of
aqueous solutions are given in Table 16–2 for various temperatures. From
this table and the equation above we make the following observations:
1. The concentration of a gas dissolved in a liquid is inversely proportional
to Henry’s constant. Therefore, the larger the Henry’s constant, the
smaller the concentration of dissolved gases in the liquid.
2. The Henry’s constant increases (and thus the fraction of a dissolved gas in
the liquid decreases) with increasing temperature. Therefore, the dissolved
gases in a liquid can be driven off by heating the liquid (Fig. 16–23).
3. The concentration of a gas dissolved in a liquid is proportional to the
partial pressure of the gas. Therefore, the amount of gas dissolved in a
liquid can be increased by increasing the pressure of the gas. This can be
used to advantage in the carbonation of soft drinks with CO
2
gas.
y
i,liquid side
ϭ
P
i,gas side
H
mf
salt,liquid side
ϭ
m
salt
m
ϭ
36.5 kg
1100 ϩ 36.5 2 kg
ϭ 0.267 1or 26.7 percent 2
Chapter 16 | 811
y
H
2
O,liquid side
Х 1
Air
Water
y
H
2
O,gas side
Jump in
concentration
Concentration
profile
x
FIGURE 16–22
Unlike temperature, the mole fraction
of species on the two sides of a
liquid–gas (or solid–gas or
solid–liquid) interface are usually not
the same.
TABLE 16–1
Solubility of two inorganic
compounds in water at various
temperatures, in kg (in 100 kg of
water)
(from Handbook of Chemistry, McGraw-Hill,
1961)
Solute
Calcium
Tempera- Salt bicarbonate
ture, K NaCl Ca(HCO
3
)
2
273.15 35.7 16.15
280 35.8 16.30
290 35.9 16.53
300 36.2 16.75
310 36.5 16.98
320 36.9 17.20
330 37.2 17.43
340 37.6 17.65
350 38.2 17.88
360 38.8 18.10
370 39.5 18.33
373.15 39.8 18.40
cen84959_ch16.qxd 5/11/05 10:08 AM Page 811
Strictly speaking, the result obtained from Eq. 16–22 for the mole fraction
of dissolved gas is valid for the liquid layer just beneath the interface,
but not necessarily the entire liquid. The latter will be the case only when
thermodynamic phase equilibrium is established throughout the entire liq-
uid body.
We mentioned earlier that the use of Henry’s law is limited to dilute
gas–liquid solutions, that is, liquids with a small amount of gas dissolved in
them. Then the question that arises naturally is, what do we do when the gas
is highly soluble in the liquid (or solid), such as ammonia in water? In this
case, the linear relationship of Henry’s law does not apply, and the mole
fraction of a gas dissolved in the liquid (or solid) is usually expressed as a
function of the partial pressure of the gas in the gas phase and the tempera-
ture. An approximate relation in this case for the mole fractions of a species
on the liquid and gas sides of the interface is given by Raoult’s law as
(16–23)
where P
i,sat
(T) is the saturation pressure of the species i at the interface tem-
perature and P
total
is the total pressure on the gas phase side. Tabular data
are available in chemical handbooks for common solutions such as
the ammonia–water solution that is widely used in absorption-refrigeration
systems.
Gases may also dissolve in solids, but the diffusion process in this case
can be very complicated. The dissolution of a gas may be independent of
the structure of the solid, or it may depend strongly on its porosity. Some
dissolution processes (such as the dissolution of hydrogen in titanium, simi-
lar to the dissolution of CO
2
in water) are reversible, and thus maintaining
the gas content in the solid requires constant contact of the solid with a
reservoir of that gas. Some other dissolution processes are irreversible. For
example, oxygen gas dissolving in titanium forms TiO
2
on the surface, and
the process does not reverse itself.
The molar density of the gas species i in the solid at the interface
is proportional to the partial pressure of the species i in the gas
P
i,gas side
on the gas side of the interface and is expressed as
(16–24)
r
Ϫ
i,solid side
ϭ ϫ P
i,gas side
¬¬
1kmol>m
3
2
r
Ϫ
i,solid side
P
i,gas side
ϭ y
i,gas side
P
total
ϭ y
i,liquid side
P
i,sat
1T 2
812 | Thermodynamics
TABLE 16–2
Henry’s constant H (in bars) for selected gases in water at low to moderate
pressures (for gas i, H ϭ P
i,gas side
/y
i,water side
) (from Mills, Table A.21, p. 874)
Solute 290 K 300 K 310 K 320 K 330 K 340 K
H
2
S 440 560 700 830 980 1140
CO
2
1,280 1,710 2,170 2,720 3,220 —
O
2
38,000 45,000 52,000 57,000 61,000 65,000
H
2
67,000 72,000 75,000 76,000 77,000 76,000
CO 51,000 60,000 67,000 74,000 80,000 84,000
Air 62,000 74,000 84,000 92,000 99,000 104,000
N
2
76,000 89,000 101,000 110,000 118,000 124,000
y
A,gas side
ϰ
y
A,liquid side
y
A,gas side
y
A,liquid side
or
ϰ y
A,liquid side
or
P
A,gas side
= Hy
A,liquid side
Gas: A
Liquid: B
Gas A
P
A,gas side
————
P
FIGURE 16–23
Dissolved gases in a liquid can be
driven off by heating the liquid.
cen84959_ch16.qxd 5/11/05 10:08 AM Page 812
where is the solubility. Expressing the pressure in bars and noting that the
unit of molar concentration is kmol of species i per m
3
, the unit of solubility
is kmol/m
3
· bar. Solubility data for selected gas–solid combinations are
given in Table 16–3. The product of solubility of a gas and the diffusion
coefficient of the gas in a solid is referred to as the permeability, which is a
measure of the ability of the gas to penetrate a solid. Permeability is
inversely proportional to thickness and has the unit kmol/s · m · bar.
Finally, if a process involves the sublimation of a pure solid such as ice or
the evaporation of a pure liquid such as water in a different medium such as
air, the mole (or mass) fraction of the substance in the liquid or solid phase
is simply taken to be 1.0, and the partial pressure and thus the mole fraction
of the substance in the gas phase can readily be determined from the satura-
tion data of the substance at the specified temperature. Also, the assumption
of thermodynamic equilibrium at the interface is very reasonable for pure
solids, pure liquids, and solutions except when chemical reactions are
occurring at the interface.
Chapter 16 | 813
TABLE 16–3
Solubility of selected gases and
solids (from Barrer)
(for gas i, ϭ r
–
i,solid side
/P
i,gas side
)
Gas Solid T K kmol/m
3
· bar
O
2
Rubber 298 0.00312
N
2
Rubber 298 0.00156
CO
2
Rubber 298 0.04015
He SiO
2
298 0.00045
H
2
Ni 358 0.00901
EXAMPLE 16–8 Mole Fraction of Water Vapor Just over a Lake
Determine the mole fraction of the water vapor at the surface of a lake whose
temperature is 15°C, and compare it to the mole fraction of water in the lake
(Fig. 16–24). Take the atmospheric pressure at lake level to be 92 kPa.
Solution The mole fraction of water vapor at the surface of a lake is to be
determined and to be compared to the mole fraction of water in the lake.
Assumptions 1 Both the air and water vapor are ideal gases. 2 The amount
of air dissolved in water is negligible.
Properties The saturation pressure of water at 15°C is 1.7057 kPa (Table A–4).
Analysis There exists phase equilibrium at the free surface of the lake,
and thus the air at the lake surface is always saturated at the interface
temperature.
The air at the water surface is saturated. Therefore, the partial pressure of
water vapor in the air at the lake surface will simply be the saturation pres-
sure of water at 15°C,
The mole fraction of water vapor in the air at the surface of the lake is deter-
mined from Eq. 16–22 to be
Water contains some dissolved air, but the amount is negligible. Therefore,
we can assume the entire lake to be liquid water. Then its mole fraction
becomes
Discussion Note that the concentration of water on a molar basis is
100 percent just beneath the air–water interface and less than 2 percent
just above it even though the air is assumed to be saturated (so this is the
highest value at 15°C). Therefore, large discontinuities can occur in the con-
centrations of a species across phase boundaries.
y
water,liquid side
Х 1.0 or 100 percent
y
v
ϭ
P
v
P
ϭ
1.7057 kPa
92 kPa
ϭ 0.0185 or 1.85 percent
P
v
ϭ P
sat @ 15°C
ϭ 1.7057 kPa
y
H
2
O,liquid side
≅ 1.0
Lake
15°C
Air
92 kPa
y
H
2
O,air side
= 0.0185
Saturated air
FIGURE 16–24
Schematic for Example 16–8.
cen84959_ch16.qxd 5/11/05 10:08 AM Page 813
814 | Thermodynamics
EXAMPLE 16–9 The Amount of Dissolved Air in Water
Determine the mole fraction of air at the surface of a lake whose temperature is
17°C (Fig. 16–25). Take the atmospheric pressure at lake level to be 92 kPa.
Solution The mole fraction of air in lake water is to be determined.
Assumptions Both the air and vapor are ideal gases.
Properties The saturation pressure of water at 17°C is 1.96 kPa (Table
A–4). The Henry’s constant for air dissolved in water at 290 K is H ϭ
62,000 bar (Table 16–2).
Analysis This example is similar to the previous example. Again the air at the
water surface is saturated, and thus the partial pressure of water vapor in the
air at the lake surface is the saturation pressure of water at 17°C,
The partial pressure of dry air is
Note that we could have ignored the vapor pressure since the amount of
vapor in air is so small with little loss in accuracy (an error of about 2 per-
cent). The mole fraction of air in the water is, from Henry’s law,
Discussion This value is very small, as expected. Therefore, the concentration
of air in water just below the air–water interface is 1.45 moles per 100,000
moles. But obviously this is enough oxygen for fish and other creatures in the
lake. Note that the amount of air dissolved in water will decrease with increas-
ing depth unless phase equilibrium exists throughout the entire lake.
y
dry air,liquid side
ϭ
P
dry air,gas side
H
ϭ
0.9004 bar
62,000 bar
ϭ 1.45 ؋ 10
؊5
P
dry air
ϭ P Ϫ P
v
ϭ 92 Ϫ 1.96 ϭ 90.04 kPa ϭ 0.9004 bar
P
v
ϭ P
sat @ 17°C
ϭ 1.96 kPa
EXAMPLE 16–10 Diffusion of Hydrogen Gas into a Nickel Plate
Consider a nickel plate that is placed into a tank filled with hydrogen gas at
358 K and 300 kPa. Determine the molar and mass density of hydrogen in
the nickel plate when phase equilibrium is established (Fig. 16–26).
Solution A nickel plate is exposed to hydrogen gas. The density of hydro-
gen in the plate is to be determined.
Properties The molar mass of hydrogen H
2
is M ϭ 2 kg/kmol, and the solu-
bility of hydrogen in nickel at the specified temperature is given in Table
16–3 to be 0.00901 kmol/m
3
· bar.
Analysis Noting that 300 kPa ϭ 3 bar, the molar density of hydrogen in the
nickel plate is determined from Eq. 16–24 to be
It corresponds to a mass density of
That is, there will be 0.027 kmol (or 0.054 kg) of H
2
gas in each m
3
volume
of nickel plate when phase equilibrium is established.
ϭ 10.027 kmol>m
3
212 kg>kmol 2ϭ 0.054 kg
/
m
3
r
H
2
,solid side
ϭ r
Ϫ
H
2
,solid side
M
H
2
ϭ 10.00901 kmol>m
3
#
bar213 bar2ϭ 0.027 kmol
/
m
3
r
Ϫ
H
2
,solid side
ϭ ϫ P
H
2
,gas side
y
dry air,liquid side
Lake
17°C
Air
P
dry air,gas side
Saturated air
FIGURE 16–25
Schematic for Example 16–9.
Nickel plate
Hydrogen gas
358 K, 300 kPa
H
2
H
2
FIGURE 16–26
Schematic for Example 16–10.
cen84959_ch16.qxd 5/11/05 10:08 AM Page 814
Chapter 16 | 815
EXAMPLE 16–11 Composition of Different Phases of a Mixture
In absorption refrigeration systems, a two-phase equilibrium mixture of liquid
ammonia (NH
3
) and water (H
2
O) is frequently used. Consider one such mix-
ture at 40°C, shown in Fig. 16–27. If the composition of the liquid phase is
70 percent NH
3
and 30 percent H
2
O by mole numbers, determine the com-
position of the vapor phase of this mixture.
Solution A two-phase mixture of ammonia and water at a specified temper-
ature is considered. The composition of the liquid phase is given, and the
composition of the vapor phase is to be determined.
Assumptions The mixture is ideal and thus Raoult’s law is applicable.
Properties The saturation pressures of H
2
O and NH
3
at 40°C are P
H
2
O,sat
ϭ
7.3851 kPa and P
NH
3
,sat
ϭ 1554.33 kPa.
Analysis The vapor pressures are determined from
The total pressure of the mixture is
Then the mole fractions in the gas phase are
Discussion Note that the gas phase consists almost entirely of ammonia,
making this mixture very suitable for absorption refrigeration.
y
NH
3
,gas side
ϭ
P
NH
3
,gas side
P
total
ϭ
1088.03 kPa
1090.25 kPa
ϭ 0.9980
y
H
2
O,gas side
ϭ
P
H
2
O,gas side
P
total
ϭ
2.22 kPa
1090.25 kPa
ϭ 0.0020
P
total
ϭ P
H
2
O
ϩ P
NH
3
ϭ 2.22 ϩ 1088.03 ϭ 1090.25 kPa
P
NH
3
,gas side
ϭ y
NH
3
,liquid side
P
NH
3
,sat
1T 2ϭ 0.70 11554.33 kPa2ϭ 1088.03 kPa
P
H
2
O,gas side
ϭ y
H
2
O,liquid side
P
H
2
O,sat
1T 2ϭ 0.30 17.3851 kPa2ϭ 2.22 kPa
40°C
y
g,H
2
O
= ?
LIQUID
VAPOR
H
2
O + NH
3
y
g,NH
3
= ?
y
f,H
2
O
= 0.30
y
f,NH
3
= 0.70
FIGURE 16–27
Schematic for Example 16–11.
SUMMARY
An isolated system is said to be in chemical equilibrium if no
changes occur in the chemical composition of the system.
The criterion for chemical equilibrium is based on the second
law of thermodynamics, and for a system at a specified tem-
perature and pressure it can be expressed as
For the reaction
where the n’s are the stoichiometric coefficients, the equilib-
rium criterion can be expressed in terms of the Gibbs func-
tions as
which is valid for any chemical reaction regardless of the
phases involved.
n
C
g
Ϫ
C
ϩ n
D
g
Ϫ
D
Ϫ n
A
g
Ϫ
A
Ϫ n
B
g
Ϫ
B
ϭ 0
n
A
A ϩ n
B
B
∆
n
C
C ϩ n
D
D
1dG 2
T, P
ϭ 0
For reacting systems that consist of ideal gases only, the
equilibrium constant
K
P
can be expressed as
where the standard-state Gibbs function change ∆G*(T) and
the equilibrium constant K
P
are defined as
and
Here, P
i
’s are the partial pressures of the components in atm.
The K
P
of ideal-gas mixtures can also be expressed in terms
of the mole numbers of the components as
K
P
ϭ
N
n
C
C
N
n
D
D
N
n
A
A
N
n
B
B
a
P
N
total
b
¢n
K
P
ϭ
P
n
C
C
P
n
D
D
P
n
A
A
P
n
B
B
¢G* 1T2ϭ n
C
g
Ϫ
*
C
1T 2ϩ n
D
g
Ϫ
*
D
1T 2Ϫ n
A
g
Ϫ
*
A
1T 2Ϫ n
B
g
Ϫ
*
B
1T 2
K
P
ϭ e
Ϫ¢G*1T 2>R
u
T
cen84959_ch16.qxd 5/11/05 10:08 AM Page 815
where ∆n ϭ n
C
ϩ n
D
Ϫ n
A
Ϫ n
B
, P is the total pressure in
atm, and N
total
is the total number of moles present in the
reaction chamber, including any inert gases. The equation
above is written for a reaction involving two reactants and
two products, but it can be extended to reactions involving
any number of reactants and products.
The equilibrium constant K
P
of ideal-gas mixtures depends
on temperature only. It is independent of the pressure of the
equilibrium mixture, and it is not affected by the presence of
inert gases. The larger the K
P
, the more complete the reac-
tion. Very small values of K
P
indicate that a reaction does not
proceed to any appreciable degree. A reaction with K
P
Ͼ
1000 is usually assumed to proceed to completion, and a
reaction with K
P
Ͻ 0.001 is assumed not to occur at all. The
mixture pressure affects the equilibrium composition, although
it does not affect the equilibrium constant K
P
.
The variation of K
P
with temperature is expressed in terms
of other thermochemical properties through the van’t Hoff
equation
where is the enthalpy of reaction at temperature T. For
small temperature intervals, it can be integrated to yield
This equation shows that combustion processes are less com-
plete at higher temperatures since K
P
decreases with tempera-
ture for exothermic reactions.
Two phases are said to be in phase equilibrium when there
is no transformation from one phase to the other. Two phases
ln
K
P
2
K
P
1
Х
h
R
R
u
a
1
T
1
Ϫ
1
T
2
b
h
R
1T 2
d 1ln K
P
2
dT
ϭ
h
R
1T 2
R
u
T
2
816 | Thermodynamics
of a pure substance are in equilibrium when each phase has
the same value of specific Gibbs function. That is,
In general, the number of independent variables associated
with a multicomponent, multiphase system is given by the
Gibbs phase rule, expressed as
where IV ϭ the number of independent variables, C ϭ the
number of components, and PH ϭ the number of phases pres-
ent in equilibrium.
A multicomponent, multiphase system at a specified tem-
perature and pressure is in phase equilibrium when the spe-
cific Gibbs function of each component is the same in all
phases.
For a gas i that is weakly soluble in a liquid (such as air
in water), the mole fraction of the gas in the liquid y
i,liquid side
is related to the partial pressure of the gas P
i,gas side
by
Henry’s law
where H is Henry’s constant. When a gas is highly soluble in
a liquid (such as ammonia in water), the mole fractions of the
species of a two-phase mixture in the liquid and gas phases
are given approximately by Raoult’s law, expressed as
where P
total
is the total pressure of the mixture, P
i,sat
(T) is the
saturation pressure of species i at the mixture temperature,
and y
i,liquid side
and y
i,gas side
are the mole fractions of species i
in the liquid and vapor phases, respectively.
P
i,gas side
ϭ y
i,gas side
P
total
ϭ y
i,liquid side
P
i,sat
1T 2
y
i,liquid side
ϭ
P
i,gas side
H
IV ϭ C Ϫ PH ϩ 2
g
f
ϭ g
g
REFERENCES AND SUGGESTED READINGS
1. R. M. Barrer. Diffusion in and through Solids. New York:
Macmillan, 1941.
2. I. Glassman. Combustion. New York: Academic Press,
1977.
3. A. M. Kanury. Introduction to Combustion Phenomena.
New York: Gordon and Breach, 1975.
4. A. F. Mills. Basic Heat and Mass Transfer. Burr Ridge,
IL: Richard D. Irwin, 1995.
5. J. M. Smith and H. C. Van Ness. Introduction to Chemical
Engineering Thermodynamics. 3rd ed. New York: John
Wiley & Sons, 1986.
6. K. Wark and D. E. Richards. Thermodynamics. 6th ed.
New York: McGraw-Hill, 1999.
cen84959_ch16.qxd 5/11/05 10:08 AM Page 816
Chapter 16 | 817
K
P
and the Equilibrium Composition of Ideal Gases
16–1C Why is the criterion for chemical equilibrium
expressed in terms of the Gibbs function instead of entropy?
16–2C Is a wooden table in chemical equilibrium with the air?
16–3C Write three different K
P
relations for reacting ideal-
gas mixtures, and state when each relation should be used.
16–4C The equilibrium constant of the reaction CO ϩ
→ CO
2
at 1000 K and 1 atm is . Express the equilibrium
constant of the following reactions at 1000 K in terms of :
(a) at 3 atm
(b) at 1 atm
(c) at 1 atm
(d) CO ϩ 2O
2
ϩ 5N
2
CO
2
ϩ 1.5O
2
ϩ 5N
2
at 4 atm
(e) 2CO ϩ O
2
2CO
2
at 1 atm
16–5C The equilibrium constant of the dissociation reac-
tion H
2
→ 2H at 3000 K and 1 atm is . Express the equi-
librium constants of the following reactions at 3000 K in
terms of :
(a)H
2
2H at 2 atm
(b) 2H H
2
at 1 atm
(c)2H
2
4H at 1 atm
(d)H
2
ϩ 2N
2
2H ϩ 2N
2
at 2 atm
(e) 6H 3H
2
at 4 atm
16–6C Consider a mixture of CO
2
, CO, and O
2
in equilib-
rium at a specified temperature and pressure. Now the pres-
sure is doubled.
(a) Will the equilibrium constant K
P
change?
(b) Will the number of moles of CO
2
, CO, and O
2
change?
How?
16–7C Consider a mixture of NO, O
2
, and N
2
in equilib-
rium at a specified temperature and pressure. Now the pres-
sure is tripled.
(a) Will the equilibrium constant K
P
change?
(b) Will the number of moles of NO, O
2
, and N
2
change?
How?
16–8C A reaction chamber contains a mixture of CO
2
,CO,
and O
2
in equilibrium at a specified temperature and pres-
∆
∆
∆
∆
∆
K
P
1
K
P
1
∆
∆
CO ϩ O
2
∆
CO
2
ϩ
1
2
O
2
CO
2
∆
CO ϩ
1
2
O
2
CO ϩ
1
2
O
2
∆
CO
2
K
P
1
K
P
1
1
2
O
2
sure. How will (a) increasing the temperature at constant
pressure and (b) increasing the pressure at constant tempera-
ture affect the number of moles of CO
2
?
16–9C A reaction chamber contains a mixture of N
2
and N
in equilibrium at a specified temperature and pressure. How
will (a) increasing the temperature at constant pressure and
(b) increasing the pressure at constant temperature affect the
number of moles of N
2
?
16–10C A reaction chamber contains a mixture of CO
2
,
CO, and O
2
in equilibrium at a specified temperature and
pressure. Now some N
2
is added to the mixture while the
mixture temperature and pressure are kept constant. Will this
affect the number of moles of O
2
? How?
16–11C Which element is more likely to dissociate into its
monatomic form at 3000 K, H
2
or N
2
? Why?
16–12 Using the Gibbs function data, determine the equi-
librium constant K
P
for the reaction at
(a) 298 K and (b) 2000 K. Compare your results with the K
P
values listed in Table A–28.
16–13E Using Gibbs function data, determine the equilib-
rium constant K
P
for the reaction at
(a) 537 R and (b) 3240 R. Compare your results with the
K
P
values listed in Table A–28. Answers: (a) 1.12 ϫ 10
40
,
(b) 1.90 ϫ 10
4
16–14 Determine the equilibrium constant K
P
for the pro-
cess CO ϩ O
2
ϭ CO
2
at (a) 298 K and (b) 2000 K. Com-
pare your results with the values for K
P
listed in Table A–28.
16–15 Study the effect of varying the percent excess
air during the steady-flow combustion of
hydrogen at a pressure of 1 atm. At what temperature will 97
percent of H
2
burn into H
2
O? Assume the equilibrium mix-
ture consists of H
2
O, H
2
,O
2
, and N
2
.
16–16 Determine the equilibrium constant K
P
for the
reaction CH
4
ϩ 2O
2
CO
2
ϩ 2H
2
O at 25°C.
Answer: 1.96 ϫ 10
140
16–17 Using the Gibbs function data, determine the equi-
librium constant K
P
for the dissociation process
at (a) 298 K and (b) 1800 K. Compare your
results with the K
P
values listed in Table A–28.
16–18 Using the Gibbs function data, determine the equi-
librium constant K
P
for the reaction
at 25°C. Compare your result with the K
P
value listed in
Table A–28.
16–19 Determine the temperature at which 5 percent of
diatomic oxygen (O
2
) dissociates into monatomic oxygen (O)
at a pressure of 3 atm.
Answer: 3133 K
16–20 Repeat Prob. 16–19 for a pressure of 6 atm.
H
2
O
∆
1
2
H
2
ϩ OH
CO ϩ
1
2
O
2
CO
2
∆
∆
1
2
H
2
ϩ
1
2
O
2
∆
H
2
O
H
2
ϩ
1
2
O
2
∆
H
2
O
PROBLEMS*
*Problems designated by a “C” are concept questions, and students
are encouraged to answer them all. Problems designated by an “E”
are in English units, and the SI users can ignore them. Problems
with a CD-EES icon are solved using EES, and complete solutions
together with parametric studies are included on the enclosed DVD.
Problems with a computer-EES icon are comprehensive in nature,
and are intended to be solved with a computer, preferably using the
EES software that accompanies this text.
cen84959_ch16.qxd 5/11/05 10:08 AM Page 817