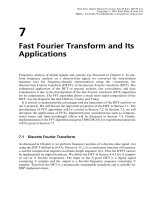
Real-Time Digital Signal Processing - Chapter 6: Design and Implementation of IIR Filters
Bạn đang xem bản rút gọn của tài liệu. Xem và tải ngay bản đầy đủ của tài liệu tại đây (349.59 KB, 62 trang )
6
Design and Implementation
of IIR Filters
We have discussed the design and implementation of digital FIR filters in the previous
chapter. In this chapter, our attention will be focused on the design, realization, and
implementation of digital IIR filters. The design of IIR filters is to determine the
transfer function H(z) that satisfies the given specifications. We will discuss the basic
characteristics of digital IIR filters, and familiarize ourselves with the fundamental
techniques used for the design and implementation of these filters. IIR filters have the
best roll-off and lower sidelobes in the stopband for the smallest number of coefficients.
Digital IIR filters can be easily obtained by beginning with the design of an analog
filter, and then using mapping technique to transform it from the s-plane into the z-
plane. The Laplace transform will be introduced in Section 6.1 and the analog filter will
be discussed in Section 6.2. The impulse-invariant and bilinear-transform methods for
designing digital IIR filters will be introduced in Section 6.3, and realization of IIR
filters using direct, cascade, and parallel forms will be introduced in Section 6.4. The
filter design using MATLAB will be described in Section 6.5, and the implementation
considerations are given in Section 6.6. The software development and experiments
using the TMS320C55x will be given in Section 6.7.
6.1 Laplace Transform
As discussed in Chapter 4, the Laplace transform is the most powerful technique used to
describe, represent, and analyze analog signals and systems. In order to introduce
analog filters in the next section, a brief review of the Laplace transform is given in
this section.
6.1.1 Introduction to the Laplace Transform
Many practical aperiodic functions such as a unit step function u(t), a unit ramp tu(t),
or an impulse train
I
kÀI
dt À kT do not satisfy the integrable condition given in
(4.1.11), which is a sufficient condition for a function x(t) that possesses a Fourier
Real-Time Digital Signal Processing. Sen M Kuo, Bob H Lee
Copyright # 2001 John Wiley & Sons Ltd
ISBNs: 0-470-84137-0 (Hardback); 0-470-84534-1 (Electronic)
transform. Given a positive-time function, xt0, for t < 0, a simple way to find the
Fourier transform is to multiply x(t) by a convergence factor e
Àst
, where s is a positive
number such that
I
0
xte
Àst
dt < I: 6:1:1
Taking the Fourier transform defined in (4.1.10) on the composite function xte
Àst
,we
have
Xs
I
0
xte
Àst
e
ÀjVt
dt
I
0
xte
ÀsjVt
dt
I
0
xte
Àst
dt,
6:1:2
where
s s jV 6:1:3
is a complex variable. This is called the one-sided Laplace transform of x(t) and is
denoted by XsLTxt. Table 6.1 lists the Laplace transforms of some simple time
functions.
Example 6.1: Find the Laplace transform of signal
xta be
Àct
, t ! 0:
From Table 6.1, we have the transform pairs
a 6
a
s
and e
Àct
6
1
s c
:
Using the linear property, we have
Xs
a
s
b
s c
:
The inverse Laplace transform can be expressed as
xt
1
2pj
sjI
sÀjI
Xse
st
ds: 6:1:4
The integral is evaluated along the straight line s jV in the complex plane from
V ÀI to V I, which is parallel to the imaginary axis jV at a distance s
from it.
242
DESIGN AND IMPLEMENTATION OF IIR FILTERS
Table 6.1 Basic Laplace transform pairs
xt, t ! 0 X(s)
dt 1
u(t)
1
s
c
c
s
ct
c
s
2
ct
nÀ1
cn À 1!
s
n
e
Àat
1
s a
sin V
0
t
V
0
s
2
V
2
0
cos V
0
t
s
s
2
V
2
0
xt cos V
0
t
1
2
Xs jV
0
Xs À jV
0
xt sin V
0
t
j
2
Xs jV
0
ÀXs À jV
0
e
Æ at
xt Xs
À
a
xat
1
a
X
s
a
Equation (6.1.2) clearly shows that the Laplace transform is actually the Fourier
transform of the function xte
Àst
, t > 0. From (6.1.3), we can think of a complex s-
plane with a real axis s and an imaginary axis jV. For values of s along the jV axis, i.e.,
s 0, we have
Xsj
sjV
I
0
xte
ÀjVt
dt, 6:1:5
which is the Fourier transform of the causal signal x(t). Given a function X(s), we can
find its frequency characteristics by setting s jV.
There are convolution properties associated with the Laplace transform. If
ytxtÃht
I
0
xtht À td t
I
0
htxt À tdt, 6:1:6
LAPLACE TRANSFORM
243
then
YsXsHs, 6:1:7
where Y(s), H(s), and X(s) are the Laplace transforms of y(t), h(t), and x(t), respectively.
Thus convolution in the time domain is equivalent to multiplication in the Laplace (or
frequency) domain.
In (6.1.7), H(s) is the transfer function of the system defined as
Hs
Ys
Xs
I
0
hte
Àst
dt, 6:1:8
where h(t) is the impulse response of the system. The general form of a transfer function
is expressed as
Hs
b
0
b
1
s ÁÁÁb
LÀ1
s
LÀ1
a
0
a
1
s ÁÁÁa
M
s
M
Ns
Ds
: 6:1:9
The roots of N(s) are the zeros of the transfer function H(s), while the roots of D(s) are
the poles.
Example 6.2: The input signal xte
À2t
ut is applied to an LTI system, and the
output of the system is given as
yte
Àt
e
À2t
À e
À3t
ut:
Find the system's transfer function H(s) and the impulse response h(t).
From Table 6.1, we have
Xs
1
s 2
and Ys
1
s 1
1
s 2
À
1
s 3
:
From (6.1.8), we obtain
Hs
Ys
Xs
1
s 2
s 1
À
s 2
s 3
:
This transfer function can be written as
Hs
s
2
6s 7
s 1s 3
1
1
s 1
1
s 3
:
From Table 6.1, we have
htdte
Àt
e
À3t
ut:
244
DESIGN AND IMPLEMENTATION OF IIR FILTERS
The stability condition for a system can be represented in terms of its impulse
response h(t) or its transfer function H(s). A system is stable if
lim
t3I
ht0: 6:1:10
This condition is equivalent to requiring that all the poles of H(s) must be in the left-half
of the s-plane, i.e., s < 0.
Example 6.3: Consider the impulse response
hte
Àat
ut:
This function satisfies (6.1.10) for a > 0. From Table 6.1, the transfer function
Hs
1
s a
, a > 0
has the pole at s Àa, which is located at the left-half s-plane. Thus the system is
stable.
If lim
t3I
ht3I, the system is unstable. This condition is equivalent to the system
that has one or more poles in the right-half s-plane, or has multiple-order pole(s) on the
jV axis. The system is marginally stable if h(t) approaches a non-zero value or a
bounded oscillation as t approaches infinity. If the system is stable, then the natural
response goes to zero as t 3I. In this case, the natural response is also called the
transient response. If the input signal is periodic, then the corresponding forced
response is called the steady-state response. When the input signal is the sinusoidal
signal in the form of sin Vt,cosVt,ore
jVt
, the steady-state output is called the
sinusoidal steady-state response.
6.1.2 Relationships between the Laplace and z-Transforms
An analog signal x(t) can be converted into a train of narrow pulses x(nT )as
xnTxtd
T
t, 6:1:11
where
d
T
t
I
nÀI
dt À nT6:1:12
represents a unit impulse train and is called a sampling function. Clearly, d
T
t is not
a signal that we could generate physically, but it is a useful mathematical abstrac-
tion when dealing with discrete-time signals. Assuming that xt0 for t < 0, we
have
LAPLACE TRANSFORM
245
xnTxt
I
nÀI
dt À nT
I
n0
xnTdt À nT: 6:1:13
To obtain the frequency characteristics of the sampled signal, take the Laplace
transform of x(nT ) given in (6.1.13). Integrating term-by-term and using the property
of the impulse function
I
ÀI
xtdt À tdt xt, we obtain
Xs
I
ÀI
I
n0
xnTdt À nT
45
e
st
dt
I
n0
xnTe
ÀnsT
: 6:1:14
When defining a complex variable
z e
sT
, 6:1:15
Equation (6.1.14) can be expressed as
XzXsj
ze
sT
I
n0
xnTz
Àn
, 6:1:16
where X(z) is the z-transform of the discrete-time signal x(nT). Thus the z-transform can
be viewed as the Laplace transform of the sampled function x(t) with the change of
variable z e
sT
.
As discussed in Chapter 4, the Fourier transform of a sequence x(nT) can be obtained
from the z-transform by replacing z with e
j!
. That is, by evaluating the z-transform on
the unit circle of jzj1. The whole procedure can be summarized in Figure 6.1.
6.1.3 Mapping Properties
The relationship z e
sT
defined in (6.1.15) represents the mapping of a region in the s-
plane to the z-plane since both s and z are complex variables. Since s s jV,wehave
z e
sT
e
sT
e
jVT
jzje
j!
, 6:1:17
Sampling
Laplace
transform
z-transform
Fourier
transform
z = e
sT
z = e
jw
x(t) x(nT)
X(s) X(z)
X(w)
Figure 6.1 Relationships between the Laplace, Fourier, and z-transforms
246
DESIGN AND IMPLEMENTATION OF IIR FILTERS
w = p
w = 0
w = p/ 2
jΩ
s = 0
−p/T
p/T
s
s > 0
Im z
Re z
|z| = 1
w = 3p/2
s-plane z-plane
s < 0
Figure 6.2 Mapping between the s-plane and z-plane
where the magnitude
jzje
sT
6:1:18a
and the angle
! VT: 6:1:18b
When s 0, the amplitude given in (6.1.18a) is jzj1, and Equation (6.1.17) is
simplified to z e
jVT
. It is apparent that the portion of the jV-axis between
V Àp=T and V p=T in the s-plane is mapped onto the unit circle in the z-plane
from Àp to p as illustrated in Figure 6.2. As V increases from p=T to 3p=T in the
s-plane, another counterclockwise encirclement of the unit circle results in the z-plane.
Thus as V varies from 0 to I, there are an infinite number of encirclements of the unit
circle in the counterclockwise direction. Similarly, there are an infinite numbers of
encirclements of the unit circle in the clockwise direction as V varies from 0 to ÀI.
From (6.1.18a), jzj < 1 when s < 0. Thus each strip of width 2p=T in the left-half of
the s-plane is mapped onto the unit circle. This mapping occurs in the form of con-
centric circles in the z-plane as s varies from 0 to ÀI. Equation (6.1.18a) also implies
that jzj > 1ifs > 0. Thus each strip of width 2p=T in the right-half of the s-plane is
mapped outside of the unit circle. This mapping also occurs in concentric circles in the z-
plane as s varies from 0 to I.
In conclusion, the mapping from the s-plane to the z-plane is not one-to-one, since
there is more than one point in the s-plane that corresponds to a single point in the z-
plane. This issue will be discussed later when we design a digital filter from a given
analog filter.
6.2 Analog Filters
Analog filter design is a well-developed technique. Many of the techniques employed in
studying digital filters are analogous to those used in studying analog filters. The most
systematic approach to designing IIR filters is based on obtaining a suitable analog
filter function and then transforming it into the discrete-time domain. This is not
possible when designing FIR filters as they have no analog counterpart.
ANALOG FILTERS
247
6.2.1 Introduction to Analog Filters
In this section, we briefly introduce some basic concepts of analog filters. Knowledge of
analog filter transfer functions is readily available since analog filters have already been
investigated in great detail. In Section 6.3, we will introduce a conventional powerful
bilinear-transform method to design digital IIR filters utilizing analog filters.
From basic circuit theory, capacitors and inductors have an impedance (X ) that
depends on frequency. It can be expressed as
X
C
1
jVC
6:2:1
and
X
L
jVL, 6:2:2
where C is the capacitance with units in Farads (F), and L is the inductance with units
in Henrys (H). When either component is combined with a resistor, we can build
frequency-dependent voltage dividers. In general, capacitors and resistors are used to
design analog filters since inductors are bulky, more expensive, and do not perform as
well as capacitors.
Example 6.4: Consider a circuit containing a resistor and a capacitor as shown in
Figure 6.3. Applying Ohm's law to this circuit, we have
V
in
IR X
C
and V
out
IR:
From (6.2.1), the transfer function of the circuit is
HV
V
out
V
in
R
R
1
jVC
jVRC
1 jVRC
: 6:2:3
The magnitude response of circuit can be expressed as
jHVj
R
R
2
1
V
2
C
2
r
:
I
C
V
in
X(s)
V
out
Y(s)
R
Figure 6.3 An analog filter with a capacitor and resistor
248
DESIGN AND IMPLEMENTATION OF IIR FILTERS
0
Ω
H(Ω)
1
Figure 6.4 Amplitude response of analog circuit shown in Figure 6.3
The plot of the magnitude response jHVj vs. the frequency V is shown in Figure
6.4. For a constant input voltage, the output is approximately equal to the input at
high frequencies, and the output approaches zero at low frequencies. Therefore
the circuit shown in Figure 6.3 is called a highpass filter since it only allows high
frequencies to pass without attenuation.
The transfer function of the circuit shown in Figure 6.3 is given by
Hs
Ys
Xs
R
R 1=Cs
RCs
1 RCs
: 6:2:4
To design an analog filter, we can use computer programs to calculate the correct values
of the resistor and the capacitor for desired magnitude and phase responses. Unfortu-
nately, the characteristics of the components drift with temperature and time. It is
sometimes necessary to re-tune the circuit while it is being used.
6.2.2 Characteristics of Analog Filters
In this section, we briefly describe some important characteristics of commonly used
analog filters based on lowpass filters. We will discuss frequency transformations for
converting a lowpass filter to highpass, bandpass, and bandstop filters in the next
section. Approximations to the ideal lowpass prototype are obtained by first finding a
polynomial approximation to the desired squared magnitude jHVj
2
, and then con-
verting this polynomial into a rational function. An error criterion is selected to measure
how close the function obtained is to the desired function. These approximations to the
ideal prototype will be discussed briefly based on Butterworth filters, Chebyshev filters
type I and II, elliptic filters, and Bessel filters.
The lowpass Butterworth filter is an all-pole approximation to the ideal filter, which is
characterized by the squared magnitude response
jHVj
2
1
1
À
V
V
p
Á
2L
, 6:2:5
where L is the order of the filter. It is shown that jH0j 1 and jHV
p
j 1=
2
p
or,
equivalently, 20 log
10
jHV
p
j À3 dB for all values of L. Thus V
p
is called the 3-dB
ANALOG FILTERS
249
1 − d
p
|H(Ω)|
1
d
s
Ω
p
Ω
s
Ω
Figure 6.5 Magnitude response of Butterworth lowpass filter
cut-off frequency. The magnitude response of a typical Butterworth lowpass filter is
illustrated in Figure 6.5. This figure shows that the magnitude is monotonically decreas-
ing in both the passband and the stopband. The Butterworth filter has a completely flat
magnitude response over the passband and the stopband. It is often referred to as the
`maximally flat' filter. This flat passband is achieved at the expense of the transition
region from V
p
to V
s
, which has a very slow roll-off. The phase response is nonlinear
around the cut-off frequency.
From the monotonic nature of the magnitude response, it is clear that the specifica-
tions are satisfied if we choose
1 !jHV
p
j ! 1 À d
p
, jVj V
p
6:2:6a
in the passband, and
jHV
s
j d
s
, jVj!V
s
6:2:6b
in the stopband. The order of the filter required to satisfy an attenuation, d
s
,ata
specified frequency, V
s
, can be determined by substituting V V
s
into (6.2.5), resulting
in
L
log
10
1 À d
2
s
À1
2 log
10
V
s
=V
p
: 6:2:7
The parameter L determines how closely the Butterworth characteristic approximates
the ideal filter.
If we increase the order of the filter, the flat region of the passband gets closer to the
cut-off frequency before it drops away and we have the opportunity to improve the roll-
off. Although the Butterworth filter is very easy to design, the rate at which its
magnitude decreases in the frequency range V ! V
p
is rather slow for a small L.
Therefore for a given transition band, the order of the Butterworth filter required is
often higher than that of other types of filters. In addition, for a large L, the overshoot
of the step response of a Butterworth filter is rather large.
To obtain the filter transfer function H(s), we use HsHÀsj
sjV
jHVj
2
.From
(6.2.5), the poles of the Butterworth filter are defined by
250
DESIGN AND IMPLEMENTATION OF IIR FILTERS
1 Às
2
L
0: 6:2:8
By solving this equation, we obtain the poles
s
k
e
j2kLÀ1p=2L
, k 0, 1, ...,2L À 1: 6:2:9
These poles are located uniformly on a unit circle in the s-plane at intervals of p=L
radians. The pole locations are symmetrical with respect to both the real and imaginary
axes. Since 2L À 1 cannot be an even number, it is clear that as there are no poles on the
jV axis, there are exactly L poles in each of the left-and right-half planes.
To obtain a stable Lth-order IIR filter, we choose only the poles in the left-half s-
plane. That is, we choose
s
k
e
j2kLÀ1p=2L
, k 1, 2, ..., L: 6:2:10
Therefore the transfer function of Butterworth filter is defined as
Hs
1
s À s
1
s À s
2
...s À s
L
1
s
L
a
LÀ1
s
LÀ1
... a
1
s 1
: 6:2:11
The coefficients a
k
are real numbers because the poles s
k
are symmetrical with respect to
the imaginary axis. Table 6.2 lists the denominator of the Butterworth filter transfer
function H(s) in factored form for values of L ranging from L 1toL 4.
Example 6.5: Obtain the transfer function of a lowpass Butterworth filter for
L 3. From (6.2.9), the poles are located at
s
0
e
jp=3
, s
1
e
j2p=3
, s
2
e
jp
, s
3
e
j4p=3
, s
4
e
j5p=3
, and s
5
0:
These poles are shown in Figure 6.6. To obtain a stable IIR filter, we choose the
poles in the left-half plane to get
Table 6.2 Analog Butterworth lowpass filter transfer functions
LH(s)
1
1
s 1
2
1
s
2
2
p
s 1
3
1
s 1s
2
s 1
4
1
s
2
0:7653s 1s
2
1:8477s 1
ANALOG FILTERS
251
Hs
1
s À s
1
s À s
2
s À s
3
1
s À e
j2p=3
s À e
jp
s À e
j4p=3
1
s 1s
2
s 1
:
Chebyshev filters permit a certain amount of ripples in the passband, but have a much
steeper roll-off near the cut-off frequency than what the Butterworth design can achieve.
The Chebyshev filter is called the equiripple filter because the ripples are always of equal
size throughout the passband. Even if we place very tight limits on the passband ripple,
the improvement in roll-off is considerable when compared with the Butterworth filter.
There are two types of Chebyshev filters. Type I Chebyshev filters are all-pole filters
that exhibit equiripple behavior in the passband and a monotonic characteristic in the
stopband (see Figure 6.7a). The family of type II Chebyshev filters contains both poles
and zeros, and exhibit a monotonic behavior in the passband and an equiripple behav-
ior in the stopband, as shown in Figure 6.7(b). In general, the Chebyshev filter meets the
specifications with a fewer number of poles than the corresponding Butterworth filter.
Although the Chebyshev filter is an improvement over the Butterworth filter with
respect to the roll-off, it has a poorer phase response.
The sharpest transition from passband to stopband for any given d
p
, d
s
, and L can be
achieved using the elliptic design. In fact, the elliptic filter is the optimum design in this
sense. As shown in Figure 6.8, elliptic filters exhibit equiripple behavior in both the
H(s)
H(−s)
s
2
s
1
s
0
s
5
s
4
s
3
jΩ
s
Figure 6.6 Poles of the Butterworth polynomial for L 3
(b)(a)
1 − d
p
|H(Ω)|
1
d
s
Ω
p
Ω
s
ΩΩ
1 − d
p
|H(Ω)|
1
d
s
Ω
p
Ω
s
Figure 6.7 Magnitude responses of Chebyshev lowpass filters: (a) type I, and (b) type II
252
DESIGN AND IMPLEMENTATION OF IIR FILTERS
1 − d
p
|H(Ω)|
1
d
s
Ω
p
Ω
s
Ω
Figure 6.8 Magnitude response of elliptic lowpass filter
passband and the stopband. In addition, the phase response of elliptic filter is extremely
nonlinear in the passband (especially near cut-off frequency), so we can only use the
design where the phase is not an important design parameter.
Butterworth, Chebyshev, and elliptic filters approximate an ideal rectangular band-
width. The Butterworth filter has a monotonic magnitude response. By allowing ripples
in the passband for type I and in the stopband for type II, the Chebyshev filter can
achieve sharper cutoff with the same number of poles. An elliptic filter has even sharper
cutoffs than the Chebyshev filter for the same complexity, but it results in both pass-
band and stopband ripples. The design of these filters strives to achieve the ideal
magnitude response with trade-offs in phase response.
Bessel filters are a class of all-pole filters that approximate linear phase in the sense of
maximally flat group delay in the passband. However, we must sacrifice steepness in the
transition region. In addition, acceptable Bessel IIR designs are derived by transforma-
tion only for a relatively limited range of specifications such as sufficiently low cut-off
frequency V
p
.
6.2.3 Frequency Transforms
We have discussed the design of prototype analog lowpass filters with a cut-off fre-
quency V
p
. Although the same procedure can be applied to designing highpass, band-
pass, or bandstop filters, it is much easier to obtain these filters from the desired lowpass
filter using frequency transformations. In addition, most classical filter design tables
only generate lowpass filters and must be converted using spectral transformation into
highpass, bandpass, or bandstop filters. Filter design packages such as MATLAB often
incorporate and perform the frequency transformations directly.
Butterworth highpass filter's transfer function H
hp
s can be obtained from the
corresponding lowpass filter's transfer function H(s) by using the relationship
H
hp
sHsj
s
1
s
H
1
s
: 6:2:12
For example, consider L 1. From Table 6.2, we have Hs1=s 1. From (6.2.12),
we obtain
ANALOG FILTERS
253
H
hp
s
1
s 1
s
1
s
s
s 1
: 6:2:13
Similarly, we can calculate H
hp
s for higher order filters. We can show that the
denominator polynomials of H(s)andH
hp
s are the same, but the numerator becomes
s
L
for the Lth-order highpass filters. Thus H
hp
s has an additional Lth-order zero at the
origin, and has identical poles s
k
as given in (6.2.10).
Transfer functions of bandpass filters can be obtained from the corresponding low-
pass filters by replacing s with s
2
V
2
m
=BW. That is,
H
bp
sHs
s
s
2
V
2
m
BW
,
6:2:14
where V
m
is the center frequency of the bandpass filter and BW is its bandwidth. As
illustrated in Figure 5.3 and defined in (5.1.10) and (5.1.11), the center frequency is
defined as
V
m
V
a
V
b
p
, 6:2:15
where V
a
and V
b
are the lower and upper cut-off frequencies. The filter bandwidth is
defined by
BW V
b
À V
a
: 6:2:16
Note that for an Lth-order lowpass filter, we obtain a 2Lth-order bandpass filter
transfer function.
For example, consider L 1. From Table 6.2 and (6.2.14), we have
H
bp
s
1
s 1
s
s
2
V
2
m
BW
BWs
s
2
BWs V
2
m
: 6:2:17
In general, H
bp
s has L zeros at the origin and L pole-pairs.
Bandstop filter transfer functions can be obtained from the corresponding highpass
filters by replacing s in the highpass filter transfer function with s
2
V
2
m
=BWs. That
is,
H
bs
sH
hp
s
s
s
2
V
2
m
BWs
, 6:2:18
where V
m
is the center frequency defined in (6.2.15) and BW is the bandwidth defined in
(6.2.16).
254
DESIGN AND IMPLEMENTATION OF IIR FILTERS
6.3 Design of IIR Filters
In this section, we discuss the design of digital filters that have an infinite impulse
response. In designing IIR filters, the usual starting point will be an analog filter transfer
function H(s). Because analog filter design is a mature and well-developed field, it is
not surprising that we begin the design of digital IIR filters in the analog domain and
then convert the design into the digital domain. The problem is to determine a digital
filter H(z) which will approximate the performance of the desired analog filter H(s).
There are two methods, the impulse-invariant method and the bilinear transform, for
designing digital IIR filters based on existing analog IIR filters. Instead of designing
the digital IIR filter directly, these methods map the digital filter into an equivalent
analog filter, which can be designed by one of the well-developed analog filter
design methods. The designed analog filter is then mapped back into the desired digital
filter.
The impulse-invariant method preserves the impulse response of the original analog
filter by digitizing the impulse response of analog filter, but not its frequency (magni-
tude) response. Because of inherent aliasing, this method is inappropriate for highpass
or bandstop filters. The bilinear-transform method yields very efficient filters, and is
well suited for the design of frequency selective filters. Digital filters resulting from the
bilinear transform will preserve the magnitude response characteristics of the analog
filters, but not the time domain properties. In general, the impulse-invariant method is
good for simulating analog filters, but the bilinear-transform method is better for
designing frequency selective IIR filters.
6.3.1 Review of IIR Filters
As discussed in Chapters 3 and 4, an IIR filter can be specified by its impulse response
fhn, n 0, 1, ...,Ig, I/O difference equation, or transfer function. The general
form of the IIR filter transfer function is defined in (4.3.10) as
Hz
LÀ1
l0
b
l
z
Àl
1
M
m1
a
m
z
Àm
: 6:3:1
The design problem is to find the coefficients b
l
and a
m
so that H(z) satisfies the given
specifications. This IIR filter can be realized by the I/O difference equation
yn
LÀ1
l0
b
l
xn À lÀ
M
m1
a
m
yn À m: 6:3:2
The impulse response h(n) of the IIR filter is the output that results when the input is
the unit impulse response defined in (3.1.1). Given the impulse response, the filter
output y(n) can also be obtained by linear convolution expressed as
DESIGN OF IIR FILTERS
255
ynxnÃhn
I
k0
hkxn À k: 6:3:3
However, Equation (6.3.3) is not computationally feasible because it uses an infinite
number of coefficients. Therefore we restrict our attention to IIR filters that are
described by the linear difference equation given in (6.3.2).
By factoring the numerator and denominator polynomials of H(z) given in (6.3.1) and
assuming M L À 1, the transfer function can be expressed in (4.3.12) as
Hzb
0
M
m1
z À z
m
M
m1
z À p
m
, 6:3:4
where z
m
and p
m
are the mth zero and pole, respectively. For a system to be stable, it is
necessary that all its poles lie strictly inside the unit circle on the z-plane.
6.3.2 Impulse-Invariant Method
The design technique for an impulse-invariant digital filter is illustrated in Figure 6.9.
Assuming the impulse function dt is used as a signal source, the output of the analog
filter will be the impulse response h(t). Sampling this continuous-time impulse response
yields the sample values h(nT). In the second signal path, the impulse function dt is
sampled first to yield the discrete-time impulse sequence dn. Filtering this signal by
H(z) yields the impulse response h(n) of the digital filter. If the coefficients of H(z) are
adjusted so that the impulse response coefficients are identical to the previous specified
h(nT), that is,
hnhnT, 6:3:5
the digital filter H(z) is the impulse invariant equivalent of the analog filter H(s). An
analog filter H(s) and a digital filter H(z) are impulse invariant if the impulse response of
H(z) is the same as the sampled impulse response of H(s). Thus in effect, we sample the
continuous-time impulse response to produce the discrete-time filter as described by
(6.3.5).
d(t)
h(t)
d(n)
H(z)Sampler
H(s) Sampler
h(nT)
h(n)
Figure 6.9 The concept of impulse-invariant design
256
DESIGN AND IMPLEMENTATION OF IIR FILTERS
The impulse-invariant design is usually not performed directly in the form of (6.3.5).
In practice, the transfer function of an analog filter H(s) is first expanded into a partial-
fraction form
Hs
P
i1
c
i
s s
i
, 6:3:6
where s Às
i
is the pole of H(s), and c
i
is the residue of the pole at Às
i
. Note that we
have assumed there are no multiple poles. Taking the inverse Laplace transform of
(6.3.6) yields
ht
P
i1
c
i
e
Às
i
t
, t ! 0, 6:3:7
which is the impulse response of the analog filter H(s).
The impulse response samples are obtained by setting t equal to nT. From (6.3.5) and
(6.3.7), we have
hn
P
i1
c
i
e
Às
i
nT
, n ! 0, 6:3:8
The z-transform of the sampled impulse response is given by
Hz
I
n0
hnz
Àn
P
i1
c
i
I
n0
e
Às
i
T
z
À1
n
P
i1
c
i
1 À e
Às
i
T
z
À1
: 6:3:9
The impulse response of H(z) is obtained by taking the inverse z-transform of (6.3.9).
Therefore the filter described in (6.3.9) has an impulse response equivalent to the
sampled impulse response of the analog filter H(s) defined in (6.3.6). Comparing
(6.3.6) with (6.3.9), the parameters of H(z) may be obtained directly from H(s) without
bothering to evaluate h(t)orh(n).
The magnitude response of the digital filter will be scaled by f
s
1=T due to the
sampling operation. Scaling the magnitude response of the digital filter to approximate
magnitude response of the analog filter requires the multiplication of H(z)byT.
The transfer function of the impulse-invariant digital filter given in (6.3.9) is modified
as
HzT
P
i1
c
i
1 À e
Às
i
T
z
À1
: 6:3:10
The frequency variable ! for the digital filter bears a linear relationship to that for the
analog filter within the operating range of the digital filter. This means that when !
varies from 0 to p around the unit circle in the z-plane, V varies from 0 to p=T along the
jV-axis in the s-plane. Recall that ! VT as given in (3.1.7). Thus critical frequencies
DESIGN OF IIR FILTERS
257
such as cutoff and bandwidth frequencies specified for the digital filter can be used
directly in the design of the analog filter.
Example 6.6: Consider the analog filter expressed as
Hs
0:5s 4
s 1s 2
1:5
s 1
À
1
s 2
:
The impulse response of the filter is
ht1:5e
Àt
À e
À2t
:
Taking the z-transform and scaling by T yields
Hz
1:5T
1 À e
ÀT
z
À1
À
T
1 À e
À2T
z
À1
:
It is interesting to compare the frequency response of the two filters given in Example
6.6. For the analog filter, the frequency response is
HV
0:54 jV
1 jV2 jV
:
For the digital filter, we have
H!
1:5T
1 À e
ÀT
e
Àj!T
À
T
1 À e
À2T
e
Àj!T
:
The DC response of the analog filter is given by
H01, 6:3:11
and
H0
1:5T
1 À e
ÀT
À
T
1 À e
À2T
6:3:12
for the digital filter. Thus the responses are different due to aliasing at DC. For a high
sampling rate, T is small and the approximations e
ÀT
% 1À T and e
À2T
% 1 À 2T are
valid. Thus Equation (6.3.12) can be approximated with
H0%
1:5T
1 À1 À T
À
T
1 À1 À 2T
1: 6:3:13
Therefore by using a high sampling rate, the aliasing effect becomes negligible and the
DC gain is one as shown in (6.3.13).
258
DESIGN AND IMPLEMENTATION OF IIR FILTERS
While the impulse-invariant method is straightforward to use, it suffers from obtaining
a discrete-time system from a continuous-time system by the process of sampling. Recall
that sampling introduces aliasing, and that the frequency response corresponding to the
sequence h(nT) is obtained from (4.4.18) as
H!
1
T
I
kÀI
H V À
2pk
T
: 6:3:14
This is not a one-to-one transformation from the s-plane to the z-plane. Therefore
H!
1
T
HV is true only if HV0 for jVj!p=T. As shown in (6.3.14), H! is
the aliased version of HV. Hence the stopband characteristics are maintained ad-
equately if the aliased tails of HV are sufficiently small. The passband is also affected,
but this effect is usually less serious. Thus the resulting digital filter does not exactly
meet the original design specifications.
In a bandlimited filter, the magnitude response of the analog filter is negligibly small
at frequencies exceeding half the sampling frequency in order to reduce the aliasing
effect. Thus we must have
jH!j 3 0, for ! ! p: 6:3:15
This condition can hold for lowpass and bandpass filters, but not for highpass and
bandstop filters.
MATLAB supports the design of impulse invariant digital filters through the func-
tion impinvar in the Signal Processing Toolbox. The s-domain transfer function is first
defined along with the sampling frequency. The function impinvar determines the
numerator and denominator of the z-domain transfer function. The MATLAB com-
mand is expressed as
[bz, az]= impinvar(b, a, Fs)
where bz and az are the numerator and denominator coefficients of a digital filter, Fs is
the sampling rate, and b and a represent coefficients of the analog filter.
6.3.3 Bilinear Transform
As discussed in the previous section, the time-domain impulse-invariant method of filter
design is simple, but has an undesired aliasing effect. This is because the impulse-
invariant method uses the transformation ! VT or equivalently, z e
sT
. As dis-
cussed in Section 6.1.3, such mapping leads to aliasing problems. In this section,
we discuss the most commonly used technique for designing IIR filters with pre-
scribed magnitude response specifications ± the bilinear transform. The procedure of
designing digital filters using bilinear transform is illustrated in Figure 6.10. Instead
of designing the digital filter directly, this method maps the digital filter specifications to
an equivalent analog filter, which can be designed by using analog filter design methods
introduced in Section 6.2. The designed analog filter is then mapped back to the desired
digital filter.
DESIGN OF IIR FILTERS
259
Digital filter
specifications
Digital filter
H(z)
Bilinear
transform
Bilinear
transform
w → Ω
w ← Ω
Analog filter
specifications
Analog filter
H(s)
Aanlog filter
design
Figure 6.10 Digital IIR filter design using the bilinear transform
The bilinear transform is a mapping or transformation that relates points on the s-
and z-planes. It is defined as
s
2
T
z À 1
z 1
2
T
1 À z
À1
1 z
À1
, 6:3:16
or equivalently,
z
1 T=2s
1 ÀT=2s
: 6:3:17
This is called the bilinear transform because of the linear functions of z in both the
numerator and denominator of (6.3.16).
As discussed in Section 6.1.2, the jV-axis of the s-plane (s 0) maps onto the unit
circle in the z-plane. The left (s < 0) and right (s > 0) halves of the s-plane map into the
inside and outside of the unit circle, respectively. Because the jV-axis maps onto the unit
circle (jzj1), there is a direct relationship between the s-plane frequency V and the z-
plane frequency !. Substituting s jV and z e
j!
into (6.3.16), we have
jV
2
T
e
j!
À 1
e
j!
1
: 6:3:18
It can be easily shown that the corresponding mapping of frequencies is obtained as
V
2
T
tan
!
2
, 6:3:19
or equivalently,
! 2 tan
À1
VT
2
: 6:3:20
Thus the entire jV-axis is compressed into the interval Àp=T, p=T for ! in a one-to-
one manner. The range 0 3Iportion in the s-plane is mapped onto the 0 3 p portion
of the unit circle in the z-plane, while the 0 3ÀIportion in the s-plane is mapped onto
260
DESIGN AND IMPLEMENTATION OF IIR FILTERS
01
ΩT
2
p
p
w
−p
Figure 6.11 Plot of transformation given in (6.3.20)
the 0 3Àp portion of the unit circle in the z-plane. Each point in the s-plane is uniquely
mapped onto the z-plane. This fundamental relation enables us to locate a point V on
the jV-axis for a given point on the unit circle.
The relationship in (6.3.20) between the frequency variables V and ! is illustrated in
Figure 6.11. The bilinear transform provides a one-to-one mapping of the points along
the jV-axis onto the unit circle, i.e., the entire jV axis is mapped uniquely onto the unit
circle, or onto the Nyquist band j!j p. However, the mapping is highly nonlinear. The
point V 0 is mapped to ! 0 (or z 1), and the point V Iis mapped to ! p (or
z À1). The entire band VT ! 1 is compressed onto p=2 ! p. This frequency
compression effect associated with the bilinear transform is known as frequency warp-
ing due to the nonlinearity of the arctangent function given in (6.3.20). This nonlinear
frequency-warping phenomenon must be taken into consideration when designing
digital filters using the bilinear transform. This can be done by pre-warping the critical
frequencies and using frequency scaling.
The bilinear transform guarantees that
Hs
sjV
Hz
z e
j!
, 6:3:21
where H(z) is the transfer function of the digital filter, and H(s) is the transfer function
of an analog filter with the desired frequency characteristics.
6.3.4 Filter Design Using Bilinear Transform
The bilinear transform of an analog filter function H(s) is obtained by simply replacing s
with z using Equation (6.3.16). The filter specifications will be in terms of the critical
frequencies of the digital filter. For example, the critical frequency ! for a lowpass filter
is the bandwidth of the filter, and for a notch filter, it is the notch frequency. If we use
the same critical frequencies for the analog design and then apply the bilinear transform,
the digital filter frequencies would be in error because of the frequency wrapping given
in (6.3.20). Therefore we have to pre-wrap the critical frequencies of the analog filter.
DESIGN OF IIR FILTERS
261
There are three steps involved in the bilinear design procedure. These steps are
summarized as follows:
1. Pre-wrap the critical frequency !
c
of the digital filter using (6.3.19) to obtain the
corresponding analog filter's frequency V
c
.
2. Frequency scale of the designed analog filter H(s) with V
c
to obtain
^
Hs
^
Hsj
ss=V
c
H
s
V
c
, 6:3:22
2. where
^
Hs is the scaled transfer function corresponding to H(s).
3. Replace s in
^
Hs by 2z À 1=z 1T to obtain desired digital filter H(z). That is
Hz
^
Hsj
s2zÀ1=z1T
, 6:3:23
2. where H(z) is the desired digital filter.
Example 6.7: Consider the transfer function of the simple analog lowpass filter
given as
Hs
1
1 s
:
Use this H(s) and the bilinear transform method to design the corresponding
digital lowpass filter whose bandwidth is 1000 Hz and the sampling frequency is
8000 Hz.
The critical frequency for the lowpass filter is the filter bandwidth
!
c
2p1000=8000 radians/sample and T 1=8000 second.
Step 1:
V
c
2
T
tan
!
c
2
2
T
tan
2000p
16 000
2
T
tan
p
8
0:8284
T
:
Step 2: We use frequency scaling to obtain
^
HsHsj
ss=0:8284=T
0:8284
sT 0:8284
:
Step 3: The bilinear transform in (6.3.12) yields the desired transfer function
Hz
^
Hsj
s2zÀ1=z1T
0:2929
1 z
À1
1 À 0:4142z
À1
:
262
DESIGN AND IMPLEMENTATION OF IIR FILTERS
MATLAB provides the function bilinear to design digital filters using the bilinear
transform. The transfer function for the analog prototype is first determined. The
numerator and denominator polynomials of the analog prototype are then mapped to
the polynomials for the digital filter using the bilinear transform. For example, the
following MATLAB script can be used for design a lowpass filter using bilinear trans-
form:
Fs 2000; % Sampling frequency
Wn 2*pi*500; % Edge frequency
n 2; % Order of analog filter
[b, a] butter(n, Wn, `s'); % Design analog filter
[bz, az] bilinear(b, a, Fs); % Determine digital filter
6.4 Realization of IIR Filters
As discussed earlier, a digital IIR filter can be described by the linear convolution
(6.3.3), the transfer function (6.3.1), or the I/O difference equation (6.3.2). These
equations are equivalent mathematically, but may be different in realization. In DSP
implementation, we have to consider the required operations, memory storage, and the
finite wordlength effects. A given transfer function H(z) can be realized in several forms
or configurations. In this section, we will discuss direct-form I, direct-form II, cascade,
and parallel realizations. Many additional structures such as wave digital filters, ladder
structures, and lattice structures can be found in the reference book [7].
6.4.1 Direct Forms
Given an IIR filter described by (6.3.1), the direct-form I realization is defined by the
I/O Equation (6.3.2). It has L M coefficients and needs L M 1 memory locations
to store fxn À l, l 0, 1, ..., L À 1g and fyn À m, m 0, 1, ..., Mg. It also
requires L M multiplications and L M À 1 additions for implementation on
a DSP system. The detailed signal-flow diagram for L M 1 is illustrated in
Figure 4.6.
Example 6.8: Given a second-order IIR filter transfer function
Hz
b
0
b
1
z
À1
b
2
z
À2
1 a
1
z
À1
a
2
z
À2
, 6:4:1
the I/O difference equation of direct-form I realization is described as
ynb
0
xnb
1
xn À 1b
2
xn À 2Àa
1
yn À 1Àa
2
yn À 2: 6:4:2
The signal-flow diagram is illustrated in Figure 6.12.
REALIZATION OF IIR FILTERS
263
As shown in Figure 6.12, the IIR filter can be interpreted as the cascade of two
transfer functions H
1
z and H
2
z. That is,
HzH
1
zH
2
z: 6:4:3
where H
1
zb
0
b
1
z
À1
b
2
z
À2
and H
2
z1=1 a
1
z
À1
a
2
z
À2
. Since multiplica-
tion is commutative, we have
HzH
2
zH
1
z: 6:4:4
Therefore Figure 6.12 can be redrawn as Figure 6.13.
Note that in Figure 6.13, the intermediate signal w(n) is common to both signal
buffers of H
1
z and H
2
z. There is no need to use two separate buffers, thus these
two signal buffers can be combined into one, shared by both filters as illustrated in
Figure 6.14. We observe that this realization requires three memory locations to realize
the second-order IIR filter, as opposed to six memory locations required for the direct-
form I realization given in Figure 6.12. Therefore the direct-form II realization is called
H
1
(z) H
2
(z)
z
−1
z
−1
z
−1
z
−1
x(n)
b
0
b
1
b
2
− a
1
− a
2
y(n)
x(n−1)
x(n−2)
y(n−1)
y(n−2)
Figure 6.12 Direct-form I realization of second-order IIR filter
x(n) y(n)
H
1
(z)H
2
(z)
z
−1
z
−1
z
−1
z
−1
b
0
b
1
b
2
− a
1
− a
2
w(n) w(n)
Figure 6.13 Signal-flow diagram of HzH
2
zH
1
z
264
DESIGN AND IMPLEMENTATION OF IIR FILTERS
w(n−2)
w(n−1)
x(n)
y(n)
b
0
b
2
z
−1
z
−1
− a
2
b
1
− a
1
w(n)
Figure 6.14 Direct-form II realization of second-order IIR filter
the canonical form since it realizes the given transfer function with the smallest possible
numbers of delays, adders, and multipliers.
It is worthwhile verifying that the direct-form II realization does indeed implement
the second-order IIR filter. From Figure 6.14, we have
ynb
0
wnb
1
wn À 1b
2
wn À 2, 6:4:5
where
wnxnÀa
1
wn À 1Àa
2
wn À 2: 6:4:6
Taking the z-transform of both sides of these two equations and re-arranging terms, we
obtain
YzWz b
0
b
1
z
À1
b
2
z
À2
ÀÁ
6:4:7
and
XzWz 1 a
1
z
À1
a
2
z
À2
ÀÁ
: 6:4:8
The overall transfer function equals to
Hz
Yz
Xz
b
0
b
1
z
À1
b
2
z
À2
1 a
1
z
À1
a
2
z
À2
which is identical to (6.4.1). Thus the direct-form II realization described by (6.4.5) and
(6.4.6) is identical to the direct-form I realization described in (6.4.2).
Figure 6.14 can be expanded as Figure 6.15 to realize the general IIR filter defined in
(6.3.1) using the direct-form II structure. The block diagram realization of this system
assumes M L À 1. If M T L À 1, one must draw the maximum number of common
delays. Although direct-form II still satisfies the difference Equation (6.3.2), it does not
implement this difference equation directly. Similar to (6.4.5) and (6.4.6), it is a direct
implementation of a pair of I/O equations:
wnxnÀ
M
m1
a
m
wn À m6:4:9
REALIZATION OF IIR FILTERS
265