Simultaneous determination of sildenafil, vardenafil and tadalafil as forbidden components in natural dietary supplements for male sexual potency by high performance liquid chromatography–electrospray ionization
Bạn đang xem bản rút gọn của tài liệu. Xem và tải ngay bản đầy đủ của tài liệu tại đây (143.76 KB, 7 trang )
Journal of Chromatography A, 1066 (2005) 89–95
Simultaneous determination of sildenafil, vardenafil and tadalafil as
forbidden components in natural dietary supplements for male sexual
potency by high-performance liquid chromatography–electrospray
ionization mass spectrometry
Xiaolan Zhu
a
, Song Xiao
a
, Bo Chen
a,∗
, Fei Zhang
a
, Shouzhuo Yao
a,∗∗
,
Zutian Wan
b
, Dajin Yang
b
, Hongwei Han
b
a
Key Laboratory of Chemical Biology and Traditional Chinese Medicine Research, Ministry of Education,
Hunan Normal University, Changsha 410081, China
b
National Institute for Nutrition and Food Safety, Chinese Center for Disease Control and Prevention, Beijing 100021, China
Received 17 February 2004; received in revised form 17 December 2004; accepted 7 January 2005
Available online 1 February 2005
Abstract
A high-performance liquid chromatographic method coupled with ultraviolet detection and electrospray ionization mass spectrometry
(HPLC–UV–ESI-MS) was developed for simultaneous determination of banned additives—sildenafil, vardenafil and tadalafil in dietary
supplementsformalesexualpotency.TheseparationwasachievedonaC
18
columnwithacetonitrileandaqueoussolution(20 mmol ammonium
acetate, 0.2%formic acid)as mobile phase at a flow rate of 1ml/min witha linear gradient program. UV detection was at 292 nm.Identification
of drugs was accomplished using ESI-MS. Good linearity between response (peak area) and concentration was found over a concentration
range of 0.8–80 g/ml for sildenafil; 2.25–225 g/ml for vardenafil; and 1.1–110 g/ml for tadalafil, with regression coefficient is better than
0.999. The recovery of the method ranged from 93.3 to 106.1%, and the relative standard deviation varied from 2.0 to 5.6% (n=6). The
method has been successfully applied to the analysis of practical samples of natural dietary supplements.
© 2005 Elsevier B.V. All rights reserved.
Keywords: Sildenafil; Vardenafil; Tadalafil; Dietary supplements
1. Introduction
Sildenafil (Viagra), aninhibitor of phosphodiesterase type
5 (PDE5), which was used in the past to treat patients with
pulmonary artery hypertension [1–3], was approved for the
treatment of erectile dysfunction (ED) in man by the US
Food and Drug Administration (FDA). Afterwards, varde-
nafil and tadalafil was also approved for the treatment of ED
[4,5]. These drugs should be administrated under doctors’
∗
Corresponding author. Tel.: +86 731 8865515; fax: +86 731 8865515.
∗∗
Co-Corresponding author.
E-mail addresses: (B. Chen),
(S. Yao).
instruction because their over-dose might cause a series of
side-effects. For example, there were reports that color dis-
criminationerrorscores increasedaftertakingsildenafil[6,7].
Tadalafil and vardenafil are safer than sildenafil, but they still
can cause headache, dyspepsia and back pain [8].
A dietary supplement is a product taken by mouth that
contains a “dietary ingredient” intended to supplement the
diet. The“dietary ingredients” inthese products mayinclude:
vitamins, minerals, herbs or other botanicals, amino acids,
and substances such as enzymes, organ tissues, glandulars,
and metabolites. The dietary supplement manufacturer is re-
sponsible for ensuring that a dietary supplement is safe be-
fore it is marketed. The FDA is responsible for taking action
against any unsafedietary supplementproduct afterit reaches
0021-9673/$ – see front matter © 2005 Elsevier B.V. All rights reserved.
doi:10.1016/j.chroma.2005.01.038
90 X. Zhu et al. / J. Chromatogr. A 1066 (2005) 89–95
the market. In general, natural dietary supplements for male
sexual potency consist of different herbal extracts such as
ginseng root (Panax ginseng C.A. Mey), lychee seed (Litchi
chinensis Sonn.), barbary wolfberry fruit (Lycium barbarum
L.), longan aril (Dimocarpus Longan Lour.), aweto (Cordy-
ceps sinensis (Berk.) Sacc.), common peony root (Paeonia
lactiflora Pall.), Chinese magnoliavine fruit (Schisandra chi-
nensis (Turcz.) Baill), Indian bread (Poria cocos (Schw.)
Wolf), shorthorned epimedium root (Epimedium brevicor-
num Maxim.) and so on. These dietary supplements could
improve male sexual potency without causing any danger,
even when over dose occurs. However, in the Southeastern
Asian market, for the sake of profit, illegal dealers add some
drugs such as sildenafil, vardenafil and so on to their prod-
ucts. The illegal products may endanger people’s health. To
ensure the quality of this kind of dietary supplements and
protect people’s health, it is important to develop a method
to determine these components.
Concerning the analysis of these compounds, there are a
few reports that introduced the strategy for the determination
of sildenafil by the widely used HPLC technology [9–16].
Tracqui and Ludes developed an HPLC–MS method for the
determination of sildenafil [17]; Li et al. reported a method
for determining sildenafil withcapillary electrophoresis [18].
While the strategy for the determination of vardenafil and
tadalafil is seldom reported, simultaneous determination of
these threeanalytes hasbeen seldomreported up-to-date.The
purposeof thisstudywastodevelopamethod fordetermining
sildenafil, vardenafil and tadalafil simultaneously in natural
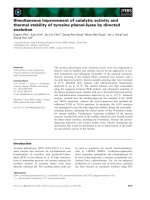
dietary supplements. The structures of these compounds are
shown in Fig. 1. The developed method showed some mer-
its such as specificity, sensitivity, and simplicity in sample
preparation.
2. Experimental
2.1. Materials and chemicals
TheHPLCsystemused wasa Waters (Milford,MA, USA)
Alliance2695 module,which was interfaced toaWaters2487
dual absorbance detector. The mass spectrometer used was a
Micromass ZQ2000 (Manchester, UK)equipped withan ESI
probe and quadrupole analyzer. The control of system and
data acquiring was performanced with Masslynx
3.5
worksta-
tion (Waters).
The standards of sildenafil and tadalafil were obtained
from Hunan Chemicals and Reagent Corp. (Changsha,
China). Vardenafil (>98%, HPLC) was prepared in this labo-
ratory on Waters preparative liquid chromatography of Prep
Fig. 1. The structure of the investigated drugs.
X. Zhu et al. / J. Chromatogr. A 1066 (2005) 89–95 91
Table 1
Main herbal constituents contained in samples
Sample Plant sources
Oral liquid preparation 1 Barbary wolfberry fruit, ginseng root, Chinese magnoliavine fruit
Oral liquid preparation 2 Ginseng root, aweto, Indian bread
Oral liquid preparation 3 Barbary wolfberry fruit, common peony root, Indian bread
Oral liquid preparation 4 Barbary wolfberry fruit, aweto
Oral liquid preparation 5 Barbary wolfberry fruit, shorthorned epimedium root
Wine 1 Chinese magnoliavine fruit, barbary wolfberry fruit, ginseng root
Wine 2 Barbary wolfberry fruit, Indian bread
Wine 3 Ginseng root, Chinese magnoliavine fruit
Beverage Lychee seed
LC 4000 module. Samples for examination were purchased
from supermarket (Changsha, China). All of these products
examined are natural dietary supplements for male sexual
health, not for therapy of ED. The drugs are forbidden to be
added in these products according to the Chinese law. And
these products are also not sexual potency enhancing prepa-
ration. HPLC-grade acetonitrile and methanol were from
Shanghai Ludu Chemical Plant (Shanghai, China). Ultrapure
water was prepared using a Millipore Milli-Q purification
system (Millipore, Bedford, MA, USA). Other reagents were
of analytical grade, including ammonium acetate and formic
acid, triethylamine. Mobiles used for HPLC were filtered
(0.45 m) and ultrasonically degassed before use.
2.2. Preparation of standards
Stock solutions of sildenafil, vardenafil and tadalafil were
prepared in methanol. Their concentrations were 0.80, 2.25
and 1.10 mg/ml, respectively. One milliliter aliquots of each
stock solution were transferred into a 10-ml volumetric flask,
mixed and diluted to volume to yield a mixed standard so-
lution. Then, 5, 2, 1, 0.5, and 0.1 ml of the mixed standard
solution were transferred to five 10-ml volumetric flasks, and
diluted to volume with methanol to yield a series of work-
ing solutions. All stocking solutions and working solutions
were stored ina refrigerator and brought toroomtemperature
before use.
2.3. Preparation of samples
Because the drugs have good solubility in water or
methanol, they are often been added into fluid products such
as wine, beverage, and oral liquid formulation, etc. Hence,
eight liquid products for examination (five oral liquid formu-
lation, two wines, and one beverage, their herbal constituents
are listed in Table 1), waspurchased from a supermarket. The
oralliquid formulationsample was filteredthrougha0.45m
nylon membrane, and 1 ml of the sample transferred into 50-
ml volumetric flask and diluted to volume with methanol.
Then aliquot of the diluted solution was injected into the
HPLC–MS system. The wine sample and beverage sample
were just filtered off and injected into the HPLC–MS system
without further pretreatment.
2.4. HPLC–MS analysis
The separation of the drugs was completed on a spherigel
analytical column (Johnson, Dalian, China), which was
packed with 5 mC
18
sillica. The mobile phase consisted
of acetonitrile (A) and aqueous solution (B) containing
20 mmol/l ammonium acetate and 0.2% formic acid (v/v).
The gradient elution was programmed as follows: A was
maintained at 35% within the first 10min, then linearly in-
creasedto 80%duringthefollowing5 min,thenAmaintained
at80%foranother 5min. Thecolumn waswashedwith 100%
acetonitrile for 5min after gradient elution, and then equili-
brated for 10min with the initial mobile phase for the next
injection. The flow rate was kept at 1 ml/min and the column
temperature was maintained at 30
◦
C. Injection volume was
5 l. The detection wavelength was set at 292nm. The out-
let of the UV detector was split, and only 0.2 ml/min portion
of the column effluent was delivered into the ion source of
MS.
Electrospraywasoperated inpositiveionmode togenerate
protonated ions and sodiated ions. The voltage of capillary,
extractor and RF lens was set at 3.2kV, 4 and 0.5V, respec-
tively. The temperature was maintained at 105 and 200
◦
C
for source and desolvation, respectively. The gas flow rate
for desolvation and cone was set at 250 and 50l/h, respec-
tively.The fullscan massspectra was acquiredovera rangeof
m/z 160–600. Thecone voltage was switched from60to 20 V
in scan mode at the point of 10min according to the electrical
stability of the drugs. In selective ionization recording (SIR),
the cone voltages for sildenafil, vardenafil and tadalafil were
set at 50, 50, and 20 V, respectively.
2.5. Linearity, limit of detection, limit of quantification
The mixed standard solutions (the working solutions) at
each concentration level were injected in triplicate, calibra-
tion curves were constructed by plotting the average peak
areas of the standard compounds against the corresponding
concentrations. Thelimit ofdetection (LOD)of UVdetection
and MS–SIR was evaluated as the mass giving a signal equal
to three times of noise (S/N= 3), the limit of quantification
(LOQ) was determined as the mass giving a signal equal to
ten times of noise (S/N =10).
92 X. Zhu et al. / J. Chromatogr. A 1066 (2005) 89–95
3. Results and discussion
3.1. Mobile phase consideration
Firstly, methanol was applied to separate the tested com-
pounds, however, sildenafil and vardenafil could not be sepa-
ratedundertheuseof amixedmethanolaqueoussolution with
any proportion of organic to aqueous phase. When acetoni-
trile was used, the two substances could be separated, their
retention time and separation resolution mainly depended on
the concentration of acetonitrile in the aqueous solution. A
mobilephase consistingofacetonitrile–waterprogrammed as
described in experimental section provided the best compro-
mise between the separation efficiency and the time duration
of the analytical procedure.
The examined compounds in this work all contain sev-
eral N atoms in their structure; it results in serious peak-
tailing on RP-C
18
column if no modifier was added to the
mobile phase. In order to suppress peak-tailing, the effects of
several additives and their concentration were investigated.
In liquid chromatography, triethylamine was the most com-
mon additive used in analyzing compounds containing N
atoms. In this work, 5, 10, 15, 25, and 50 mmol/l concen-
trations of triethylamine were tested. It was found that when
10 mmol/l triethylaminewas employed, the peak is sharp and
relatively symmetric. When higher concentrations of triethy-
lamine were used, the resulted peak shape was not improved
any more,however the baselineshiftedgreatly when gradient
mobile phase was employed and the resolution of sildenafil
and vardenafil decreased. And the ionization of all analytes
was greatly suppressed, sildenafiland tadalafil gave no signal
even in the SIR chromatogram, and the signal of vardenafil
was very weak. In addition, the effect of ammonium acetate,
asamodifierofthe mobilephase,wasalsoinvestigated.When
20 mmol/l ammonium acetate was used, the peak area RSD
of three consecutive injections for each compound was less
than 5% which is lower than in the case of triethylamine used
as modifier. However, when 50 mmol/l ammonium acetate
was used, the response of sildenafil; vardenafil and tadalafil
decreased 10.5, 18.4, and 20.4%, respectively, compared to
thatwhen20 mmol/lammoniumacetatewasapplied.So,high
concentration of modifier was not recommended.
3.2. MS conditions
The MS parameters were optimized attentively by flow
injection analysis (FIA). ESI is a soft ionization technique,
while sildenafil and vardenafil have a relatively stable struc-
ture, so they can bear higher voltage. They gave little frag-
ment ions under 50 V cone voltage, and produced only a few
fragment ions under 60 V. Tadalafil is easier to be cracked
down, the abundance of its molecular ion was still low even
when the applied cone voltage is higher than 30 V. There-
fore, as described in the previous experimental section, in
SIR mode, the cone voltage for sildenafil and vardenafil was
set at50 V, whilethe conevoltage fortadalafil wasset at 20V;
in scan mode, the cone voltage was set at 60V in the previ-
ous 10min to generate some fragment ions for identification
of sildenafil and vardenafil, then switched to 20 V during the
following 10min.
3.3. HPLC–UV–MS analysis of standards
The examined analytes was baseline separated under the
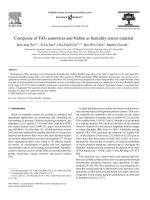
given chromatographic condition. Fig. 2 shows the chro-
matogram of mixed standardsrecorded with 292 nmand with
SIR, the retention times for sildenafil, vardenafil, tadalafil
are 7.9, 8.8, and 14.8 min, respectively. Fig. 3 displays the
mass spectrum of the three compounds. Fig. 3A exhibites the
intensive protonated molecule of sildenafil [M+H]
+
at m/z
475, m/z 497 is the sodiated molecule [M +Na]
+
of sildenafil,
m/z 311 and 283 are the fragment ions of sildenafil. The as-
signment can be done as follows: m/z 311 is the fragment
ion losing an −R
1
group, m/z 283 is the fragment ion los-
ing an [R
1
+ ethyl] group. The same results were obtained
by Weinmann et al. [19] and Walker et al. [20]. The pres-
ence of m/z 489 in Fig. 3B, represents the molecular ion
[M +H]
+
of vardenafil, m/z 311 and 283 are the fragment
ions losing an −R
2
group and [R
2
+ ethyl] group, respec-
tively. And the ion at m/z 390 in Fig. 3C is the molecular
ion [M +H]
+
of tadalafil, m/z 412 is the sodiated molecule
[M +Na]
+
, while m/z 268 is the result of losing an R
3
group.
It can be seen from Fig. 3A and B that sildenafil and varde-
nafil produce the same fragment ions. This is because that
they possess very similar structures and it can partly explain
why the two substances cannot be separated with methanol
as mobile phase.
3.4. Linearity, limit of detection, limit of quantification
Linearity of the three analytes was obtained over concen-
tration range from 0.8 to 80 ppm, 2.25 to 225ppm and 1.1 to
110 ppm, for sildenafil, vardenafil and tadalafil, respectively.
Results are shown in Table 2. All these substances have con-
Table 2
Linearity, limit of detection (LOD), limit of quantification (LOQ) (n=3)
Component Regression equation
a
r
2a
Linear range (ppm)
a
LOD (ng) LOQ (ng)
Sildenafil y = 204x − 48 0.9998 0.8–80 0.80
a
, 0.020
b
3.00
a
Vardenafil y = 152x − 30 0.9998 2.25–225 1.12
a
, 0.011
b
4.48
a
Tadalafil y = 263x + 71 0.9999 1.1–110 0.55
a
, 0.04
b
1.65
a
a
Result with detection at 292 nm.
b
Result with SIR.
X. Zhu et al. / J. Chromatogr. A 1066 (2005) 89–95 93
Fig. 2. The chromatogram of mixed standards. Peak identification: sildenafil
(t
R
= 7.9), vardenafil (t
R
= 8.8) and tadalafil (t
R
= 14.8). The concentration of
the three compounds in the mixture was 16, 45, and 22g/ml, respectively.
jugated structures and displayed intensive ultraviolet absorp-
tion, which resulted in quite a low LOD and LOQ with UV
detection. Hence the UV detection method can be used for
conventional analysisof these compounds even without mass
spectrometry. However, the MS LOD of these compounds
was found to be even much more lower. On line analysis
displays that the proposed HPLC–ESI-MS method is advan-
tageous in trace analysisof these compounds and can provide
structure informationfor identificationwhen no standardsare
available.
Fig. 3. The mass spectrum of examined analytes. (A) Sildenafil, (B) varde-
nafil and (C) tadalafil.
3.5. Precision and accuracy
Precision of the method was evaluated by six consecu-
tive injections of the investigated samples, the resulting RSD
varied from 2.6 to 4.7%.
The accuracy of the methodwas studied by calculatingthe
mean recovery of the target compounds after adding stan-
94 X. Zhu et al. / J. Chromatogr. A 1066 (2005) 89–95
Table 3
Precision and recoveries (n=3)
Sample Component Low level Medium level High level
Added
(mg)
Found (mg) Recovery
(%)
Added
(mg)
Found (mg) Recovery
(%)
Added
(mg)
Found (mg) Recovery
(%)
Sample A (oral liquid
formulation)
Sildenafil 1.3 1.24 ± 0.04 95.410.8 10.4 ± 0.25 96.3 25.7 25.0 ± 0.61 97.3
Vardenafil 1.0 0.94 ± 0.03 94.011.0 10.4 ± 0.26 94.6 24.9 24.8 ± 0.79 99.6
Tadalafil 1.2 1.13 ± 0.04 94.210.5 10.0 ± 0.37 95.2 26.2 27.8 ± 0.59 106.1
Sample B (wine) Sildenafil 1.4 1.33 ± 0.07 95.010.6 10.3 ± 0.32 97.2 25.5 26.5 ± 0.54 104.0
Vardenafil 1.3 1.33 ± 0.06 102.310.9 10.4 ± 0.29 95.4 25.2 26.5 ± 0.63 105.2
Tadalafil 1.5 1.44 ± 0.08 96.010.5 10.1 ± 0.35 96.2 26.2 27.6 ± 0.75 105.3
Sample C (beverage) Sildenafil 1.2 1.24 ± 0.05 103.39.8 9.40 ± 0.33 95.9 25.0 25.8 ± 0.83 103.2
Vardenafil 1.5 1.56 ± 0.06 103.310.5 10.8 ± 0.35 102.9 24.6 25.1 ± 0.76 102.0
Tadalafil 1.2 1.26 ± 0.07 105.010.6 11.0 ± 0.40 103.8 25.9 27.4 ± 0.68 105.8
The result was obtained by employing UV detection at 292nm.
dards to three blank samples (wine, beverage, oral liquid
formulation) at low, medium and high levels. Each sample
of the same concentration was injected at least three times.
The results are summarized in Table 3. From this Table, it
can be seen, that the mean recovery for all three drugs was
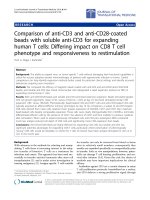
Fig. 4. The chromatogram of sample (oral liquid formulation 5) acquired
with detection at 292 nm. (A) Chromatogram after adding three standards,
(B) chromatogram of sample before adding standards. Peak identification:
1, sildenafil; 2, vardenafil and 3, tadalafil.
94.0–106.1%.These resultsaboutprecisionand accuracymet
the acceptable criteria.
3.6. HPLC–UV–MS analysis of samples
Herbs are very complex because they contain many kinds
of compounds. The samples examined in present work in-
cluded barbary wolfberry fruit, ginseng root, Chinese mag-
noliavine fruit, aweto, Indian bread, common peony root,
shorthorned epimedium root and lychee seed. The com-
positions of all these herbs are rather complicate. How-
Fig. 5. The chromatogramoforalliquid preparation sample 2. (A) Recorded
with detection at 292 nm; (B) recorded with SIR 489.
X. Zhu et al. / J. Chromatogr. A 1066 (2005) 89–95 95
ever, under the above-given conditions, no interference
from these herbs was observed. Fig. 4 shows the chro-
matogram of oral liquid formulation 5 after (A) and before
(B) adding sildenafil, vardenafil and tadalafil standards. It
can be seen that no interfering components were co-eluted
with these three drugs simultaneously. Among the eight ex-
amined samples, one sample (oral liquid fomulation 2) was
found to containvardenafil, its concentrationwas 2.25 mg/ml
(RSD =1.7%, n =6). The chromatogram of this sample is
shown in Fig. 5.
4. Conclusion
With the improvement in production technology of silde-
nafil andits analogouscompounds, thequantity ofthese com-
pounds is becoming bigger and bigger and their prices are
on decline, hence even more of these compounds are being
added to dietary supplements by illegal businessmen. The
method presented in this paper is useful for simultaneous
determination of sildenafil, vardenafil, tadalafil. It can be
employed to inspect those dietary supplements which may
contain these substances to ensure people’s safety, and the
suggested method has the advantage of simplicity, rapidity
and accuracy.
Acknowledgement
This work was financially supported by the Na-
tional Foundation of Key Technologies for Food Safety,
China (2003AA2Z3515, 2001BA804A21, 03JJY1002,
2001BA804A39).
References
[1] N. Danchin, Ann. Cardiol. Angeiol. (Paris) 51 (2002) 341.
[2] B.K. Sastry, C. Narasimhan, N.K. Reddy, B. Anand, G.S. Prakash,
P.R. Raju, D.N. Kumar, Indian Heart J. 54 (2002) 410.
[3] S.S. Kothari, B. Duggal, Indian Heart J. 54 (2002) 404.
[4] H. Porst, Int. J. Impot. Res. Suppl. 1 (2002) 57.
[5] J. Kuan, G. Brock, Expert Opin. Invest. Drugs 11 (2002) 1605.
[6] T.J. McCulley, J.K. Luu, M.F. Marmor, W.J. Feuer, Ophthalmologica
216 (2002) 455.
[7] W.J. Hellstrom, J.W. Overstreet, A. Yu, K. Saikali, W. Shen, C.M.
Beasley, V.S. Watkins, J. Urol. 170 (2003) 887.
[8] L.A. Hicklin, C. Ryan, D.K. Wong, A.E. Hinton, J.R. Soc. Med. 95
(2002) 528.
[9] V. Nagaraju, D. Sreenath, J.T. Rao, R.N. Rao, Anal. Sci. 19 (2003)
1007.
[10] J.Y. Cho, H.S. Lim, K.S. Yu, H.J. Shim, I.J. Jang, S.G. Shin, J.
Chromatogr. B 795 (2003) 179.
[11] J.D. Cooper, D.C. Muirhead, J.E. Taylor, P.R. Baker, J. Chromatogr.
B 701 (1997) 87.
[12] J. Lia, T.W. Chang, J. Chromatogr. B 765 (2001) 161.
[13] M.T. Sheu, A.B. Wu, G.C. Yeh, A. Hsia, H.O. Ho, J. Lia, T.W.
Chang, J. Chromatogr. B 791 (2003) 255.
[14] V. Nagaraju, D. Sreenath, J.T. Rao, R.N. Rao, Anal. Sci. 19 (2003)
1007.
[15] N.D. Dinesh, B.K. Vishukumar, P. Nagaraja, N.M. Made Gowda,
K.S. Rangappa, J. Pharm. Biomed. Anal. 29 (2002) 743.
[16] E. Angela, A. Tom, N.D. Weng, J. Chromatogr. B 768 (2002)
277.
[17] A. Tracqui, B. Ludes, J. Anal. Toxicol. 27 (2003) 88.
[18] R.K. Li, T. Bo, H.W. Liu, K.A. Li, Se Pu 20 (2002) 335.
[19] W. Weinmann, M. Bohnert, A. Wiedemann, M. Renz, N. Lehmann,
S. Pollak, Int. J. Legal Med. 114 (2001) 252.
[20] D.K. Walker, M.J. Ackland, G.C. James, G.J. Muirhead, D.J. Rance,
P. Wastall, P.A. Wright, Xenobiotica 29 (1999) 297.