Assessment of management scenarios to reduce loggerhead turtle interactions with shrimp trawlers in georgia
Bạn đang xem bản rút gọn của tài liệu. Xem và tải ngay bản đầy đủ của tài liệu tại đây (623.57 KB, 11 trang )
BioOne sees sustainable scholarly publishing as an inherently collaborative enterprise connecting authors, nonprofit publishers, academic institutions, research
libraries, and research funders in the common goal of maximizing access to critical research.
Assessment of Management Scenarios to Reduce Loggerhead Turtle Interactions
with Shrimp Trawlers in Georgia
Author(s): Jason A. ScottMark G. DoddSteven B. Castleberry
Source: Marine and Coastal Fisheries: Dynamics, Management, and Ecosystem Science, 5():281-290.
2013.
Published By: American Fisheries Society
URL: />BioOne (www.bioone.org) is a nonprofit, online aggregation of core research in the biological, ecological, and
environmental sciences. BioOne provides a sustainable online platform for over 170 journals and books published
by nonprofit societies, associations, museums, institutions, and presses.
Your use of this PDF, the BioOne Web site, and all posted and associated content indicates your acceptance of
BioOne’s Terms of Use, available at www.bioone.org/page/terms_of_use.
Usage of BioOne content is strictly limited to personal, educational, and non-commercial use. Commercial inquiries
or rights and permissions requests should be directed to the individual publisher as copyright holder.
Marine and Coastal Fisheries: Dynamics, Management, and Ecosystem Science 5:281–290, 2013
C
American Fisheries Society 2013
ISSN: 1942-5120 online
DOI: 10.1080/19425120.2013.829143
ARTICLE
Assessment of Management Scenarios to Reduce
Loggerhead Turtle Interactions with Shrimp Trawlers
in Georgia
Jason A. Scott
Warnell School of Forestry and Natural Resources, University of Georgia, 180 East Green Street, Athens,
Georgia 30602, USA
Mark G. Dodd
Georgia Department of Natural Resources, 1 Conservation Way, Brunswick, Georgia 31520, USA
Steven B. Castleberry*
Warnell School of Forestry and Natural Resources, University of Georgia, 180 East Green Street, Athens,
Georgia 30602, USA
Abstract
Recovery of loggerhead turtle Caretta caretta populations depends on many factors, including reducing anthro-
pogenic mortality of adult turtles. Shrimp trawls are considered a major source of mortality for adult loggerhead
turtles despite the mandatory use of turtle excluder devices. We modeled scenarios for reducing the likelihood of in-
teraction between nesting adult loggerhead turtles and shrimp trawlers operating off the coast of Georgia during the
nesting season (May–August). We used satellite telemetry and aerial surveys to describe the distribution patterns of
nesting adult female turtles (2004–2005; n = 22) and shrimp trawls (1999–2005), respectively, across waters adjacent
to the Georgia shoreline. Adult female turtles and shrimp trawlers both occupied state waters extensively during
the nesting season. Turtles tended to have long, narrow home ranges that were located parallel to shore and that
overlapped with the shrimp trawl distribution, which showed a slight grouping around deep channels. We modeled
the efficacy of fleet reductions and spatial closures (accounting for fleet redistribution) in reducing shrimp trawler
activity around loggerhead turtles. A comparison of spatial closures indicated that a large closure of state waters
(∼200 km
2
) east of Sapelo and Blackbeard islands would reduce mean trawler activity levels in turtle home ranges. We
also found that fleet reductions of 50% or more reduced potential interactions between turtles and trawlers. Although
spatial closures produced a net total reduction in turtle–trawler interactions, fleet reductions yielded a reduction in
such interactions across the study area. We recommend that to reduce loggerhead turtle–trawler interactions, state
agencies should consider a limited-entry system or some other means to limit the number of vessels operating within
state waters.
Five recovery units have been established for the North-
west Atlantic population of loggerhead turtles Caretta caretta;
the Northern Recovery Unit extends from the Florida–Georgia
border to the northern extent of the nesting range in Virginia.
Subject editor: Debra J. Murie, University of Florida, Gainesville
*Corresponding author:
Received October 2, 2012; accepted July 17, 2013
The Northern Recovery Unit is the second-largest nesting ag-
gregation, but the number of nests has declined at a rate of
1.3% annually since 1983 (NMFS and USFWS 2008). Declines
have continued despite comprehensive nest protection efforts
281
282 SCOTT ET AL.
spanning more than three decades and despite the mandatory
use of turtle excluder devices (TEDs) in all commercial shrimp
trawl nets since the 1990s. Even with the use of TEDs, bot-
tom trawls like those used in the commercial shrimp fishery
are listed as one of several highest priority threats that limit
the species’ recovery. Noncompliance with proper TED instal-
lation regulations, lack of adequate enforcement, and repeated
sequential captures of loggerhead turtles have been identified
as potential sources of mortality (Turtle Expert Working Group
1998; Lewison et al. 2004; NMFS and USFWS 2008). Adult
female loggerhead turtles are especially important for recovery
of the species (Crouse et al. 1987) but may be susceptible to in-
cidental capture by shrimp trawls during the nesting season. A
better understanding of in-water movement patterns by nesting
females is needed to effectively evaluate alternative manage-
ment approaches that aim to limit interactions between shrimp
trawls and loggerhead turtles (Hawkes et al. 2011).
The nesting season for loggerhead turtles in the Northern
Recovery Unit begins in early May and continues through mid-
August (Richardson 1980). Females may lay up to seven or eight
clutches during a nesting season (Talbert et al. 1980; Lenarz
et al. 1981; Tucker 2010), with estimated means of 4.1 (Mur-
phy and Hopkins 1984) and 5.4 nests/female per season (Tucker
2010). The internesting interval (number of days between con-
secutively laid nests by a single individual) is approximately
14 d (Richardson 1980). The distribution and movement be-
havior of loggerhead turtles between nesting events are poorly
understood for the Northern Recovery Unit, although anecdotal
evidence suggests that the turtles stay within 10 km of shore
and sometimes enter estuarine habitats behind barrier islands
(Stoneburner 1982; Hopkins-Murphy et al. 2003). Some turtles
associate with areas of high relief, such as shipping channels or
shoals (Hopkins-Murphy et al. 2003).
Reducing the interactions between the commercial shrimp
trawl fishery and loggerhead turtles of the northern subpopula-
tion is a priority action necessary to recover the species (NMFS
and USFWS 2008). The South Atlantic Fishery Management
Council (SAFMC 2002) stated that possible management op-
tions could encompass an overall reduction in fishing effort or
temporal and spatial closures. Detailed information on move-
ments and habitat use is critical for assessing the efficacy of
proposed management strategies for reducing shrimp trawler-
related mortality in the northern subpopulation of loggerhead
turtles, yet much of this information is lacking. Considerable
effort has been spent describing loggerhead turtle movements
during critical life history stages, with suggestions for using the
data to improve management and aid conservation (Sakamoto
et al. 1997; Mansfield et al. 2009; Marcovaldi et al. 2010; Tucker
2010; Hawkes et al. 2011; Kobayashi et al. 2011; Arendt et al.
2012). However, habitat models and movement data are most
useful when they are used to make predictions about conse-
quences of management actions (Conroy and Moore 2002). Use
of loggerhead turtle movement data to forecast the outcomes of
proposed management actions has not been attempted.
Our goal was to demonstrate the use of loggerhead turtle
movement data in forecasting the results of proposed man-
agement actions prior to implementation. Specifically, we used
movement patterns of loggerhead turtles to evaluate the efficacy
of different management scenarios in reducing the potential for
interaction between shrimp trawls and loggerhead turtles dur-
ing the nesting season in waters adjacent to the Georgia coast.
We established an index of trawler activity occurring around
loggerhead turtle use areas; we then modeled the expected
change in the trawler activity index (TAI) after the implementa-
tion of different spatial closure and shrimp trawl fleet reduction
scenarios.
METHODS
Distribution Patterns
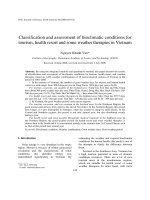
Nesting loggerhead turtles (n = 24) were captured and tagged
during night patrols on four Georgia barrier islands (Figure 1)
during the 2004 and 2005 nesting seasons (n = 12 turtles/year).
Patrols began in mid-May during each season and continued
until all transmitters were deployed (July 7 in 2004; May 31 in
FIGURE 1. Capture locations of loggerhead turtles (n = 24) during the 2004
and 2005 nesting seasons on four barrier islands in Georgia.
LOGGERHEAD TURTLE INTERACTIONS WITH TRAWLERS 283
2005). Females that were encountered on the beach were fitted
with platform terminal transponders (Model ST-20; Telonics,
Inc.), sonic transmitters (modified Model CHP-87-S; Sonotron-
ics), and (in 2005 only) very high frequency (VHF) radio trans-
mitters (MOD-305; Telonics). Attachment methods followed
those detailed by Mitchell (2000).
Upon release of the turtles, Geostationary Operational En-
vironmental Satellites (National Oceanic and Atmospheric Ad-
ministration) monitored the platform terminal transponder sig-
nals on a continuous duty cycle (CLS 1996). Only fixes from
satellite transmitters of location classes 3, 2, 1, and A were
used. Location classes 0 and B were excluded due to excessive
error (Hays et al. 2001; Vincent et al. 2002; Scott 2006). Man-
ual tracking by boat using VHF and sonic telemetry occurred
during daylight hours. Loggerhead turtle locations from manual
tracking efforts were visually confirmed by waiting for the tur-
tle to surface (Collazo and Epperly 1995). Location coordinates
for each manually located turtle were recorded with a handheld
GPS unit.
Prior to analyzing the distribution and movement patterns
of marked loggerhead turtles, the satellite telemetry location
database and manual tracking database were combined and
subjected to censoring processes to eliminate duplicate entries,
outliers based on liberal swim speed restrictions (i.e., a dis-
tance greater than would be expected for a turtle swimming
10 km/h between point locations), and locations appearing on
land beyond the error range. A 2-h minimum time period be-
tween points was also imposed on the combined database to
reduce serial autocorrelation between successive points while
maintaining adequate sample sizes (De Solla et al. 1999). For
cases in which elimination of a location was required due to
autocorrelation, the location with the highest quality level was
retained. Location quality was ranked from highest to lowest as
visual observation, followed by satellite location classes 3, 2, 1,
and A, respectively. If quality levels were identical, the earliest
location was kept.
Loggerhead turtle home ranges were estimated using fixed
kernel densities (FKDs) at the 95% use level and 50% core area
level (Worton 1989), with least-squares cross validation as the
smoothing factor (Blundell et al. 2001). Only loggerhead turtles
that yielded 15 or more locations during the internesting interval
were included (Blundell et al. 2001). Portions of home ranges
that overlapped with land were eliminated.
Bi-monthly aerial surveys of shrimp trawlers were conducted
by the Georgia Department of Natural Resources during day-
light hours over state and federal jurisdictional waters off the
Georgia coast for seven consecutive years (1999–2005), with
standardized methods used across all flights. Location coordi-
nates for every shrimp trawl vessel observed during the sur-
veys were recorded by using handheld GPS units. The trawler
location database was filtered to include only locations of ac-
tively trawling vessels while eliminating locations of trawlers
that were hauling in nets, anchored, or traveling. Furthermore,
these analyses only included flights that occurred between May
and August (i.e., coinciding with loggerhead turtle observations
during the nesting season).
Baseline Trawler Activity
To evaluate the merits of management scenarios, we first es-
tablished a baseline estimate of observed trawler activity levels
around loggerhead turtle use areas. The turtle use areas were
defined by 95% and 50% FKD home range contours. Within
each home range, observed trawling activity was calculated as
the mean density of trawlers (trawlers/km
2
) observed per flight
within each home range. We used the density of trawlers per
flight as the observed TAI value. The TAI essentially described
the 7-year average daily trawler density that occurred within the
area of each home range during the nesting season. We assumed
that loggerhead turtles occupying areas with consistently high
trawler activity over the 7-year period had a higher probabil-
ity of interaction with trawls than turtles occupying areas with
consistently low trawler activity.
A null distribution of trawlers was created to identify patterns
in the observed trawler distribution relative to loggerhead turtle
use areas. To produce the null trawler distribution, a random
point generator extension in ArcMap version 9.2 (ESRI 2008)
assigned new latitude and longitude coordinates to each trawler
location. Random trawler locations were restricted to within
9.6 km from shore, were excluded from estuaries, and occurred
in equal proportion to how they were originally distributed rel-
ative to state and federal water boundaries (i.e., 87.5% in state
waters). For each loggerhead turtle, 10 iterations of the random
redistribution of trawlers for the null model were conducted,
with a new TAI calculated each time. The 10 new TAI values
for each turtle were then averaged to provide an estimated null
TAI value. Comparisons between the observed and null distri-
butions were made by dividing the null TAI by the observed
TAI for each loggerhead turtle. A TAI ratio (null TAI/observed
TAI) equal to 1.0 indicated that the observed trawler distribution
occurred in a random pattern—that is, the TAI did not change
when the trawler locations were randomized multiple times. If
the TAI ratio was greater than 1.0, the observed trawler distribu-
tion would be best described as “clumped” but in areas that were
not heavily used by loggerhead turtles (i.e., the randomized null
distribution created a higher TAI than originally observed). If
the TAI ratio was less than 1.0, the observed trawler distribution
would be best described as clumped in areas that were also used
heavily by loggerhead turtles (i.e., the randomized trawler dis-
tribution reduced the TAI around the turtles in comparison with
the baseline observations).
Management Scenarios
Management scenarios were created by following concep-
tual formats outlined by the South Atlantic Fishery Management
Council (SAFMC 2002). Options that were considered included
spatial closures—either a single large closure or configurations
of several small closures—and variable levels of fleet reduc-
tion. Potential utility of the different management scenarios was
284 SCOTT ET AL.
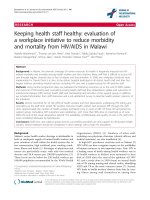
FIGURE 2. Shapes and locations of the three single large area closure scenarios evaluated for Georgia: (A) the Cumberland Island (Cumberland) and Sapelo
Island–Blackbeard Island (Sapelo) closure scenarios; and (B) the statewide 1.6-km closure scenario. Maps show the 4.8-km state jurisdictional boundary and the
locations of deep channels maintained between barrier islands.
evaluated by simulating the redistribution patterns of the com-
mercial shrimp trawler fleet to create new trawler distributions.
The new predicted distributions of trawlers were then used to
calculate new TAI values for each loggerhead turtle, thereby
allowing direct comparison with baseline values.
Spatial closures.—Preliminary analyses of loggerhead turtle
and shrimp trawler distributions were used to identify bound-
aries of potential spatial closures. Areas of high overlap between
the two distributions were identified and used to delineate the
boundaries of the potential closure areas. We developed three
scenarios involving a single large closure area and one scenario
that involved several small closures. One management scenario
was a single large closure from the eastern shore of Cumberland
Island (Cumberland closure) to the state water boundary 4.8 km
offshore (Figure 2A). Cumberland Island is considered a major
nesting beach in Georgia (Georgia Department of Natural Re-
sources, unpublished data). A single large closure east of the
Sapelo Island–Blackbeard Island complex (Sapelo closure) was
also delineated (Figure 2A). Like the Cumberland closure, the
Sapelo closure’s boundary extended from the shore to the state
water jurisdiction line 4.8 km offshore. Sapelo and Blackbeard
islands are also considered major nesting beaches (NMFS and
USFWS 2008). The third single large closure scenario was a
statewide closure that encompassed the waters within 1.6 km (1
mi) of shore (statewide 1.6-km closure), thus leaving 3.2 km (2
mi) of state waters open to commercial shrimp trawling (Fig-
ure 2B).A statewide 1.6-km closurewas developed becauseboth
trawlers and loggerhead turtles tended to locate close to shore.
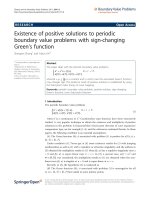
The final closure scenario established several smaller protected
areas focused around deep channel locations (channel closure)
identified across coastal Georgia (Figure 3). The closure bound-
ary for each channel was delineated by placing a 1-km buffer
around the channel area.
New TAI values were calculated for each loggerhead turtle
under each spatial closure scenario. Trawler locations within the
spatial closure boundaries were counted and removed from the
database, thus simulating the exclusion of trawlers from those
areas. Because displaced trawlers likely would continue to fish,
LOGGERHEAD TURTLE INTERACTIONS WITH TRAWLERS 285
FIGURE 3. Shapes and locations of the several small closure areas delineated
for the channel closure scenario in Georgia.
an equal number of trawler locations were redistributed across
the extent of trawler use as determined from the aerial surveys.
Uncertainty existed as to how the displaced trawlers would re-
distribute when faced with a closure around an area in which
they previously operated (Stelzenm
¨
uller et al. 2008; Greenstreet
et al. 2009). Thus, three competing hypotheses that described
potential trawler redistribution patterns were evaluated. The first
hypothesis was that trawlers would relocate randomly within a
2-km buffer along the outside edge of the closure boundary
(Sweeting and Polunin 2005). The premise behind this predic-
tion was twofold: (1) shrimp boat captains would want to stay
near areas they previously fished (Mason et al. 2012) and (2)
the captains would view the sanctuary as a source population of
shrimp and would concentrate operation around closure edges,
gleaning shrimp outflow from the unexploited sanctuary area
(Mason et al. 2012). The second hypothesis was that trawlers
would relocate randomly across the study area but would do
so in equal proportion to their pre-closure distribution within
state and federal jurisdictional waters (Hiddink et al. 2006).
The third hypothesis was that trawlers would redistribute ran-
domly across the study area but would remain in equal propor-
tion to the pre-closure distribution of low-density (0.001–2.5
trawlers/km
2
), medium-density (2.501–5.0 trawlers/km
2
), and
high-density (>5.0 trawlers/km
2
) areas (Hiddink et al. 2006;
Hunter et al. 2006). Homogeneity in displaced trawlers’ re-
sponses to a closure was considered unlikely due to individ-
ual human choice and the many influencing factors driving that
choice (Stelzenm
¨
uller et al. 2008). Any single trawler redistribu-
tion hypothesis would not be a clear predictor of how all trawler
captains would respond to closures (Hiddink et al. 2006). Belief
in the different redistribution hypotheses was considered equal,
so consecutive TAI values predicted for individual loggerhead
turtles under each of the three hypotheses were averaged to pro-
duce a new mean TAI value for each turtle. Ten iterations of
the three-hypothesis trawler redistribution model were run, pro-
ducing a mean estimated TAI value for each loggerhead turtle
under each spatial closure management scenario.
Fleet reductions.—Potential management scenarios repre-
senting 10, 30, 50, 70, and 90% fleet reductions were simulated.
New TAI values were calculated for each loggerhead turtle un-
der each fleet reduction scenario. To simulate fleet reductions,
the corresponding proportions of trawler locations were ran-
domly eliminated from the trawler database. Remaining trawler
locations were used to recalculate the new TAI for each log-
gerhead turtle. Ten iterations of each trawler reduction model
were performed, producing a mean estimatedTAI value for each
loggerhead turtle under each fleet reduction scenario.
Model Evaluation
Paired t-tests were performed to compare baseline TAI values
among loggerhead turtles to the TAI values produced from each
management scenario. Potential impacts of the management
scenarios on mean trawler activity within each measure of home
range or core use area (95% and 50% contours) were tested
separately. We defined a meaningful reduction in turtle–trawler
interaction as one for which the TAI after implementation of the
management scenario differed significantly from the baseline
TAI value (α = 0.05).
RESULTS
Distribution Patterns
We were unable to obtain sufficient tracking data for two
of our tagged loggerhead turtles. For the data from the other
22 turtles, the censoring process reduced the total number of
usable locations by 26.7% to 955 locations. The 22 turtles pro-
vided adequate sample size for inclusion in analyses, with a
mean of 43.4 usable locations/turtle (SE = 9.8; range = 16–
107 locations/turtle). The turtles for which there were adequate
data were tracked for an average of 42.6 d (SE = 4.0; range =
24–65 d). Loggerhead turtles exhibited wide variability in esti-
mated 95% FKD home range size, averaging 206.5 km
2
(SE =
173.8) and ranging from 7.0 to 1,750.0 km
2
. Similar variabil-
ity was observed for the 50% core area sizes, which averaged
25.2 km
2
(SE = 22.9)and ranged from 0.3to 244.8 km
2
. Tracked
286 SCOTT ET AL.
FIGURE 4. Mean proportion of loggerhead turtle locations (2004–2005) and
shrimp trawler locations (1999–2005) occurring in state and federal jurisdic-
tional waters. Error bars represent 95% CI around the means.
loggerhead turtles were observed to extensively use state juris-
dictional waters (mean percentage of observations; Figure 4),
with the majority of the turtles (n = 20), termed “nearshore
turtles,” located on average 2.7 km (SE = 0.7) from shore (Fig-
ure 5). Theother two individuals, termed“offshore turtles,”were
located on average 26.0 km (SE = 12.2) from shore. In addition,
locations for each loggerhead turtle tended to be distributed par-
allel to shore (Figure 5). Half of the sample population (n =
11) used less than 40 km of shoreline each during their respec-
tive in-water movements over the duration of the nesting season
(mean = 71.4 km; SE = 29.3; range = 15.3–286.6 km). Home
ranges of individual turtles overlapped extensively.
During the 7 years of trawler activity monitoring, 43 flights
occurred between May and August, recording 3,221 trawler
locations (mean = 81.6 trawlers/flight). Of those trawler loca-
tions, 87.5% occurred in Georgia state jurisdictional waters, and
the remaining trawler locations occurred within the first 4.8 km
of federal water jurisdiction (Figure 6). Shrimp trawlers also
tended to locate close to shore, with just over 40% of the ob-
servations occurring within the first 2.1 km from shore. Over
one-quarter (27.6%) of the observed trawler locations were po-
sitioned within 1 km of deep channels, an area that makes up
just 13.8% of the available seascape within 9.6 km of shore
(excluding estuaries, which are closed to trawlers).
The general distribution pattern observed in trawler locations
within 9.6 km of shore was best described as being random
relative to loggerhead turtle distribution (Figure 6). The TAI
ratio was less than 1.0 (0.85), indicating a clustering of trawler
locations aroundspecific areasthat were also used by loggerhead
turtles.
Management Scenarios
Spatial closures.—There was no discernible relationship be-
tween the impact of a spatial closure on the TAI and the number
FIGURE 5. Three representative 95% fixed kernel density home ranges esti-
mated for female loggerhead turtles that were tagged while nesting on Georgia
barrier islands in 2004 and 2005.
of trawlers that were displaced by the different spatial closures
(Table 1). The scenarios of a single large spatial closure gen-
erally reduced mean TAI values more than the channel closure
scenario, regardless of the home range contour evaluated (95%
or 50%; Table 2). Mean TAI values produced by the channel clo-
sure scenario appeared to be nearly unchanged from the baseline
TAI values after accounting for trawler redistribution. Only the
Sapelo closure consistently resulted in predicted TAI reductions
(P < 0.05) relative to the baseline TAI calculated from ob-
served trawler locations (Table 2). Although similar in size to
the Sapelo closure, the Cumberland closure did not produce a
significant reduction in overall trawler activity in the study area.
The statewide 1.6-km closure displaced more trawlers (Table 1),
but there was no evidence that this closure would reduce trawl
interactions with loggerhead turtles.
Fleet reductions.—The TAI values for loggerhead turtle use
areas decreased as the level of trawler fleet reduction increased.
A significant reduction in TAI within the 95% home ranges
was observed after a 30% fleet reduction, but the trend was
not repeated for the turtle core use areas (Table 2). A 50%
fleet reduction (∼42 active trawlers/d) was required before a
LOGGERHEAD TURTLE INTERACTIONS WITH TRAWLERS 287
FIGURE 6. Locations of shrimp trawlers (1999–2005) and loggerhead turtles
(2004–2005) in waters adjacent to the Georgia coast.
significant decrease in TAI was observed in both the 95% home
ranges and 50% core use areas of tracked turtles (Table 2).
DISCUSSION
Our results indicated that only the Sapelo closure or a 50%
or greater reduction in the shrimp trawl fleet would generate
meaningful reductions in trawler activity around female logger-
head turtles in waters adjacent to the Georgia coast. Despite the
apparent benefits of the Sapelo closure, fleet reduction would
likely provide the greatest overall reduction in turtle interactions
with trawlers. Fleet reductions would reduce the probability of
trawler interaction for allfemale turtles regardless of home range
distribution, whereas closure of limited areas would only ben-
efit turtles that have home ranges overlapping the closure area.
Although all of the spatial closures showed reductions in TAI
for turtle home ranges that overlapped heavily with the closure
area, redistribution of trawler activity outside of the boundaries
actually resulted in an increased probability of trawl interaction
for turtles outside of the closure areas. Given uncertainty about
the distribution of the total nesting turtle population and shrimp
trawler displacement after spatial closures, the observed consis-
tency of fleet reduction in reducing turtle–trawler interactions
supports its merit as the most effective management strategy.
The Sapelo closure scenario was the only spatial closure op-
tion that offered a potentially meaningful reduction in trawler
activity around loggerhead turtles. The Cumberland closure was
similar in size and shapeto the Sapelo closure, but fewer trawlers
were displaced and fewer turtle home ranges overlapped with
the closure area (Table 1), which appeared to limit the Cum-
berland closure’s effectiveness in reducing turtle–trawl inter-
actions. This result supports the idea that the distribution and
movements of both turtles and trawlers relative to the closure
area are primary considerations for spatial closures (Murawski
et al. 2000; Meyer and Holland 2005). Although the statewide
1.6-km closure displaced more trawlers and was nearly dou-
ble in total area than the Sapelo closure, it produced little de-
crease in trawler activity around loggerhead turtles. The shape
of the statewide 1.6-km closure area (i.e., narrow and parallel
to shore) meant that the area bisected many loggerhead turtle
home ranges but did not encompass any home range completely.
In our simulations, trawlers that were displaced by the statewide
1.6-km closure redistributed back into loggerhead turtle home
ranges, thus negating the potential effectiveness of the closure.
Similarly, our channel closure management scenario resulted
in displaced trawlers relocating back into turtle home ranges
despite the large overall closure area and the large number of
TABLE 1. Characteristics of shrimp trawling spatial closure scenarios (see Methods) that were evaluated for their potential impacts on adult female loggerhead
turtles during the nesting season off the Georgia coast.
Closure area Percent of total Number of Trawler Closure overlap
Closure scenario Closure type (km
2
)area
a
trawlers
b
density
c
(%)
d
Statewide 1.6-km closure Single large 357.0 17.8 1,083 3.0 100
Cumberland closure Single large 200.8 10.0 362 1.8 55
Sapelo closure Single large 201.4 10.0 612 3.0 68
Channel closure Several small 270.0 13.5 853 3.2 95
a
Percentage of the closure area relative to the total area (2,006.6 km
2
) of waters used by shrimp trawlers (0.0–9.6 km from shore).
b
Total number of trawler positions recorded within each closure boundary during aerial surveys (n = 43) between 1999 and 2005.
c
Trawler observations/km
2
.
d
Percentage of tracked turtles (n = 22) with home ranges (95% fixed kernel densities) that completely or partially overlapped with the closure area.
288 SCOTT ET AL.
TABLE 2. Predicted mean trawler activity index (TAI) values estimated within the 95% and 50% fixed kernel density (FKD) home ranges of 22 adult female
loggerhead turtles that were tagged during the 2004 and 2005 nesting seasons on Georgia barrier islands. The P-values represent results from paired t-tests
comparing post-management-scenario mean TAI values with baseline TAI values (bold italics indicate significance: P < 0.05). See Methods for definition of the
management scenarios.
95% FKD contour 50% FKD contour
Management scenario Mean TAI
a
SE P-value Mean TAI SE P-value
Baseline 0.335 0.033 0.414 0.061
Statewide 1.6-km closure 0.267 0.027 0.120 0.302 0.051 0.166
Cumberland closure 0.293 0.042 0.437 0.362 0.072 0.582
Sapelo closure 0.223 0.033 0.022 0.219 0.049 0.016
Channel closure 0.330 0.032 0.924 0.365 0.064 0.582
10% fleet reduction 0.302 0.030 0.462 0.372 0.055 0.612
30% fleet reduction 0.234 0.023 0.017 0.290 0.042 0.101
50% fleet reduction 0.167 0.016 <0.0001 0.207 0.030 0.004
70% fleet reduction 0.100 0.010 <0.0001 0.122 0.018 <0.0001
90% fleet reduction 0.033 0.003 <0.0001 0.041 0.006 <0.0001
a
Mean TAI value calculated across all turtles.
trawlers that were displaced. Based on our results, single large
spatial closures that cover areas of maximum overlap between
high trawler activity and high loggerhead turtle activity would
be most likely to produce a significant decline in trawler activity
around turtles.
Our study was based on a comparison of loggerhead turtle
and shrimp trawler distributions to identify potential areas of
overlap. The evaluation of concurrent commercial fishery and
species distributional data to identify potential management op-
tions is a relatively new concept for sea turtle management (e.g.,
Kobayashi and Polovina 2005) but has been frequently applied
in fisheriesmanagement systems (Goodyear 1999; Sweeting and
Polunin 2005; Hunter et al. 2006). Such modeling approaches
necessitate a simplification of the study system and often re-
quire assumptions that cannot be explicitly tested. We used a
7-year average of trawler activity observed within areas that
were inhabited by loggerhead turtles as a proxy for the risk of
interaction between turtles and trawlers. Although trawler ac-
tivity in areas with turtles present is likely to increase the risk
of interaction, the outcome of an interaction is based on multi-
ple factors (e.g., behavior of individual trawlers and turtles) that
could not be incorporated into our models. We also incorporated
assumptions about how trawl captains would react to spatial clo-
sures. Because we did not have observational data describing
trawl fishing behavior after an actual closure, we averaged the
results of the three redistribution hypotheses, effectively giv-
ing each hypothesis equal weight. Despite these simplifications,
our models offer promise for evaluating potential management
actions prior to implementation and provide guidance for data
requirements in future studies to increase model reliability.
The in-water management of loggerhead turtles during
nesting-season movements falls heavily on state resource man-
agers. Based on our results from Georgia, the best manage-
ment option for decreasing the likelihood of interactions be-
tween shrimp trawlers and loggerhead turtles during the nesting
season is a 50% reduction in the fleet. Heavier reductions of
trawler activity were more effective in reducing interactions but
would have greater economic impacts on the state’s commer-
cial shrimp trawl fishery. Although one spatial closure scenario
showed promise for reducing turtle–trawl interactions, spatial
closures generally did not offer consistent reductions due to the
displacement of trawlers out of the closure area and into areas
used by other turtles.
The impetus of our study was to determine effective options
for managing loggerhead turtles in Georgia waters and directly
adjacent federal waters. However, our study provides a predic-
tive mechanism that can be more broadly applied. The majority
of nesting loggerhead turtles in the Northwest Atlantic popu-
lation occur in the Northern Recovery Unit and the Peninsular
Florida Recovery Unit (NMFS and USFWS 2008). Because the
threat from commercial shrimp fishing exists throughout these
two units, our approach to evaluating the effect of management
scenarios can be applied to both units, potentially benefiting the
majority of the Northwest Atlantic nesting population of log-
gerhead turtles. If improved management is the primary goal
for research, future loggerhead turtle tracking studies could be
conducted under a similar framework to evaluate management
options prior to implementation.
ACKNOWLEDGMENTS
Funding for this research was provided by the Protected
Species Cooperative Conservation Grant Program of the Na-
tional Oceanic and Atmospheric Administration; additional
funding and local support were provided by the Georgia De-
partment of Natural Resources’ Nongame Conservation Fund.
We thank G. Martin, M. McElroy, K. Sparks, and S. Truesdell
LOGGERHEAD TURTLE INTERACTIONS WITH TRAWLERS 289
for field assistance and J. Carroll and A. Fisk for providing
manuscript reviews.
REFERENCES
Arendt, M. D., A. L. Segars, J. I. Byrd, J. Boynton, J. A. Schwenter, J. D.
Whitaker, and L. Parker. 2012. Migration, distribution, and diving behavior
of adult male loggerhead sea turtles (Caretta caretta) following dispersal
from a major breeding aggregation in the western North Atlantic. Marine
Biology 159:113–125.
Blundell, G. M., J. A. K. Maier, and E. M. Debevec. 2001. Linear home ranges:
effects of smoothing, sample size, and autocorrelation on kernel estimates.
Ecological Monographs 71:469–489.
CLS (Collecte Localisation Satellites). 1996. Argos user’s manual. CLS, Ra-
monville, Saint-Agne, France.
Collazo, J. A., and S. P.Epperly. 1995. Accuracy tests for sonic telemetry studies
in an estuarine environment. Journal of Wildlife Management 59:181–188.
Conroy, M. J., and C. T. Moore. 2002. Wildlife habitat modeling in an adaptive
framework: the role of alternative models. Pages 205–218 in J. M. Scott, P. J.
Heglund, and M. L. Morrison, editors. Predicting species occurrences: issues
of accuracy and scale. Island Press, Washington, D.C.
Crouse, D. T., L. B. Crowder, and H. Caswell. 1987. A stage-based population
model for loggerhead sea turtles and implications for conservation. Ecology
68:1412–1423.
De Solla, S. R., R. Bonduriansky, and R. J. Brooks. 1999. Eliminating auto-
correlation reduces biological relevance of home range estimates. Journal of
Animal Ecology 68:221–234.
ESRI (Environmental Systems Research Institute).2008. ArcMap GIS software,
version 9.1. ESRI, Redlands, California.
Goodyear, C. P. 1999. An analysis of the possible utility of time–area closures
to minimize billfish bycatch by U.S. pelagic longlines. U.S. National Marine
Fisheries Service Fishery Bulletin 97:243–255.
Greenstreet, S. P. R., H. M. Fraser, and G. J. Piet. 2009. Using MPAs to address
regional-scale ecological objectives in the North Sea: modelling the effects
of fishing effort displacement. ICES Journal of Marine Science 66:90–100.
Hawkes, L. A., M. J. Witt, A. C. Broderick, J. W. Coker, M. S. Coyne, M. Dodd,
M. G. Frick, M. H. Godfrey, D. B. Griffin, S. R. Murphy, T. M. Murphy, K.
L. Williams, and B. J. Godley. 2011. Home on the range: spatial ecology of
loggerhead turtles in Atlantic waters of the USA. Diversity and Distributions
17:624–640.
Hays, G. C., S. Åkesson, B. J. Godley, P. Luschi, and P. Santidrian. 2001. The
implications of location accuracy for the interpretation of satellite-tracking
data. Animal Behaviour 61:1035–1040.
Hiddink, J. G., T. Hutton, S. Jennings, and M. J. Kaiser. 2006. Predicting
the effects of area closures and fishing effort restrictions on the production,
biomass, and species richness of benthic invertebrate communities. ICES
Journal of Marine Science 63:822–830.
Hopkins-Murphy, S. R., D. W. Owens, and T. M. Murphy. 2003. Ecology of im-
mature loggerheads on foraging grounds and adults in internesting habitat in
the eastern United States. Pages 79–92 in A. B.Bolten and B. E. Witherington,
editors. Loggerhead sea turtles. Smithsonian Institution Press, Washington,
D.C.
Hunter, E., F. Berry, A. A. Buckley, C. Stewart, and J. D. Metcalfe. 2006. Sea-
sonal migration of Thornback Rays and implications for closure management.
Journal of Applied Ecology 43:710–720.
Kobayashi, D. R., I. J. Cheng, D. M. Parker, J. J. Polovina, N. Kamezaki, and
G. H. Balazs. 2011. Loggerhead turtle (Caretta caretta) movement off the
coast of Taiwan: characterization of a hotspot in the East China Sea and
investigation of mesoscale eddies. ICES Journal of Marine Science 68:707–
718.
Kobayashi, D. R., and J. J. Polovina. 2005. Evaluation of time–area closures to
reduce incidental sea turtle take in the Hawaii-based longline fishery: gen-
eralized additive model (GAM) development and retrospective examination.
NOAA Technical Memorandum NMFS-PIFSC-4.
Lenarz, M. S., N. B. Frazer, M. S. Ralston, and R. B. Mast. 1981. Seven nests
recorded for loggerhead turtle (Caretta caretta) in one season. Herpetological
Review 12:9.
Lewison, R. L., S. A. Freeman, and L. B. Crowder. 2004. Quantifying the
effects of fisheries on threatened species: the impact of pelagic long-
lines on loggerhead and leatherback sea turtles. Ecology Letters 7:221–
231.
Mansfield, K. L., V. S. Saba, J. A. Keinath, and J. A. Musick. 2009. Satel-
lite tracking reveals a dichotomy in migration strategies among juvenile
loggerhead turtles in the northwest Atlantic. Marine Biology 156:2555–
2570.
Marcovaldi, M.
ˆ
A., G. G. Lopez, L. S. Soares, E. H. S. M. Lima, J. C. A.
Thom
´
e, and A. P. Almeida. 2010. Satellite-tracking of female loggerhead
turtles highlights fidelity behavior in northeastern Brazil. Endangered Species
Research 12:263–272.
Mason, J., R. Kosaka, A. Mamula, and C. Speir. 2012. Effort changes around a
marine reserve: the case of the California rockfish conservation area. Marine
Policy 36:1054–1063.
Meyer, C. G., and K. N. Holland. 2005. Movement patterns, home range size
and habitat utilization of the Bluespine Unicornfish, Naso unicornis (Acan-
thuridae) in a Hawaiian marine reserve. Environmental Biology of Fishes
73:201–210.
Mitchell, S. V. 2000. Use of epoxy in telemeter attachment. Pages 254–255
in F. A. Abreu-Grobois, R. Brise
˜
no-Due
˜
nas, R. M
´
arquez-Mill
´
an, and L.
Sarti-Mart
´
ınez, editors. Proceedings of the eighteenth international sea turtle
symposium, 3–7 March 1998, Mazatl
´
an, Sinaloa, M
´
exico. NOAA Technical
Memorandum NMFS-SEFSC-436.
Murawski, S. A., R. Brown, H. L. Lai, P. J. Rago, and L. Hendrickson. 2000.
Large-scale closed areas as a fishery-management tool in temperate marine
systems: the Georges Bank experience. Bulletin of Marine Science 66:775–
798.
Murphy, T. M., and S. R. Hopkins. 1984. Aerial and ground surveys of ma-
rine turtle nesting beaches in the southeast region, U.S. Final Report to the
National Marine Fisheries Service, Contract NA83-GA-C-00021, LaMER,
Green Pond, South Carolina.
NMFS (National Marine Fisheries Service) and USFWS (U.S. Fish and Wildlife
Service). 2008. Recovery plan for the northwest Atlantic population of the
loggerhead sea turtle (Caretta caretta), second revision. NMFS, Silver Spring,
Maryland.
Richardson, J. I. 1980. A population model for adult female loggerhead sea
turtles (Caretta caretta) nesting in Georgia. Doctoral dissertation. University
of Georgia, Athens.
SAFMC (South Atlantic Fishery Management Council). 2002. Amendment 5
to the fishery management plan for the shrimp fishery of the South Atlantic
region (rock shrimp), including a final supplemental environmental impact
statement, initial regulatory flexibility analysis, regulatory impact review,
and social impact assessment/fishery impact statement. SAFMC, Charleston,
South Carolina.
Sakamoto, W., T. Bando, N. Arai, and N. Baba. 1997. Migration paths of the
adult female and male loggerhead turtles Caretta caretta determined through
satellite telemetry. Fisheries Science 63:547–552.
Scott, J. A. 2006. Use of satellite telemetry to determine ecology and man-
agement of loggerhead turtle (Caretta caretta) during the nesting season in
Georgia. Master’s thesis. University of Georgia, Athens.
Stelzenm
¨
uller, V., F. Maynou, G. Bernard, G. Cadiou, M. Camilleri,
R. Crec’hriou, G. Criquet, M. Dimech, O. Esparza, R. Higgins, P. Lenfant,
and
´
A. P
´
erez-Ruzafa. 2008. Spatial assessment of fishing effort around Eu-
ropean marine reserves: implications for successful fisheries management.
Marine Pollution Bulletin 56:2018–2026.
Stoneburner, D. L. 1982. Satellite telemetry of loggerhead sea turtle movement
in the Georgia Bight. Copeia 1982:400–408.
Sweeting, C. J., and N. V. C. Polunin. 2005. Marine protected areas for man-
agement of temperate North Atlantic fisheries: lessons learned in MPA
use for sustainable fisheries exploitation and stock recovery. Report to the
290 SCOTT ET AL.
Department for Environment, Food and Rural Affairs, University of Newcas-
tle upon Tyne, Tyne, UK.
Talbert, O. R., Jr., S. E. Stancyk, J. M. Dean, and J. M. Will. 1980. Nesting
activity of the loggerhead turtle (Caretta caretta) in South Carolina—I: a
rookery in transition. Copeia 1980:709–719.
Tucker, A. D. 2010. Nest site fidelity and clutch frequency of loggerhead turtles
are better elucidated by satellite telemetry than by nocturnal tagging efforts:
implications for stock estimation. Journal of Experimental Marine Biology
and Ecology 383:48–55.
Turtle Expert Working Group. 1998. An assessment of the Kemp’s ridley (Lep-
idochelys kempii) and loggerhead (Caretta caretta) sea turtle populations in
the western North Atlantic. NOAA Technical Memorandum NMFS-SEFSC-
409.
Vincent, C., B. J. McConnell, V. Ridoux, and M. A. Fedak. 2002. Assessment
of Argos location accuracy from satellite tags deployed on captive grey seals.
Marine Mammal Science 18:156–166.
Worton, B. J. 1989. Kernel methods for estimating the utilization distribution in
home-range studies. Ecology 70:164–168.