Temperature effects on bioelectrical impedance analysis (BIA) used to estimate dry weight as a condition proxy in coastal bluefish
Bạn đang xem bản rút gọn của tài liệu. Xem và tải ngay bản đầy đủ của tài liệu tại đây (221.66 KB, 11 trang )
BioOne sees sustainable scholarly publishing as an inherently collaborative enterprise connecting authors, nonprofit publishers, academic institutions, research
libraries, and research funders in the common goal of maximizing access to critical research.
Temperature Effects on Bioelectrical Impedance Analysis (BIA) used to Estimate
Dry Weight as a Condition Proxy in Coastal Bluefish
Author(s): Kyle J. HartmanBeth A. Phelan and John E. Rosendale
Source: Marine and Coastal Fisheries: Dynamics, Management, and Ecosystem Science, 3(1):307-316.
2011.
Published By: American Fisheries Society
URL: />BioOne (www.bioone.org) is a nonprofit, online aggregation of core research in the biological, ecological, and
environmental sciences. BioOne provides a sustainable online platform for over 170 journals and books published
by nonprofit societies, associations, museums, institutions, and presses.
Your use of this PDF, the BioOne Web site, and all posted and associated content indicates your acceptance of
BioOne’s Terms of Use, available at www.bioone.org/page/terms_of_use.
Usage of BioOne content is strictly limited to personal, educational, and non-commercial use. Commercial inquiries
or rights and permissions requests should be directed to the individual publisher as copyright holder.
Marine and Coastal Fisheries: Dynamics, Management, and Ecosystem Science 3:307–316, 2011
C
American Fisheries Society 2011
ISSN: 1942-5120 online
DOI: 10.1080/19425120.2011.603961
ARTICLE
Temperature Effects on Bioelectrical Impedance Analysis
(BIA) Used to Estimate Dry Weight as a Condition Proxy in
Coastal Bluefish
Kyle J. Hartman*
Division of Forestry and Natural Resources, West Virginia University, 322 Percival Hall, Morgantown,
West Virginia 26506-6125, USA
Beth A. Phelan and John E. Rosendale
National Marine Fisheries Service, Northeast Fisheries Science Center, Sandy Hook Laboratory,
74 Magruder Road, Highlands, New Jersey 07732, USA
Abstract
The highly migratory nature of bluefish Pomatomus saltatrix makes comprehensive study of their populations
and their potential responses to factors such as competition, habitat degradation, and climate change difficult. Body
composition is an important ecological reference point for fish; however, estimating body composition in fish has been
limited by analytical and logistical costs. We applied bioelectrical impedance analysis (BIA) to estimate one body
composition component (percent dry weight) as a proxy of condition in bluefish. We used a tetra polar Quantum
II BIA analyzer and measured electrical properties in the muscles of bluefish at two locations per fish (dorsal and
ventral). In total, 96 bluefish ranging from 193 to 875 mm total length were used in model development and testing.
On 59 of these fish BIA measures were taken at both 15
◦
Cand27
◦
C. Temperature had a significant negative effect on
resistance and reactance. A subsample of these fish was then analyzed for dry weight as a percentage of their whole
body weight (PDW), which is a good indicator of condition because it is highly correlated with fat content in fish. The
BIA models predicting PDW inclusive of all lengths of bluefish were highly predictive for 15
◦
C (stepwise regression)
and 27
◦
C. Regression (R
2
pred
) values that estimate future predictive power suggest that both models were robust.
Strong relationships between PDW and other body composition components, coupled with the BIA models presented
here, provide the tools needed to quantitatively assess bluefish body composition across spatial and temporal scales
for which assessment was previously impossible.
The growth of fish is believed to be an integrated measure of
well-being that is linked to reproductive success, survival, habi-
tat quality, and competition (Brandt et al. 1992; Roy et al. 2004;
Amara et al. 2009; Vehanen et al. 2009). In aquaculture and
other applications, such as those employing fish bioenergetics
models, growth is often determined by measuring differences
in the total weight of fish over time. However, fish are 60–90%
water, and they often compensate for loss of fat by replacing it
with water, making the use of total weight to measure growth
Subject editor: Debra J. Murie, University of Florida, Gainesville
*Corresponding author:
Received April 7, 2010; accepted January 25, 2011
and condition problematic (Shearer 1994; Breck 2008; Hartman
and Margraf 2008). To fully evaluate growth in weight of fish
requires knowledge of the percent dry mass of the fish. Dry
mass can be measured on an individual by oven drying or by
freeze drying but, in addition to being lethal, this process can be
cumbersome for large individuals or impossible for rare taxa.
Bioelectrical impedance analysis (BIA) has been used to de-
termine water mass in human subjects since the 1970s and is
now widely used in health clubs to assess human body condition.
307
308 HARTMAN ET AL.
Recently, BIA has been developed as a nonlethal method used
to estimate wet and dry masses, as well as lipid, protein, and
ash masses in several species of fish (Cox and Hartman 2005;
Duncan et al. 2007). Cox and Hartman (2005) developed mod-
els to estimate composition masses of brook trout Salvelinus
fontinalis using BIA. Models for cobia Rachycentron canadum
(Duncan et al. 2007) and Great Lakes fish (Pothoven et al.
2008) have also been developed. These studies in fish failed
to consider temperature effects or length bias in their analysis.
Cox and Heintz (2009) found a significant effect of temper-
ature upon BIA-derived phase angle in salmonids, but other
BIA studies with fish ignored the influence of temperature upon
BIA measures. Electrical properties are influenced by tempera-
ture, so it must be considered in model development and model
application.
Previous studies employing BIA to estimate fish body com-
position predicted only body mass (Cox and Hartman 2005;
Duncan et al. 2007). Estimating mass has been problematic be-
cause the length of the electrical circuit (or detector length)
is highly correlated with fish length and measures were made
at consistent relative locations on each fish. This means that
much like BIA use in humans, much of the predictive power
is achieved through the relationship between length (or height)
and mass (Hofer et al. 1969; Lukaski et al. 1985; Kushner and
Schoeller 1986). In theory, fat does not conduct electricity and
hence resistance (i.e., the measure of the opposition by a body
to the passage of a steady electrical current) is sensitive to the
fat levels. Likewise, reactance (i.e., the opposition of a body to
alternating DC due to capacitance of inductance) is sensitive to
cell volume in an area. Thus, although previous work with BIA
in fish primarily estimated body masses, BIA holds the potential
to estimate body percent composition, which is less dependent
on fish length. However, to date only a study by Pothoven et al.
(2008) attempted to estimate lipid percentages in Great Lakes
fish, but without success. However, the Pothoven et al. (2008)
study was field-based and necessarily lacked the range of lipid
levels, or control for temperature effects, that is possible in lab-
oratory studies.
Bluefish Pomatomus saltatrix are an ecologically and eco-
nomically important species along the U.S. Atlantic coast. How-
ever, their widespread distribution makes study of population
demographics and parameters such as body composition and
growth difficult (Salerno et al. 2001). Studies across large spa-
tial scales may identify heterogeneity of body composition or
condition that could identify areas of population stress, pollu-
tion, or competition. However, such studies are currently limited
by our reliance upon measures of condition that are often inaccu-
rate (e.g., total-weight-based measures) or laboratory measures
such as proximate composition, which are either logistically or
economically limiting (Cox and Hartman 2005). Strong predic-
tive relationships have been found that relate percent dry weight
(PDW) to energy content (Hartman and Brandt 1995a) and body
composition (percent lipid and protein) in bluefish (Hartman and
Margraf 2008), indicating that it could be used as a proxy for
overall fish condition. Therefore, the objective of this study was
to evaluate the influence of temperature upon BIA measures and
further develop the BIA tools necessary to measure PDW, as a
proxy for condition, in coastal bluefish.
METHODS
We collected 60 bluefish via angling in the Atlantic Ocean
off Sandy Hook, New Jersey, in October 2006. These blue-
fish were transported alive to the National Oceanic and Atmo-
spheric Administration’s J. J. Howard Marine Sciences Center,
where they were held in water-flow-through tanks. These fish
fell into two length-groups: small bluefish ranging from 193 to
267 mm total length (TL) and larger bluefish ranging from 401 to
875 mm TL. This natural gap in fish length distribution roughly
corresponded to age-0 (small) and older (large) bluefish (Hart-
man and Brandt 1995b).
Fish were separated into tanks based on size, and subse-
quently 32 were fed thawed fish ad libitum daily to achieve high
body condition and 28 were fasted (about 1 month for age-0 fish
or about 2 months for older fish) to achieve low body condition.
Our goal in this study was to obtain bluefish of varying sizes
and varying fat levels from which to develop model data sets for
BIA analysis. Therefore, feeding regimes were considered of
secondary importance to developing bluefish of differing body
composition; using these fish we also coincidentally evaluated
the influence of temperature upon their BIA measures. Thus,
although some fish were fasted and others were fed, these were
not true “treatments” in the experimental design but rather were
conditions under which bluefish were held to ensure the range
of body conditions needed for the study.
We also collected 36 bluefish (198–452 mm TL) in August
2006 in the Patuxent River off Solomons, Maryland. These fish
were transported to Chesapeake Biological Laboratory, where
they were held in water-flow-through tanks for less than 24 h
before their BIAs were measured at ambient water temperatures
of 27
◦
C. These Maryland fish were included in model and test
data sets for the 27
◦
C models and were assumed to represent
fish of intermediate body condition (i.e., neither fasted nor fed
ad libitum in their natural environment).
Bioelectrical impedance measurement.—We used a tetra po-
lar Quantum II BIA Analyzer (RJL Systems, Clinton Township,
Michigan) to measure the electrical properties of the bluefish.
The BIA analyzer was equipped with a pair of 28-gauge stainless
steel needle electrodes with signal and detector electrodes fixed
at 10 mm apart for each electrode (Cox and Hartman 2005). Fish
were anesthetized in MS-222 (tricaine methanesulfonate) and
placed on their right side on a nonconductive surface. Needle
electrodes (5-mm insertion length) were inserted into the fish
at consistent locations: dorsally (posterior to the opercula and
anterior of the caudal fin with both positioned midway between
the lateral line and dorsal midline) and ventrally (posterior of
the pelvic fin and anterior of the anal fin near the ventral mid
line; Figure 1). For both the dorsal and ventral locations we
TEMPERATURE EFFECTS ON BIA 309
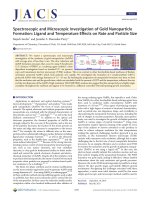
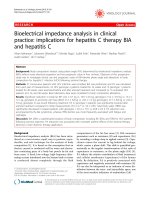
FIGURE 1. Placement of bioelectrical impedance analysis probes on the bluefish. Dorsal measures were located midway between the lateral line and dorsal
midline, one probe in vertical alignment with the posterior edge of the opercle and the second midway between the posterior of the second dorsal fin and the
anterior edge of the caudal peduncle. Ventral measures were along the ventral midline, one probe immediately posterior to the pelvic fin insertions and the other
posterior to the anal vent.
recorded the resistance and reactance and the electrode place-
ment length (or detector length, a measure of the electrical path
between electrodes) for each fish. We also recorded total length
(mm) and weight (g) of each fish, and each fish was tagged with
a passive integrated transponder (PIT) tag to identify it for later
BIA measures (in the temperature experiment) or for laboratory
measures of dry mass. Once all measures were completed on a
fish it was euthanatized in an overdose of MS-222, bagged and
frozen for later analysis of dry mass. To determine this, PIT tags
were removed and fish were filleted to increase surface area for
drying, and then the entire fish was dried in an oven at 70
◦
C until
a constant dry weight was achieved (range of 3–5 d). Percent
dry weight was calculated for each fish: total dry weight as a
percentage of total wet weight.
Temperature experiment.—To evaluate the influence of tem-
perature on BIA measures in bluefish, we measured the BIAs of
PIT-tagged individuals at warm (27
◦
C) and cold (15
◦
C) temper-
atures. We were only able to control temperatures at J.J. Howard
Marine Sciences Center, so only the Sandy Hook fish were used
in the temperature experiments.
Prior to our taking BIA measures, 59 bluefish were accli-
mated to 27
◦
C for a period of 2 weeks. Individuals were then
anesthetized in MS-222; PIT-tagged with a unique code; mea-
sured for length and weight; and finally both dorsal and ventral
measures of resistance, reactance, and detector lengths were
determined. Once these measures were completed the fish was
immediately placed into another tank and maintained at 15
◦
C
for 24–36 h before it was anesthetized and remeasured for BIA
at this lower temperature. Fish were then euthanatized in an
overdose of MS-222. We assumed that the body composition
did not change appreciably between BIA measures over this
time and that body composition at the start of the experiment
(27
◦
C) was the same as at the end of the experiment (15
◦
C). The
resulting repeated measure on each individual was used to eval-
uate temperature effects on dorsal and ventral BIA measures.
A series of independent paired t-tests (α = 0.05) were used to
test for differences in dorsal resistance, dorsal reactance, ven-
tral resistance, ventral reactance, and dorsal and ventral detector
lengths measured at 15
◦
C with those at 27
◦
C.
Model development and validation.—Bioelectrical imped-
ance analysis measures provide resistance and reactance of the
fish from which we calculate additional electrical properties
used as candidate predictor variables in the BIA model. These
electrical properties include resistance in series, resistance in
parallel, capacitance in series, capacitance in parallel, reactance
in series, reactance in parallel, and phase angle (Cox and Hart-
man 2005; Table 1). Resistance and reactance are affected by
the length of the circuit (detector length). Therefore, we also
calculated standardized impedance measures by dividing resis-
tance and reactance by the detector length and included them
as candidate variables in our BIA models (Table 1, E8 and E9,
respectively). Stepwise regression was used to determine the
best fit model for prediction of percent dry weight. We eval-
uated variables from electrical properties derived from single
310 HARTMAN ET AL.
TABLE 1. Electrical variables for AC series and parallel circuits used as candidate predictor variables in bioelectrical impedance analysis models of bluefish
percent dry weight. The variables were calculated for both dorsal and ventral measurement locations.
Electrical variable Abbreviation Units Measure or equation
Detector length DL mm Linear measure between electrodes
Resistance in series R Ω (ohms) Measured directly by Quantum II
Reactance in series Xc Ω Measured directly by Quantum II
Resistance index E1 Ω DL
2
/R
Parallel resistance index E2 Ω DL
2
/LRp, where LRp = R + (Xc
2
/R)
Reactance index E3 Ω DL
2
/Xc
Parallel reactance index E4 Ω DL
2
/LXcp, where LXcp = Xc + (R
2
/Xc)
Parallel capacitance index E5 pF (picofarads) DL
2
/LCpf , where LCpf = (π
.
E7)/Xc
Impedance index E6 Ω DL
2
/LZ, where LZ = (R
2
+ Xc
2
)
0.5
Phase angle E7
◦
(degrees) atan(Xc/R)
Standardized resistance E8 Ω/mm R/DL
Standardized reactance E9 Ω/mm Xc/DL
BIA locations (dorsal or ventral BIA measures) as well as both
dorsal and ventral locations in the models.
We also evaluated whether all sizes of bluefish could be
included in a single model for each temperature or whether
models for discrete sizes were warranted. Although the goal
was to develop a single model for bluefish across all lengths,
models specific to length-groups of fish could be more accurate
in estimating fish PDW because a small fish at 28% PDW could
be in higher condition than a large fish at 28% PDW. When
we parsed the data set by fish length-groups (small versus large
fish), we lacked sufficient sample size to further split the data into
model and test data sets for small and large bluefish. Therefore,
we used the complete data set (N = 60 at 15
◦
C and N = 95 at
27
◦
C) to develop models for small (<400 mm TL) and large
(≥400 mm TL) bluefish.
Using the data sets for small and large bluefish at each
temperature, we determined the best models to predict the
percent dry weight of bluefish by using electrical properties
from dorsal-only measures, ventral-only measures, and dor-
sal and ventral measures simultaneously. Measurement loca-
tions or combination of locations were evaluated because a sin-
gle or multiple measurement location potentially represents a
tradeoff between time in handling fish and accuracy in pre-
dictions of body composition. By comparing relative model
fit and the number of model parameters retained, we evalu-
ated whether models developed using bluefish of all lengths
combined performed as well as those based on discrete length-
groups. To evaluate the fit of these models for each data set,
a leave-one-out validation approach using prediction sum of
squares (PRESS) residuals was used (Myers 1990; Rosen-
berger and Dunham 2005). The PRESS residuals are estimated
by leaving a single observation out and calculating a resid-
ual by subtracting the observed value from that predicted by
a regression model predicted with the remaining observations.
The PRESS residuals were compared with residuals estimated
from the overall means model producing an R
2
-like statis-
tic (R
2
pred
) that indicates the overall predictive performance
(Myers 1990).
After determining that a model using all observations (N = 60
at 15
◦
C, and N = 95 at 27
◦
C), which included all lengths of blue-
fish, performed comparably to BIA models for discrete length-
groups, we proceeded with developing and testing a bluefish
BIA model at 15
◦
C and 27
◦
C using a model and an indepen-
dent test data set. The observations on 59 Sandy Hook fish were
sorted by total length and then every fourth observation was
removed for the model data set until the model set contained 41
and the test set included 18 fish at 15
◦
C and 27
◦
C. One addi-
tional fish was measured at 15
◦
C only and included in the 15
◦
C
model data set. The Patuxent River fish were all collected at
27
◦
C, so these observations were randomly assigned to either
the 27
◦
C model (N = 28) or 27
◦
Ctest(N = 8) data sets. Hence,
the 15
◦
C model and test sets contained 42 and 18 observations,
respectively, while the 27
◦
C model and test data sets contained
69 and 26 observations. The test and model sets were similar
with respect to the lengths of fish (15
◦
C: test = 207–807 mm,
model = 193–844 mm; 27
◦
C: test = 204–807 mm, model =
193–875 mm) and the range of percent dry weights of fish
(15
◦
C: test = 20.2–40.4%, model = 16.3–40.3%; 27
◦
C: test
= 20.2–40.4%, model = 20.2–40.6%) at each temperature
(Figure 2).
Once these 15
◦
C and 27
◦
C models were established, we eval-
uated them using PRESS residuals as above and then conducted
a sensitivity analysis by increasing or decreasing the resistance,
reactance, and detector length values from the dorsal and ventral
locations individually by ±10% and compared the model pre-
dictions of PDW. A measured variable was considered sensitive
if varying the input by 10% resulted in more than a 10% change
in the predicted PDW (Bartell et al. 1986).
TEMPERATURE EFFECTS ON BIA 311
10
15
20
25
30
35
40
45
100 300 500 700 900
Percent dry weight
Total length (mm)
Model
Test
27
o
C
only
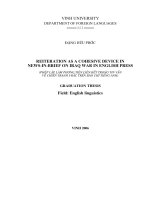
FIGURE 2. Test and model data sets used for validating that bluefish bioelec-
trical impedance analysis models for percent dry weight (PDW) were similar
with respect to the distribution of total lengths and PDW. Data points for fish
300–475 mm in length were only available at 27
◦
C, while those for fish of all
other lengths were available at both 15
◦
C and 27
◦
C.
RESULTS
Temperature Influence on BIA Measures
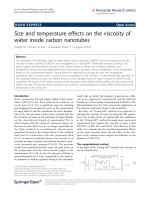
Temperature had a significant, negative influence on the re-
sistance and reactance of bluefish tissue (Figure 3). Dorsal resis-
tance, dorsal reactance, ventral resistance, and ventral reactance
between 27
◦
C and 15
◦
C for all lengths and between discrete
length-groups (small and large) of bluefish were all signifi-
cantly different (paired t-tests: all P < 0.015), although detector
length between measures at each temperature were not signifi-
cant (paired t-tests: all P > 0.11 for dorsal and ventral). Across
both length-groups of fish, the average dorsal resistance de-
clined 35.8% and ventral resistance declined 20.4% from 15
◦
C
to 27
◦
C. Reactance measures declined at lower rates than re-
sistance but were similar between dorsal (−12.7%) and ventral
measures (−12.9%) from 15
◦
Cto27
◦
C.
Fish Size Influence on BIA Models
Models combining all lengths of bluefish were significant
(P < 0.001) at both temperatures and explained 86% of the
variability in the percent dry weight of bluefish at both temper-
atures (Table 2; Figure 4). At 15
◦
C the model for small bluefish
had an additional parameter retained in the model, a similar
coefficient of determination (83%), but a lower R
2
pred
than the
model using all lengths of fish. The 15
◦
C model for large blue-
fish had a poorer fit than the model for all lengths and had an
R
2
pred
of only 26%. For 27
◦
C data the model for large bluefish
provided a slightly better fit and higher R
2
pred
than the model for
all lengths, but the model for small bluefish at 27
◦
C explained
only 77% of variation in the data and had a relatively low R
2
pred
.
Based upon these results, we determined that within the confines
of our data, a single model incorporating all lengths of bluefish
was a better approach to using BIA measures to predict percent
dry weight than models for different length-groups of bluefish.
The resulting model to predict PDW from BIA measures in
0
50
100
150
200
250
300
350
400
450
500
15 27
Resistance (ohms)
Small <400 mm
dorsal
ventral
0
50
100
150
200
250
300
350
15 27
Resistance (ohms)
Large >400 mm
dorsal
ventral
0
20
40
60
80
100
120
140
160
15 27
Reactance (ohms)
Small <400 mm
dorsal
ventral
0
20
40
60
80
100
120
140
15 27
Reactance (ohms)
Large >400 mm
dorsal
ventral
Temperatu re (
o
C)
FIGURE 3. Dorsal and ventral resistance and reactance for small and large bluefish at 15
◦
C and 27
◦
C, showing that the effects of temperature on impedance
were negative and significant. Error bars represent 95% confidence intervals about the means.
312 HARTMAN ET AL.
TABLE 2. Regression models using all bluefish observations to evaluate whether size-specific (small, <400 mm total length; large, ≥400 mm) or all-size-
inclusive models are needed to accurately predict percent dry weight from electrical properties calculated from bioelectrical impedance analysis measures of
bluefish at 15
◦
C and 27
◦
C. The variables (defined in Table 1) are differentiated here as dorsal (D) or ventral (V) (e.g., DE8 refers to the dorsal E8 variable). Fits
were compared between models using all sizes of bluefish and individual models based on fish length-groups.
Data set Variables R
2
N df FPR
2
pred
15
◦
C
All lengths DE8, DE9, VE7 0.86 60 3, 56 112.6 < 0.0001 0.834
Small DE2, DE4, DE7, VE5 0.83 38 5, 32 30.9 <0.0001 0.757
Large VE3, VE9, VE3, VE8 0.72 22 4, 17 10.90.001 0.260
27
◦
C
All lengths DE2, DE5, DE7, DE8, DE9 0.86 95 10, 84 52.6 < 0.0001 0.818
VE1, VE3, VE5, VE7, VE9
Small DE3, DE7, VE1, VE3, 0.77 59 7, 51 24.6 < 0.0001 0.716
VE4, VE5, VE9
Large DE8, DE9, VE5, VE8 0.91 36 4, 31 77.6 < 0.0001 0.875
bluefish of all lengths at 15
◦
Cwas
PDW = 52.19 − 9.3832 (DE8) + 21.2225 (DE9)
− 45.2875 (VE7), (1)
15
20
25
30
35
40
45
15
o
C
15
20
25
30
35
40
45
15 20 25 30 35 40 45
27
o
C
Observed percent dry weight
Predicted percent dry weight
FIGURE 4. Relationships between the percent dry weight (PDW) predicted by
the full bioelectrical impedance analysis models given in Table 2 and observed
PDW in bluefish at two temperatures; the relationships were significant (all
lengths and both dorsal and ventral measures included; P < 0.0001). The models
incorporating both size-groups of fish explained 86% or more of the variability
in the data at 15
◦
C and 27
◦
C.
where DE8 is dorsally measured standardized resistance, DE9 is
dorsally measured standardized reactance, and VE7 is ventrally
measured phase angle (Table 1).
At 27
◦
C the model for all lengths of bluefish was
PDW = 69.89+0.0385 (DE2)−2.1466 (DE5)−51.5251 (DE7)
− 18.0264 (DE8) + 42.0259 (DE9) + 0.1781 (VE1)
− 0.1084 (VE3) + 25.0913 (VE5) − 72.3870 (VE7)
+ 5.6953 (VE9), (2)
where the electrical variable abbreviations (e.g., DE2, DE5, etc.)
are those reported in Table 1.
Influence of Position on BIA Measures
Models with the highest coefficients of determination were
achieved when both dorsal and ventral measures were included
(Table 3). Using the model data set at 27
◦
C, predictive models
using only the dorsal BIA measures explained 71.5% of vari-
ation and ventral-only BIA measures explained 65.5% of vari-
ation. Models including both dorsal and ventral BIA measures
explained 78.3% of variation. The R
2
pred
was 72.5%, suggesting
strong future predictive power of the model.
Similarly, predictive models based on BIA measures at 15
◦
C
explained between 73.0% (ventral only) and 82.6% (dorsal only)
of the variation in percent dry weight (Table 3). When both
dorsal and ventral BIA measures were included in the candidate
variables, 85.5% of the variation was explained by the model.
Future predictive power of the full (dorsal and ventral measures)
model was 81.4% (Table 3).
BIA Model Validation
Models using all lengths of bluefish with BIA measures taken
at both dorsal and ventral positions at 15
◦
C and 27
◦
C (Table 3)
were validated using independent test data sets for each temper-
ature and found to provide reasonable estimates of percent dry
TEMPERATURE EFFECTS ON BIA 313
TABLE 3. Equations using the model data sets to predict bluefish percent dry weight (PDW) at 15
◦
Cversus27
◦
C from electrical properties calculated from
dorsal-only, ventral-only, and dorsal-and-ventral bioelectrical impedance analysis measures.
Model R
2
FPNR
2
pred
Holding temperature of 15
◦
C
Dorsal only:
PDW = 36.14 − 8.1296(LE8) + 19.4718(LE9) 0.826 92.6 < 0.0001 42 0.795
Ventral only:
PDW = 64.33 − 78.684(VE7) – 9.729(VE8) + 25.635(VE9) 0.730 34.3 <0.0001 42 0.669
Dorsal and ventral:
PDW = 50.23 − 9.718(LE8) + 22.554(LE9) − 39.353(VE7) 0.855 74.4 <0.0001 42 0.814
Holding temperature of 27
◦
C
Dorsal only:
PDW = 70.86 + 0.0197 (LE2) − 0.0609 (LE3) − 123.282 (LE7)
− 19.16 (LE8) + 54.3025 (LE9)
0.715 31.6 < 0.0001 69 0.652
Ventral only:
PDW = 17.12 − 0.028 (VE3) + 30.577 (VE5) + 30.881 (VE7) 0.655 41.2 <0.0001 69 0.616
Dorsal and ventral:
PDW = 21.32 + 2.126 (LE5) − 10.983 (LE8) + 22.935 (LE9)
+ 9.336 (VE5) + 3.055 (VE8)
0.783 45.4 < 0.0001 69 0.725
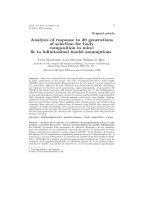
weight. Correlations between predicted and observed percent
dry weight were highly significant (R
2
values of 0.87 for both
27
◦
C and 15
◦
C), neither relationship between observed and pre-
dicted values differing significantly from a 1:1 line (Figure 5).
BIA Model Sensitivity
The bluefish models using all lengths at 15
◦
C and 27
◦
C
(Table 3) were not sensitive to errors of ±10% in the measure-
ment of resistance, reactance, or detector length (Figure 6). The
most sensitive parameter at either temperature was resistance
measured dorsally (DRES), where a 10% error in DRES resulted
in a change in predicted PDW of ±10.5% at 15
◦
Cor+7.0%
at 27
◦
C. Overall, however, PDW was insensitive to all other
errors of ±10% in measured variables at both 15
◦
C and 27
◦
C
(Figure 6).
DISCUSSION
The BIA approach used in this paper offers several improve-
ments over previously published work with fish. First, most pre-
vious studies used BIA to estimate masses of body constituents
such as water mass, lipid mass (Bosworth and Wolters 2001; Cox
and Hartman 2005; Duncan et al. 2007; Duncan 2008). Estimat-
ing masses from BIA using the electrical properties presented
in Table 1, as was previously done, yields high coefficients of
determination, largely because of the high correlation between
fish length and weight and the use of detector length (highly
correlated with fish length) in the numerator of most of the
electrical equations. Although we might expect a relationship
between fish length and percent composition (e.g., longer fish
may also have a higher lipid and lower water percentage) this
relationship is much weaker (explaining 55% of variability in
PDW) than the ones between detector length and mass or to-
tal length and mass, which each explain more than 99.6% of
variation in bluefish mass. In fact, in the models presented in
Table 3, the variables retained in the models tended to be those
for which impedance measures were standardized by detector
length. Thus, predictive capabilities of BIA models developed
here for bluefish appear relatively unaided by underlying length
relationships, similar to previous studies.
In addition to limiting length bias, our study also documented
significant temperature affects on BIA observations. Bioelec-
trical impedance analysis has been widely used in humans to
estimate body composition, particularly water masses, but ap-
plications to fish add challenges. Because electrical conductivity
of materials is affected by temperature, the poikilothermic sta-
tus of most fish means that resistance and reactance will differ
for a given fish under different water temperatures. With all
other variables constant, resistance will increase as tempera-
ture declines in fish. The model presented by Cox and Hartman
(2005) included data gathered at a narrow range of temperatures
(12–14
◦
C) and did not consider temperature effects. Attempts
to use BIA with field-caught fish by Pothoven et al. (2008)
did not account for temperature differences because fish sam-
ples were pooled for May–September and June–October collec-
tions. Duncan (2008) suggested that temperature had no signif-
icant effect on BIA measures over a 10
◦
C range and advocated
that field researchers need not consider temperature effects on
BIA measures. However, Duncan’s experiments used only five
314 HARTMAN ET AL.
FIGURE 5. Comparison of the full bioelectrical impedance analysis models
given in Table 3 (all lengths and both dorsal and ventral measures included) with
an independent test data set at 15
◦
C and 27
◦
C. The models accurately predicted
percent dry weight (PDW) in bluefish (note that the predicted and observed
PDW yielded R
2
= 0.867 for both 15
◦
C and 27
◦
C, the resulting relationships
not differing from 1:1 [dashed line] at either temperature).
individuals at each test temperature without measuring each
fish at each temperature. As a result, differences in impedance
among fish related to different body composition and low sam-
ple size limited the ability to detect temperature influence on
BIA. In our study, 59 bluefish were each measured at 15
◦
C and
27
◦
C, and temperature was found to significantly affect resis-
tance and reactance. As a result, we believe temperature must
be accounted for in using BIA to assess fish composition or
condition.
In this paper we presented BIA models to estimate PDW
at two t emperatures. While these temperatures nearly cover
the range of water temperatures typically occupied by blue-
fish (12–29
◦
C; Olla and Studholme 1971), more data on the
influence of temperature on resistance and reactance measures
are needed to determine the shape (linear or nonlinear) of the
temperature relationship so temperature corrections can be in-
corporated into BIA models. For now, we recommend using
models formulated by equations (1) and (2) because they pro-
vide relatively higher R
2
and R
2
pred
for bluefish measured at
15
◦
Cor27
◦
C. Of note, we differentiate measurement tempera-
ture from collection temperature because fish body temperature
can significantly change in a short time on deck or on ice, which
can affect the accuracy of BIA. If temperature effects on re-
sistance and reactance in bluefish are determined to be linear
in future studies, then our measures suggest that resistance and
reactance measures decline by less than 2.5% per 1
◦
C increase
in temperature. Such relationships with temperature should be
easily incorporated into corrections that permit use of these es-
tablished BIA models for bluefish at 15
◦
C and 27
◦
C.
It is interesting that across the BIA models presented in
Tables 2 and 3 relatively few consistent candidate variables
were retained across temperatures and length-groups. When all
observations were included at 15
◦
C and 27
◦
C (no test data set)
the standardized dorsal resistance (DE8), standardized dorsal re-
actance (DE9), and ventral phase angle (VE7) were retained in
models for each temperature, but the 27
◦
C model also retained
seven other variables. In contrast, the 27
◦
C model from the
model data set (Table 3) retained a maximum of five variables.
This difference in numbers of parameters retained suggests some
-15
-10
-5
0
5
10
15
15
o
C
-10%
10%
Percent change
-15
-10
-5
0
5
10
15
DRES DREA DDLEN VRES VREA VDLEN
27
o
C
FIGURE 6. Parameter sensitivity analysis of the full bioelectrical impedance
analysis models given in Table 3, showing the effects of varying the measured
parameters by +10% (unshaded bars) or −10% (shaded bars). Abbreviations are
as follows: DRES = dorsally measured resistance, DREA = dorsally measured
reactance, DDLEN = dorsally measured detector length, VRES = ventrally
measured resistance, VREA = ventrally measured reactance, and VDLEN =
ventrally measured detector length. Only dorsally measured resistance at 15
◦
C
was considered marginally sensitive (i.e., a 10% change in the parameter resulted
in a 10.5% change in the estimate of PDW); up to 10% errors in measurement
of other parameters had little effect on the estimates of PDW.
TEMPERATURE EFFECTS ON BIA 315
models could be over-parameterized. However, Mallow’s Cp
statistic for the 27
◦
C model was 8.9, indicating good fit. While
the exact reason for a lack of common variables retained across
all data sets is unknown, several factors could have contributed
to the differences. First, the stepwise regression approach we
used considered 9–18 different candidate variables for single-
location or two-location models, and with such a large number
of variables each derived from three to six measured properties
(R, Xc, DL in Table 1), it is unlikely the same variables will
be retained from each data set. Differences in retained variables
across models of different fish length-groups can also be par-
tially explained by differences in where and how fish of different
sizes store lipids (Shearer et al. 1994). While it would be as-
suring to always retain the same suite of candidate variables in
these BIA models, our goal was to develop models that accu-
rately predict PDW in bluefish. The R
2
pred
values for models
of all lengths of bluefish exceeded 0.82 at each temperature,
suggesting we can accurately predict PDW of bluefish with the
models.
The ability to use BIA to estimate fish composition from
PDW has several advantages. Duncan (2008) determined that
the cost to estimate body composition using BIA was 2.4–5.1%
of the cost using traditional proximate composition analytical
methods. This relative cost suggests 20–40 times more obser-
vations can be gathered using BIA than could be processed
using analytical methods. This low relative cost makes it pos-
sible to greatly enhance the spatial and temporal coverage of
measures that can be afforded in fisheries studies, which has
special relevance for coastal migratory species such as bluefish.
Other advantages of BIA are that once a model is developed and
validated it can be used nonlethally on other fish of the same
species (Cox and Hartman 2005), and when using BIA mod-
els to estimate percent dry weight, the other body composition
percentages can be estimated using body composition models.
Hartman and Margraf (2008) found percent dry weight can be
used with high precision and accuracy to estimate lipid, protein,
and ash percentages in several species of fish, including blue-
fish. Combining BIA with models such as those in Hartman and
Margraf (2008) or Sutton et al. (2000) may greatly reduce or
eliminate the need for chemical analysis of fish for proximate
analysis, thereby further reducing costs.
For highly migratory species such as bluefish, assessing
population-level changes is often complicated by the difficulty
of obtaining population estimates and other vital statistics. Such
difficulties may prevent the detection of population responses
to climate change, habitat degradation, and competition. The
bluefish BIA models presented in this paper provide the tool
necessary to begin monitoring bluefish populations via composi-
tional measurements of individuals collected over broad spatial
and temporal scales, which may be boosted by piggybacking on
existing fisheries assessment and monitoring programs. Equip-
ment needed for BIA is relatively inexpensive (under US$2,500
based on 2010 prices) and very minimal training is required to
operate the instrument. Thus, BIA can be added to ongoing fish-
eries sampling programs that commonly handle bluefish at both
a very low cost and with the potential to greatly improve our
understanding of spatial and temporal population demographics.
Suggestions for Future BIA Model Development
Several factors that may affect BIA model precision and
accuracy should be considered when using existing models or
developing models for new species. These recommendations are
based on our experience developing BIA models for brook trout,
Pacific salmon, striped bass Morone saxatilis, and bluegills Lep-
omis macrochirus (Cox and Hartman 2005; Hartman unpub-
lished data) and are meant to help guide future BIA applica-
tions on fish. First, fish temperature must be accounted for in
impedance measures during model development and model use.
Fish temperatures can easily be measured internally by inserting
a temperature probe into the esophagus (for live fish) or rectally
(for dead fish). The BIA measurements must also be taken in
consistent locations across individual fish and in the same lo-
cation used in model development. Measurements at different
locations will assess different fish body substrates (tissues, fats,
and inert materials) with different impedance measures and cir-
cuit lengths than those for which a model was developed, which
will therefore yield inaccurate predicted values. Researchers
should explore impedance measurement locations for untested
species to determine the best location or combination of loca-
tions to produce the most accurate and precise results. Electrode
needles should also match those for which the model was devel-
oped in terms of penetration length and distance between signal
and detecting electrodes on a probe. In developing models, it is
also important for the fish sampled to adequately span the range
of lengths and body conditions for the species. Often, this is not
possible with fish caught in the wild, so model development in
the controlled conditions of the laboratory may be necessary.
ACKNOWLEDGMENTS
We are grateful to J. Howell, G. Staines, and J. Nye for assis-
tance in field collections and measures and to J. Rosendale for
collection and husbandry of bluefish used at Sandy Hook. A.
Hafs provided comments that improved this manuscript. Fund-
ing for this project was provided by the 2004 Bluefish-Striped
Bass Dynamics Research Program to KJH. All procedures in-
volving fish were conducted under guidelines approved by the
West Virginia University Animal Care and Use Committee un-
der protocol 05-0201.
REFERENCES
Amara, R., J. Selleslagh, G. Billon, and C. Minier. 2009. Growth and condition
of 0-group European flounder, Platichthys flesus as indicator of estuarine
habitat quality. Hydrobiologia 627:87–98.
Bartell, S. M., J. E. Breck, R. H. Gardner, and A. L. Brenkert. 1986. Individ-
ual parameter perturbation and error analysis of fish bioenergetics models.
Canadian Journal of Fisheries and Aquatic Sciences 43:160–168.
Bosworth, B. G., and W. R. Wolters. 2001. Evaluation of bioelectric impedance
to predict carcass yield, carcass composition, and fillet composition in farm-
raised catfish. Journal of the World Aquaculture Society 32:72–78.
316 HARTMAN ET AL.
Brandt, S. B., D. M. Mason, and E. V. Patrick. 1992. Spatially-explicit models
of fish growth rate. Fisheries 17(2):23–31.
Breck, J. E. 2008. Enhancing bioenergetics models to account for dynamic
changes in fish body composition and energy density. Transactions of the
American Fisheries Society 137:340–356.
Cox, M. K., and K. J. Hartman. 2005. Non-lethal estimation of proximate
composition in fish. Canadian Journal of Fisheries and Aquatic Sciences
62:269–275.
Cox, M. K., and R. Heintz. 2009. Electrical phase angle as a new method
to measure fish condition. U.S. National Marine Fisheries Service Fishery
Bulletin 107:477–487.
Duncan, M., S. R. Craig, A. N. Lunger, D. D. Kunn, G. Salze, and E. McLean.
2007. Bioimpedance assessment of body composition in cobia Rachycentron
canadum (L. 1766). Aquaculture 271:432–438.
Duncan, M. B. 2008. The use of bioelectrical impedance analysis for estimat-
ing the body composition of various fish species. Master’s thesis. Virginia
Polytechnic Institute and State University, Blacksburg.
Hartman, K. J., and S. B. Brandt. 1995a. Estimating energy density of fish.
Transactions of the American Fisheries Society 124:347–355.
Hartman, K. J., and S. B. Brandt. 1995b. Trophic resource partitioning, diets,
and growth of sympatric estuarine predators. Transactions of the American
Fisheries Society 124:520–537.
Hartman, K. J., and F. J. Margraf. 2008. Common relationships among proximate
composition components in fish. Journal of Fish Biology 73:2352–2360.
Hofer, E. C., C. K. Meador, and D. C. Simpson. 1969. Correlation of whole-
body impedance with total body water volume. Journal of Applied Physiology
27:531–534.
Kushner, R. F., and D. A. Schoeller. 1986. Estimation of total body water
by bioelectrical impedance analysis. American Journal of Clinical Nutrition
44:417–424.
Lukaski, H. C., P. E. Johnson, W. W. Bolonchuk, and G. I. Lykken. 1985.
Assessment of fat-free mass using bioelectrical impedance measurements of
the human body. American Journal of Clinical Nutrition 41:81–817.
Myers, R. H. 1990. Classical and modern regression with applications, 2nd
edition. Duxbury Press, North Scituate, Massachusetts.
Olla, B. I., and A. L. Studholme. 1971. The effect of temperature on the activity
of the bluefish, Pomatomus saltatrix L. Biological Bulletin 141:337–349.
Pothoven, S. A., S. A. Ludsin, T. O. Hook, D. L. Fanslow, D. M. Mason,
P. D. Collingsworth, and J. J. Van Tassell. 2008. Reliability of bioelec-
trical impedance analysis for estimating whole-fish energy density and
percent lipids. Transactions of the American Fisheries Society 137:1519–
1529.
Rosenberger, A. E., and J. B. Dunham. 2005. Validation of abundance estimates
from mark–recapture and removal techniques for rainbow trout captured by
electrofishing in small streams. North American Journal of Fisheries Man-
agement 25:1395–1410.
Roy, D., G. D. Haffner, and S. B. Brandt. 2004. Estimating fish production
potentials using a temporally explicit model. Ecological Modelling 173:
241–257.
Salerno, D. J., J. Burnett, and R. M. Ibara. 2001. Age, growth, maturity and spa-
tial distribution of bluefish, Pomatomus saltatrix (Linnaeus), off the northeast
coast of the United States, 1985–96. Journal of Northwest Atlantic Fishery
Science 29:31–39.
Shearer, K. D. 1994. Factors affecting the proximate composition of cultured
fishes with emphasis on salmonids. Aquaculture 119:63–88.
Shearer, K. D., T. Asgard, G. Andorsdottir, and G. H. Has. 1994. Whole body
elemental and proximate composition of Atlantic salmon (Salmo salar) during
the life cycle. Journal of Fish Biology 44:785–797.
Sutton, S. G., T. P. Bult, and R. L. Haedrich. 2000. Relationships among
fat weight, body weight, water weight, and condition factors in wild At-
lantic salmon parr. Transactions of the American Fisheries Society 129:527–
538.
Vehanen, T., A. Huusko, and R. Hokki. 2009. Competition between hatchery-
raised and wild brown trout Salmo trutta in enclosures – do hatchery re-
leases have negative effects on wild populations? Ecology of Freshwater Fish
18:261–268.